# Output
# Summary
# OutputNetworkSummary
# Scenario
Applicable Algorithms: NO
Description:
- Indicates the optimization model data Scenario.
# ModelCompleteTime
Applicable Algorithms: NO
Description:
- Indicates the running Date and Time of the model.
# ModelRunTime
Applicable Algorithms: NO
Description:
- Indicates the running time of the optimization model (unit: hours).
# ModelOptimizationType
Applicable Algorithms: NO
Description:
- Indicates the type of optimization model, minimize cost, maximize revenue, maximize profit.
# ModelPeriodInDays
Applicable Algorithms: NO
Description:
- Indicates the number of days covered by the Time of the optimized model.
# TotalProfit
Applicable Algorithms: NO
Description:
- Indicates the Total Profit brought by optimized network and inventory structure.
- Total Profit = Total Revenue - Total Cost.
# TotalCost
Applicable Algorithms: NO
Description:
- Indicates the total network cost of the optimized model.
- Total Cost=Total Fixed Startup Cost+Total Fixed Operating Cost+Safety Inventory Holding Cost+Total Closing Cost+Total Production Cost+Total Warehousing Cost+Total Warehousing Cost+Transportation Cost+Total Sourcing Cost+Total Work Resource Cost+Total Expression Cost+Total Inventory Holding Cost+Total Demand Penalty.
# TotalRevenue
Applicable Algorithms: NO
Description:
- Indicates the revenue generated by each unit Product sold to customer in the optimization model.
- The Total Revenue is equal to the Total Revenue in the OutputProductSummary or the Total Revenue in the OutputSiteSummary.
# TotalFixedStartupCost
Applicable Algorithms: NO
Description:
- Indicates the Total Cost of optimized network to set up potential Site and Work Center.
- Total Fixed Startup Cost = Total Fixed Startup Cost in the OutputSiteSummary + Total Fixed Startup Cost in the OutputWorkCenterSummary.
# TotalFixedOperatingCost
Applicable Algorithms: NO
Description:
- Indicates the Total Cost generated by optimized network to maintain the normal operation of Site and Work Center .
- Total Fixed Operating Cost = Total Fixed Operating Cost of OutputSiteSummary + Total Fixed Operating Cost in the OutputWorkCenterSummary.
# SafetyStockCost
Applicable Algorithms: NO
Description:
- Safety stock cost is generated from the safety stock optimization strategy details after running the inventory optimization model.
# TotalClosingCost
Applicable Algorithms: NO
Description:
- Indicates the Total Cost generated by optimizing network of closing the Site and Work Center.
- Total Closing Cost = Total Closing Cost in the OutputSiteSummary + Total Closing Cost in the OutputWorkCenterSummary.
# TotalProductionCost
Applicable Algorithms: NO
Description:
- Indicates the Total Cost of the Production in the optimized network.
- This Value is equal to the Total Production Cost in the OutputSiteSummary/OutputProductSummary/OutputProduction
# TotalInboundWarehousingCost
Applicable Algorithms: NO
Description:
- Indicates the inbound cost of the warehouse in the optimization model.
- This value is equal to the total inbound warehousing cost between sites of the OutputSiteSummary or the OutputFlow.
# TotalOutboundWarehousingCost
Applicable Algorithms: NO
Description:
- Indicates the outbound cost of the warehouse in the optimization model.
- This value is equal to the total outbound warehousing cost in the OutputSiteSummary, or the total inbound warehousing cost between sites plus the total outbound warehousing cost of customers in the OutputFlow .
# TotalTransportationCost
Applicable Algorithms: NO
Description:
- Indicates the Total transportation Cost between Site in the optimization model.
- This value is equal to the Transportation Cost in the OutputProductSummary or OutputFlow.
# TotalWarehousingCost
Applicable Algorithms: NO
Description:
- Indicates the Total Cost of receiving goods into the warehouse and shipping goods out of the warehouse in the optimization model.
- Total warehousing cost = Total Inbound Warehousing Cost + Total Outbound Warehousing Cost.
# TotalSourcingCost
Applicable Algorithms: NO
Description:
- Indicates the Total Cost of sourcing Product from logistics facilities in the optimization model.
- This Value is equal to the Total Sourcing Cost in the OutputProductSummary or OutputFlow.
# Co2
Applicable Algorithms: NO
Description:
- Indicates the total amount of CO2 generated by the supply chain network due to procurement, production, transportation, storage, etc.
# TotalWorkResourceCost
Applicable Algorithms: NO
Description:
- Indicates the cost of production resource consumption in the optimization model.
# TotalExpressionBasedCost
Applicable Algorithms: NO
Description:
- Indicates the Total Cost generated by the Expression calculation in the optimization model.
- This Value is equal to the Total Cost in the OutputExpressionBasedCost.
# TotalCo2Cost
Applicable Algorithms: NO
Description:
- Indicates the total carbon tax cost incurred by the supply chain network.
- Total carbon tax cost = total Co2 QTY * Unit Carbon Cost
# TotalUnservedDemandQty
Applicable Algorithms: NO
Description:
- Indicates the Total Unserved DemandQty in the optimization model.
# TotalCo2SalesRevenue
Applicable Algorithms: NO
Description:
- Indicates the total carbon trading revenue generated in the supply chain network.
- Total Co2 Sales Revenue = total Carbon Sales QTY *Carbon Offset Sales Price
# GapPercent
Applicable Algorithms: NO
Description:
- Indicates the percentage difference between the optimal cost and the theoretical optimal result of the optimization model.
# TotalCycleStock
Applicable Algorithms: NO
Description:
- Indicates the total amount of Cycle Stock in the inventory optimization model.
# TotalMinInventory
Applicable Algorithms: NO
Description:
- Indicates the total amount of safety stock in the inventory optimization model.
# TotalPreBuildInventory
Applicable Algorithms: NO
Description:
- Indicates the total amount of pre-build inventory in the inventory optimization model.
# TotalInvHoldingCost
Applicable Algorithms: NO
Description:
- Indicates the total Inventory Holding Cost in the optimized network.
- Inventory Holding Cost=Product QtyProduct Value * Inventory Holding CostCoefficient (default 12%)+Warehouse Storage Cost.
# TotalInventoryCarryingCost
Applicable Algorithms: NO
Description:
- Indicates the carrying cost caused by the total Inventory Holding Cost brought by the Product.
- Inventory Holding Cost = Product QtyProduct Value * Inventory Holding CostCoefficient (default 12%).
# TotalInventoryStorageCost
Applicable Algorithms: NO
Description:
- Indicates the cost (rent) of inventory generated when the Product flows through the Site , which is unrelated to the warehousing operations.
# TotalDemandPenalty
Applicable Algorithms: NO
Description:
- Indicates the Penalty Cost generated by unmet demand in the optimization model. The value is obtained by multiplying the unit Penalty Cost defined in the demand table by the unmet demand.
# TotalConstraintsPenalty
Applicable Algorithms: NO
Description:
- Indicates the sum of Penalty Costs triggered by all soft constraints in the network optimization results.
# OutputProductSummary
# Scenario
Applicable Algorithms: NO
Description:
- Indicates the scenario for generating summary data.
# PeriodName
Applicable Algorithms: NO
Description:
- Indicates the current Period.
# ProductName
Applicable Algorithms: NO
Description:
- Indicates the name of the summarized Product.
# TotalProfit
Applicable Algorithms: NO
Description:
- Indicates the Total Profit brought by the Product.
# TotalCost
Applicable Algorithms: NO
Description:
- Indicates the Total Cost brought by the Product.
# TotalRevenue
Applicable Algorithms: NO
Description:
- Indicates the Total Revenue brought by the Product.
# TotalProductionCost
Applicable Algorithms: NO
Description:
- Indicates the Total Production Cost brought by the Product.
# TotalTransportationCost
Applicable Algorithms: NO
Description:
- Indicates the Transportation Cost brought by the Product.
# TotalSourcingCost
Applicable Algorithms: NO
Description:
- Indicates the Total Sourcing Cost brought by the Product.
# TotalInvHoldingCost
Applicable Algorithms: NO
Description:
- Indicates the total Inventory Holding Cost brought by the Product.
- Inventory Holding Cost = Product QtyProduct Value * Inventory Holding CostCoefficient (default 12%)+Warehouse Storage Cost.
# TotalWarehousingCost
Applicable Algorithms: NO
Description:
- Indicates the total inbound and outbound Cost brought by the Product.
# Co2
Applicable Algorithms: NO
Description:
- Indicates the total of Variable Co2 by Product dimension
# OutputSiteSummary
# Scenario
Applicable Algorithms: NO
Description:
- Indicates the scenario for generating summary data.
# SiteName
Applicable Algorithms: NO
Description:
- Indicates the aggregated Site.
# SiteType
Applicable Algorithms: NO
Description:
- Indicates the Type of the summarized Site.
# InitialStatus
Applicable Algorithms: NO
Description:
- Indicates the status of the Site before optimization.
# PeriodName
Applicable Algorithms: NO
Description:
- indicates the current Period.
# OptimizedStatus
Applicable Algorithms: NO
Description:
- Indicates the status of the Site after optimization.
- If the existing facility has a stepped Fixed Operating Cost, it indicates which step the facility is on.
# ThroughputLevel
Applicable Algorithms: NO
Description:
- Indicates the Throughput Level of the Site.
- equal to the outbound volume of the Site – the amount of expired Product discarded by the Site
- Eg At the beginning of the period, NY Warehouse stored 100 tons of A Product, and at the end of the period, only 20 tons were left, so the outbound volume = 80 tons. If it includes 10 tons of expired A Product, then the Throughput Level of NY Warehouse = 80-10 = 70 tons.
# ThroughputBasis
Applicable Algorithms: NO
Description:
- Indicates the unit of Throughput Level.
- Indicates the outbound flow of the facility and the unit of Throughput Level (Quantity/Weight/Volume).
# TotalCost
Applicable Algorithms: NO
Description:
- Total Cost=Total Fixed Startup Cost+Total Fixed Operating Cost+Total Closing Cost+Total Production Cost+Total Sourcing Cost+Transportation Cost+Total Warehousing Cost+Total Warehousing Cost+Total Duty Cost+Total Inventory Holding Cost.
# TotalFixedStartupCost
Applicable Algorithms: NO
Description:
- Indicates the one-time cost of opening and running the Site in the Period.
# TotalFixedOperatingCost
Applicable Algorithms: NO
Description:
- Indicates the total cost of maintaining Site operations during the Period.
# TotalClosingCost
Applicable Algorithms: NO
Description:
- Indicates the total cost of closed site within the Period.
# TotalProductionCost
Applicable Algorithms: NO
Description:
- Indicates the total cost of production for the Site within the Period. It can also be seen in the network production traffic output table.
# TotalSourcingCost
Applicable Algorithms: NO
Description:
- Indicates the total cost of purchasing by the Site within the Period. It can also be seen in the Transportation Flow Output Table.
# TotalInboundTransportationCost
Applicable Algorithms: NO
Description:
- Indicates the total cost of transporting the Product to the Site during the Period.
# TotalOutboundTransportationCost
Applicable Algorithms: NO
Description:
- Indicates the total cost of transporting the Product from the Site during the Period.
# TotalWarehousingCost
Applicable Algorithms: NO
Description:
- Indicates the total cost of the Site's inventory in and out operations within the Period.
# TotalInboundWarehousingCost
Applicable Algorithms: NO
Description:
- Indicates the total Inbound Cost of the Site in the Period.
# TotalOutboundWarehousingCost
Applicable Algorithms: NO
Description:
- Indicates the total outbound cost of the site within the period.
# TotalDutyCost
Applicable Algorithms: NO
Description:
- Indicates the total tax and tariff costs incurred by the Site during the Period.
# Co2
Applicable Algorithms: NO
Description:
- Indicates the total of Fixed Co2 and Variable Co2 by Site dimension
# TotalInvHoldingCost
Applicable Algorithms: NO
Description:
- Indicates the total Inventory Holding Cost of the Site in the Period, excluding In-transit and Work In Progress Inventory.
- Total Inventory Holding Cost = (Total Period Ending Inventory + Cycle Stock+ Safety Stock) \ * (Product Value* Inventory Holding Cost Percentage* Period Days / 365 + Variable Storage Cost)
- If Inv Turns in the inventory strategy is filled in, the Total Inventory Holding Cost = (Total Outgoing Quantity / Turnover Times) * (Product Group Value* Inventory Holding Cost Percentage* Period Days / 365 + Variable Storage Cost)
# ThroughputQuantity
Applicable Algorithms: NO
Description:
- Indicates the throughput Qty of the Site.
- Equals the outbound volume of the Site Group.
# ThroughputWeight
Applicable Algorithms: NO
Description:
- Indicates the throughput weight of the site.
# ThroughputVolume
Applicable Algorithms: NO
Description:
- Indicates the throughput volume of the site.
# StepCapacity
Applicable Algorithms: NO
Description:
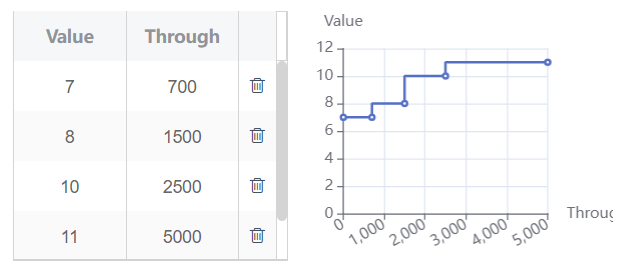
- Indicates the Step Capacity in the Step Capacity setting that the Site has reached. E.g. if the step capacity of Site is as shown in the figure below (Fixed Operating Cost setting in the Site table), the actual output of the Site in Period is 4000, then the Step Capacity is in the (2500,5000) range, and the Step Capacity gets the upper limit Value of 5000.
- Indicates the Step Capacity in the Step Capacity setting that the Site has reached. E.g. if the step capacity of Site is as shown in the figure below (Fixed Operating Cost setting in the Site table), the actual output of the Site in Period is 4000, then the Step Capacity is in the (2500,5000) range, and the Step Capacity gets the upper limit Value of 5000.
# StepRemainingCapacity
Applicable Algorithms: NO
Description:
- Indicates the remaining amount of the Step Capacity of the Site. E.g. if the Step Capacity of a Site is as shown in the figure below, and the actual output of the Site in a Period is 4000, then the Step Capacity is in the (2500,5000) range, and the remaining Step Capacity = 5000-4000 = 1000! Chart description has been automatically generated
# StepCapacityUtilization
Applicable Algorithms: NO
Description:
- Indicates the utilization rate of the Step Capacity of the Site. E.g. if the step capacity of a Site is as shown in the figure below, and the actual output of the Site in a Period is 4000, then the Step Capacity is in the (2500,5000) range, and the Step Capacity utilization rate = (4000-2500)/(5000-2500) = 60%
- Indicates the utilization rate of the Step Capacity of the Site. E.g. if the step capacity of a Site is as shown in the figure below, and the actual output of the Site in a Period is 4000, then the Step Capacity is in the (2500,5000) range, and the Step Capacity utilization rate = (4000-2500)/(5000-2500) = 60%
# TotalCapacity
Applicable Algorithms: NO
Description:
- Indicates the upper limit of the Total Capacity of the Site.
# TotalRemainingCapacity
Applicable Algorithms: NO
Description:
- Indicates the remaining amount of the site's total capacity.
# TotalCapacityUtilization
Applicable Algorithms: NO
Description:
- Indicates the utilization rate of the Total Capacity of the Site. E.g. if the Total Capacity of a Site is 5000, and the actual output of the Site in a Period is 4000, then the Step Capacity utilization rate = 4000/5000 = 80%
# TotalRevenue
Applicable Algorithms: NO
Description:
- Indicates the revenue brought by the Site.
# TotalDemand
Applicable Algorithms: NO
Description:
- Indicates the Total Demand satisfied by the Site.
# OutputWorkCenterSummary
# Scenario
Applicable Algorithms: NO
Description:
- Indicates the scenario for generating summary data.
# WorkCenter
Applicable Algorithms: NO
Description:
- Indicates the Work Center to be summarized.
# WorkCenterType
Applicable Algorithms: NO
Description:
- Indicates the Type of Work Center to be summarized.
# SiteName
Applicable Algorithms: NO
Description:
- Indicates the Site where the summarized Work Center is located.
# PeriodName
Applicable Algorithms: NO
Description:
- indicates the current Period.
# InitialStatus
Applicable Algorithms: NO
Description:
- Indicates the Status of Work Center before optimization.
# OptimizedStatus
Applicable Algorithms: NO
Description:
- Indicates the status of the Work Center after optimization.
# ThroughputBasis
Applicable Algorithms: NO
Description:
- Indicates the unit of Throughput Level.
# ThroughputLevel
Applicable Algorithms: NO
Description:
- Indicates the Throughput Level of the Work Center.
# TotalCost
Applicable Algorithms: NO
Description:
- Total Cost=Total Fixed Startup Cost+Total Fixed Operating Cost+Total Closing Cost+Total Production Cost.
# TotalFixedStartupCost
Applicable Algorithms: NO
Description:
- Indicates the one-time startup cost of Work Center in the Period.
- Obtained from the Fixed Startup Cost entered in the Work Center table.
# TotalFixedOperatingCost
Applicable Algorithms: NO
Description:
- Indicates the total cost of maintaining the Work Center operation during the Period.
# TotalClosingCost
Applicable Algorithms: NO
Description:
- Indicates the total cost of the closed Work Center within the Period.
- Obtained from the Fixed Closing Cost entered in the Work Center table.
# TotalProductionCost
Applicable Algorithms: NO
Description:
- Indicates the total production cost of Work Center in Period. It can also be seen in the OutputProduction.
# ThroughputQuantity
Applicable Algorithms: NO
Description:
- Indicates the throughput Qty of the Work Center.
- equal to the production QTY of the Work Center.
# ThroughputWeight
Applicable Algorithms: NO
Description:
- Indicates the throughput weight of the Work Center.
# ThroughputVolume
Applicable Algorithms: NO
Description:
- Indicates the throughput volume of the Work Center.
# StepCapacity
Applicable Algorithms: NO
Description:
- Indicates the Step Capacity in the Step Capacity setting reached by the Work Center.
- Obtained based on the Fixed Operating Cost entered in the Workcenters (or Workcenter MultiPeriod), refer to Site Summary-StepCapacity.
# StepRemainingCapacity
Applicable Algorithms: NO
Description:
- Indicates the remaining amount of the Step Capacity where the Work Center is located.
- Obtained based on the Fixed Operating Cost entered in the Workcenters (or Workcenter MultiPeriod), refer to Site Summary - StepCapacity Remaining.
# StepCapacityUtilization
Applicable Algorithms: NO
Description:
- Indicates the utilization of the Step Capacity where the Work Center is located.
- Obtained based on the Fixed Operating Cost entered in the Workcenter (or Workcenter Multiperiod), refer to Site Summary - Step Capacity Utilization.
# Co2
Applicable Algorithms: NO
Description:
- Indicates the total of Fixed Co2 and Variable Co2 by Work Center
# TotalCapacity
Applicable Algorithms: NO
Description:
- Indicates the Total Capacity of the Work Center.
# TotalRemainingCapacity
Applicable Algorithms: NO
Description:
- Indicates the remaining amount of the Total Capacity of the Work Center.
# TotalCapacityUtilization
Applicable Algorithms: NO
Description:
- Indicates the utilization rate of the Total Capacity of the Work Center.
# OutputExpressionSummary
# Scenario
Applicable Algorithms: NO
Description:
- Indicates the Scenario where the Expression summarizes the data.
# Expression
Applicable Algorithms: NO
Description:
- Indicates the ExpressionName corresponding to the Expression Constraint.
# GroupName
Applicable Algorithms: NO
Description:
- A unique identification column for the Expression, which contains elements of the Expression, such as Period, SourceSite, DestinationSite, Product, and Transportation Mode.
# ExpressionValue
Applicable Algorithms: NO
Description:
- Indicates the Constraint value referenced by the Expression Constraint.
# ExpressionValueBasis
Applicable Algorithms: NO
Description:
- Includes Quantity, Weight, and Volume, indicating the units corresponding to the Expression Constraint.
# OutputExpressionBasedCost
# Scenario
Applicable Algorithms: NO
Description:
- Indicates the Scenario where the Expression cost summary data is located.
# Name
Applicable Algorithms: NO
Description:
- Indicates the name of the Expression cost.
# Expression
Applicable Algorithms: NO
Description:
- Indicates the ExpressionName corresponding to the Expression cost.
# GroupName
Applicable Algorithms: NO
Description:
- When calculating the Expression cost, the effective Group Name is composed of the PeriodName, Site Name, Product Name, etc. of the form where the referenced Expression is located and the "|" connector.
# ExpressionValue
Applicable Algorithms: NO
Description:
- Indicates the value of the Constraint referenced by the Expression cost.
# FixedCost
Applicable Algorithms: NO
Description:
- Indicates the Fixed Cost generated by the Expression cost.
# VariableCost
Applicable Algorithms: NO
Description:
- Indicates the Variable Cost generated by the Expression cost.
# TotalCost
Applicable Algorithms: NO
Description:
- Indicates the Total Cost (including variable and fixed costs) generated by the Expression cost.
# OutputGreenFieldSummary
# Scenario
Applicable Algorithms: GF
Description:
- Indicates the Scenario where the GreenFiled model summary data is located.
# ModelCompleteTime
Applicable Algorithms: GF
Description:
- Indicates the Complete time of the GreenField model.
# SolveTime
Applicable Algorithms: GF
Description:
- Indicates the Solve Time of the GreenField model.
# TotalCustomers
Applicable Algorithms: GF
Description:
- Indicates the total Qty of the Customer in the GreenField model.
# TotalExistingSite
Applicable Algorithms: GF
Description:
- Indicates the number of existing sites used in the GreenField model.
# TotalGreenfieldSite
Applicable Algorithms: GF
Description:
- Indicates the number of new sites used in the GreenField model.
# TotalFlow
Applicable Algorithms: GF
Description:
- Indicates the Total FlowQty of the Site serving the Customer in the GreenField model.
# TotalFlowDistance
Applicable Algorithms: GF
Description:
- Indicates the total number of flow QTY * service distance in the GreenField model.
# WeightedServiceDistance
Applicable Algorithms: GF
Description:
- Indicates the weighted average service distance based on demand.
# OutputGreenFieldSiteSummary
# Scenario
Applicable Algorithms: GF
Description:
- Indicates the scenario where the OutputGreenFieldSiteSummary is located.
# GreenfieldSite
Applicable Algorithms: GF
Description:
- Indicates the SiteName in the GreenField network. The new Site is named GreenField_CityName. If there is an existing Site, the existing SiteName is displayed.
# GreenfieldLatitude
Applicable Algorithms: GF
Description:
- Indicates the Latitude of the Site in the GreenField network to ensure the minimum weighted service distance (Flow\Service Distance).
# GreenfieldLongitude
Applicable Algorithms: GF
Description:
- Indicates the Longitude of the Site in the GreenField network to ensure the minimum weighted service distance (Flow\Service Distance).
# Province
Applicable Algorithms: GF
Description:
- Indicates the Province where the Site is located in the GreenField network.
# County
Applicable Algorithms: GF
Description:
- Indicates the County where the Site is located in the site selection network.
# City
Applicable Algorithms: GF
Description:
- Indicates the city where the Site is located in the GreenField network.
# ThroughputLevel
Applicable Algorithms: GF
Description:
- Indicates the Throughput Level of the Site in the GreenField network.
# WeightedServiceDistance
Applicable Algorithms: GF
Description:
- Indicates the average service distance based on Product weight of GreenField.
# OutputGreenFieldServiceSummary
# Scenario
Applicable Algorithms: GF
Description:
- Indicates the Scenario where the GreenField Service summary data is located.
# CustomerName
Applicable Algorithms: GF
Description:
- Indicates the CustomertName in this Scenario in the GreenField model.
# TotalFlow
Applicable Algorithms: GF
Description:
- Indicates the Total FlowQty of the Customer in the GreenField model.
# FlowWithinDistance
Applicable Algorithms: GF
Description:
- Indicates the Total FlowQty serving the Customer within the limited Distance.
# RequiredServiceDistance
Applicable Algorithms: GF
Description:
- Indicates the required service Distance in the GreenField model.
# WeightedServiceDistance
Applicable Algorithms: GF
Description:
- Indicates the weighted average service distance based on demand.
# PercentageRequirement
Applicable Algorithms: GF
Description:
- Indicates the Percentage that meets the service Distance requirement.
# PercentageAchieved
Applicable Algorithms: GF
Description:
- Indicates the percentage of service distance in Total Demand that meets the service distance requirement.
# OutputInventorySummary
# Scenario
Applicable Algorithms: SSO
Description:
- Indicates the scenario for generating summary data.
# ModelCompleteTime
Applicable Algorithms: SSO
Description:
- Indicates the Complete Time of the safety stock optimization model.
# OptimizationType
Applicable Algorithms: SSO
Description:
- Indicates the optimization type of the model, minimize safety stock cost.
# EchelonMode
Applicable Algorithms: SSO
Description:
- Indicates whether the safety stock optimization is based on a single echelon or multiple echelons.
# DemandPropagationType
Applicable Algorithms: SSO
Description:
- Indicates the preparation time when Site receiving the Order. For Site facing Customers, this parameter defaults to 0, which means that once the Customer places an order, the Site Group must immediately have enough inventory to meet the Order.
# TotalWipCost
Applicable Algorithms: SSO
Description:
- Total Work In Progress Stock Cost = Total Work In Progress Stock *Product ValueInventory Holding Cost Percentage * Work In Progress Days/365+Total Work In Progress Stock -Variable Storage Cost.
# TotalSafetyStockCost
Applicable Algorithms: SSO
Description:
- Total Safety Stock Cost = Total Safety Stock * Product Value * Inventory Holding Cost Percentage * Period Days / 365 + Total Safety Stock * Variable Storage Cost.
# TotalCycleStockCost
Applicable Algorithms: SSO
Description:
- Total Cycle Stock Cost = Total Cycle Stock * Product Value * Inventory Holding Cost Percentage * Period Days / 365 + Total Cycle Stock * Variable Storage Cost.
# TotalInTransitInventoryCost
Applicable Algorithms: SSO
Description:
- Total In Transit Inventory Cost = Total In Transit InvProduct Value * Inventory Holding Cost Percentage\ * Period Days/365.
# TotalInventoryCost
Applicable Algorithms: SSO
Description:
- Total Inventory Cost=Total InventoryProduct Value * Inventory Holding Cost Percentage * Days/365+Total Inventory * Variable Storage Cost.
# OutputInventoryPolicySummary
# Scenario
Applicable Algorithms: SSO
Description:
- Indicates the scenario for which summary data is generated.
# SiteName
Applicable Algorithms: SSO
Description:
- Indicates the site for safety stock optimization.
# ProductName
Applicable Algorithms: SSO
Description:
- Indicates Product Name for safety stock optimization.
# StartDate
Applicable Algorithms: SSO
Description:
- Indicates the Period Start Date Time for the safety stock computation.
# EndDate
Applicable Algorithms: SSO
Description:
- Indicates the Period End Date Time for the safety stock computation.
# ServiceType
Applicable Algorithms: SSO
Description:
- Indicates the Type of Service Level used to calculate the output result, which is usually the same as the setting of Safety Stock Optimization.
- Service LevelType includes the following three types: | Service LevelType | Service Level Definition | Service LevelDescription | | ------------ | -------------------- | ------------------------------------ | | Type1: By Probability | Probability of not running out of stock during the risk period | Event driven, related to whether there is a stock out of stock during the risk period | | Type2: By Qty | Percentage of demand completed on time | Based on Qty, consider the proportion of demand completed on time |
- Note that Type2Service LevelType requires batch size for calculation. Batch size = max(Minimum Order Quantity, Days Between Replenishment-Daily Average Demand, EOQ). If this information is not available, Safety Stock Optimization will use Type1 Service LevelType for calculation.
# TargetServiceLevel
Applicable Algorithms: SSO
Description:
- Target Service Level when performing safety stock optimization calculations.
# RecommendPolicy
Applicable Algorithms: SSO
Description:
- Indicates the inventory control strategy that is tailored to the needs of the Product in order to maintain service requirements.
# Parameter1
Applicable Algorithms: SSO
Description:
- This parameter depends on the Recommend Policy Type. For example, when the Recommend Policy is (R, Q), Parameter 1 represents the order point (R). When the inventory level drops to R, replenishment is triggered.
# Parameter2
Applicable Algorithms: SSO
Description:
- This parameter depends on the Recommend Policy Type. For example, when the Recommend Policy is (R, Q), Parameter 2 represents a fixed order quantity (Q). When the inventory level drops to R, replenishment is triggered, and the replenishment quantity is Q.
# SafetyStock
Applicable Algorithms: SSO
Description:
- The amount of inventory for unknown demand or changes in delivery times.
# SafetyStockCost
Applicable Algorithms: SSO
Description:
- The cost of inventory for unknown demand or changes in delivery times.
# TotalInventory
Applicable Algorithms: SSO
Description:
- Total Inventory = Safety Stock + Cycle Stock + In Transit Stock + Work In Progress Stock
# TotalInventoryValue
Applicable Algorithms: SSO
Description:
- Total InventoryValue=Total Inventory\Product Value
# TotalInventoryCost
Applicable Algorithms: SSO
Description:
- Total Inventory Cost=Total InventoryProduct Value * Inventory Holding Cost Percentage * Period days/365+Total Inventory * Variable Storage Cost
# ExpectedType1Service
Applicable Algorithms: SSO
Description:
- The Service Level calculated based on Service LevelType1.
# ExpectedType2Service
Applicable Algorithms: SSO
Description:
- The Service Level calculated based on Service LevelType2.
# Coverage
Applicable Algorithms: SSO
Description:
- Indicates the number of days that the Site's safety stock can cover. Coverage = Immediate Lead Time + Service Time of the nearest upstream Site - Service Time of the downstream Site . When a Site has multiple Sources or Destinations, this parameter will calculated based on each Source-Destination Flow、
# ImmediateLeadTime
Applicable Algorithms: SSO
Description:
- Indicates the shortest time of replenishment from the nearest upstream site group, assuming that the upstream site group has sufficient inventory.
# MaxLeadTime
Applicable Algorithms: SSO
Description:
- Indicates the lead time from the farthest upstream site to this site.
# DailyDemandMean
Applicable Algorithms: SSO
Description:
- Indicates the average daily demand of Site.
# DailyDemandStd
Applicable Algorithms: SSO
Description:
- Indicates the Standard Deviation of the daily average demand of Site.
# LeadTimeDemandMean
Applicable Algorithms: SSO
Description:
- Indicates the average demand of lead time.
- Lead Time Demand Mean=Average Demand\Coverage
# LeadTimeDemandStd
Applicable Algorithms: SSO
Description:
- Indicates the Standard Deviation of the demand in the lead time.
- Lead Time Demand Mean=√(Coverage\ * (Demand Standard Deviation)2(Average Demand)2 * (Lead Time Standard Deviation)2)
# WipStock
Applicable Algorithms: SSO
Description:
- Indicates the inventory of semi-finished products and Raw Materials that have already started production.
- Work In Progress stock quantity = Fixed Order Time\Average Demand/2
# WipStockCost
Applicable Algorithms: SSO
Description:
- Indicates the holding cost of the inventory of semi-finished products and Raw Materials that have already started the production process.
# CycleStock
Applicable Algorithms: SSO
Description:
- Inventory reserved to meet daily demand, excluding Safety Stock.
- Cycle Stock= Batch Size/2 = max(Minimum Order Quantity, EOQ, Days Between Replenishment\Daily Average Demand)/2
# CycleStockCost
Applicable Algorithms: SSO
Description:
- The holding cost of inventory held to meet daily demand, excluding the cost of Safety Stock.
# InTransitInventory
Applicable Algorithms: SSO
Description:
- Indicates In Transit Product Qty.
# InTransitInvCost
Applicable Algorithms: SSO
Description:
- Indicates the holding cost of the Product during transportation
# AvgBackorders
Applicable Algorithms: SSO
Description:
- Indicates the Avg Backorders of Site.
# AvgInventory
Applicable Algorithms: SSO
Description:
- Indicates the average Total Inventory of Site.
# ReplishmentQuantity
Applicable Algorithms: SSO
Description:
- Indicates the Average Replishment Quantity of Site.
# OutputDemandProfile
# Scenario
Applicable Algorithms: SSO
Description:
- Indicates the scenario for generating summary data.
# SiteName
Applicable Algorithms: SSO
Description:
- Indicates the site for safety stock optimization.
# SiteType
Applicable Algorithms: SSO
Description:
- Indicates the Type of the summarized Site.
# ProductName
Applicable Algorithms: SSO
Description:
- indicates the aggregated Product Name.
# PeriodLength
Applicable Algorithms: SSO
Description:
- Indicates the total number of days in the Period.
# DemandMean
Applicable Algorithms: SSO
Description:
- Indicates the average value of the demand for this Product in this Site
- Average value of demand = Σ (demand1 Qty + demand2 Qty + ...) ÷ model period days
# DemandStd
Applicable Algorithms: SSO
Description:
- Indicates the Standard Deviation of the demand of the Product in the Site
- Standard Deviation of demand = [((Demand1 Qty-Demand1 Mean)²+(Demand2 Qty-Demand2 Mean)²+……)÷Square root of model Period days]
# NzDemandMean
Applicable Algorithms: SSO
Description:
- Indicates the average value of non-zero demand for the Product in the Site
- Average value of demand = Σ ( demand1 Qty + demand2 quantity + ...) ÷ number of days with non-zero demand
# NzDemandStd
Applicable Algorithms: SSO
Description:
- Indicates the Standard Deviation of the demand for this Product Group this Site
- Standard Deviation of non-zero demand = [((Name1's Qty - non-zero Demand Mean)² + (Name2's Qty - non-zero Demand Mean)² + ...) ÷ the square root of the number of days with non-zero demand]
# MeanDemandInterval
Applicable Algorithms: SSO
Description:
- Indicates the average demand interval of the Product in the Site.
# MaxNzDemand
Applicable Algorithms: SSO
Description:
- Indicates the Product Group has the Max Nz Demand in this Site.
# DemandCount
Applicable Algorithms: SSO
Description:
- Indicates the number of days that the Product has demanded the Site within the Period.
# TotalQuantity
Applicable Algorithms: SSO
Description:
- Indicates the Total Demand of this Product in this Site.
# TotolVolume
Applicable Algorithms: SSO
Description:
- Indicates the Total Demand Volume of the Product in the Site.
# TotolWeight
Applicable Algorithms: SSO
Description:
- Indicates the Total Demand Weight of the Product in the Site.
# DemandClass
Applicable Algorithms: SSO
Description:
- Indicates the Demand Class of this Product in this Site.
# NzCv2
Applicable Algorithms: SSO
Description:
- Indicates the volatility (CV2) of the non-zero demand for the Product in the Site .
# OutputSimProductionSummary
# Scenario
Applicable Algorithms: SIM
Description:
- Indicates ScenarioName.
# SiteName
Applicable Algorithms: SIM
Description:
- Indicates SiteName (with production function).
- The SiteName corresponds to the non-customer SiteType data in Sites table.
# ProductName
Applicable Algorithms: SIM
Description:
- Indicates ProductName.
- The ProductName corresponds to the Products table.
# ProductionLots
Applicable Algorithms: SIM
Description:
- Indicates the total number of production batches within the simulation period.
# ProductionQuantity
Applicable Algorithms: SIM
Description:
- Indicates the total production quantity within the simulation period.
# ProductionVolume
Applicable Algorithms: SIM
Description:
- Indicates the total production volume within the simulation period.
# ProductionWeight
Applicable Algorithms: SIM
Description:
- Indicates the total production weight within the simulation Period.
# ProductionCost
Applicable Algorithms: SIM
Description:
- Indicates the Total Production Cost within the simulation period.
# OutputSimSiteProductSummary
# Scenario
Applicable Algorithms: SIM
Description:
- Indicates ScenarioName.
# SiteName
Applicable Algorithms: SIM
Description:
- Indicates SiteName.
- The SiteName corresponds to the non-customer SiteType data in Sites table.
# ProductName
Applicable Algorithms: SIM
Description:
- Indicates ProductName.
- The ProductName corresponds to the Products table.
# InitialInventory
Applicable Algorithms: SIM
Description:
- Indicates the on-hand product inventory at the beginning of the simulation period.
# EndingInventory
Applicable Algorithms: SIM
Description:
- Indicates the remaining Product inventory at the end of the simulation period.
# AverageOnHand
Applicable Algorithms: SIM
Description:
- Indicates the average quantity of Product that can be used within the Site.
# MaxOnHand
Applicable Algorithms: SIM
Description:
- Indicates the maximum quantity of Product that can be used within the Site.
# MinOnHand
Applicable Algorithms: SIM
Description:
- Indicates the minimum quantity of Product that can be used within the Site.
# AverageOrdered
Applicable Algorithms: SIM
Description:
- Indicates the average quantity of the Product ordered by the Site from upstream suppliers.
# MaxOrdered
Applicable Algorithms: SIM
Description:
- Indicates the maximum quantity of the Product ordered by the Site from upstream suppliers.
# MinOrdered
Applicable Algorithms: SIM
Description:
- Indicates the minimum quantity of the Product ordered by the Site from upstream suppliers.
# AverageBooked
Applicable Algorithms: SIM
Description:
- Indicates the average quantity of the Product received by the Site from downstream purchases.
# MaxBooked
Applicable Algorithms: SIM
Description:
- Indicates the maximum quantity of the Product received by the Site from downstream purchases.
# MinBooked
Applicable Algorithms: SIM
Description:
- Indicates the minimum quantity of the Product received by the Site from downstream purchases.
# AverageInTransit
Applicable Algorithms: SIM
Description:
- Indicates the average quantity of Products that have been shipped from upstream factories/warehouses to the Site but are still in transit.
# MaxInTransit
Applicable Algorithms: SIM
Description:
- Indicates the maximum quantity of Products that have been shipped from upstream factories/warehouses to the Site but are still in transit.
# MinInTransit
Applicable Algorithms: SIM
Description:
- Indicates the minimum quantity of Products that have been shipped from upstream factories/warehouses to the Site but are still in transit.
# AverageWorkInProcess
Applicable Algorithms: SIM
Description:
- Indicates the average quantity of the Products for which the production orders have been issued to the factory and the factory has started production but has not yet completed it.
- Applicable to the factory Site for which the production strategy has been configured.
# MaxWorkInProcess
Applicable Algorithms: SIM
Description:
- Indicates the maximum quantity of the Products for which the production orders have been issued to the factory and the factory has started production but has not yet completed it.
- Applicable to the factory Site for which the production strategy has been configured.
# MinWorkInProcess
Applicable Algorithms: SIM
Description:
- Indicates the minimum quantity of the Products for which the production orders have been issued to the factory and the factory has started production but has not yet completed it.
- Applicable to the factory Site for which the production strategy has been configured.
# OrderlineFillRate
Applicable Algorithms: SIM
Description:
- Orderline Fill Rate within the Max Service Time.
# QuantityFillRate
Applicable Algorithms: SIM
Description:
- Product Qty issued by the Site within the Max Service Time after receiving the Name / Total Qty of the Products in the sites of simulation Period
# TotalQuantity
Applicable Algorithms: SIM
Description:
- Total order quantity for the product at the site.
# TotalOrderline
Applicable Algorithms: SIM
Description:
- Total number of Order Lines.
# LostOrderline
Applicable Algorithms: SIM
Description:
- The number of Order Lines that are still unsatisfied after the simulation ends.
# TotalExpiredQuantity
Applicable Algorithms: SIM
Description:
- Indicates the abandoned Qty of the Product in inventory due to exceeding the Shelf Life.
# ServicedOrderlines
Applicable Algorithms: SIM
Description:
- The number of Order Lines that can be satisfied within the Max Service Time.
# OutputSimSiteSummary
# Scenario
Applicable Algorithms: SIM
Description:
- Indicates ScenarioName.
# SiteName
Applicable Algorithms: SIM
Description:
- Indicates SiteName.
- The SiteName corresponds to the non-customer SiteType data in Sites table.
# InboundQuantity
Applicable Algorithms: SIM
Description:
- Indicates the quantity of products for which the Site has received the goods within the simulation period.
# InboundVolume
Applicable Algorithms: SIM
Description:
- Indicates the volume of products for which the Site has received the goods within the simulation period.
# InboundWeight
Applicable Algorithms: SIM
Description:
- Indicates the weight of products for which the Site has received the goods within the simulation period.
# OutboundQuantity
Applicable Algorithms: SIM
Description:
- Indicates the quantity of products that have been shipped by the Site within the simulation period.
# OutboundVolume
Applicable Algorithms: SIM
Description:
- Indicates the volume of products that have been shipped by the Site within the simulation period.
# OutboundWeight
Applicable Algorithms: SIM
Description:
- Indicates the weight of products that have been shipped by the Site within the simulation period.
# AverageInventoryValue
Applicable Algorithms: SIM
Description:
- Indicates the average on-hand inventory value during the simulation period.
- The Average Inventory Value is equal to Average Inventory Quantity multiplied by the unit Value of the Product.
# MaxInventoryValue
Applicable Algorithms: SIM
Description:
- Indicates the maximum on-hand inventory value of the entire network with Site as the dimension within the simulation period.
# AverageInventoryQuantity
Applicable Algorithms: SIM
Description:
- Indicates the average on-hand inventory quantity during the simulation period.
# MaxInventoryQuantity
Applicable Algorithms: SIM
Description:
- Indicates the maximum on-hand inventory quantity of the entire network with Site as the dimension within the simulation period.
# AverageInventoryVolume
Applicable Algorithms: SIM
Description:
- Indicates the average on-hand inventory volume during the simulation period.
- The Average Inventory Volume is equal to Average Inventory Quantity multiplied by the unit Volume of the Product.
# MaxInventoryVolume
Applicable Algorithms: SIM
Description:
- Indicates the maximum on-hand inventory volume of the entire network with Site as the dimension within the simulation period.
# AverageInventoryWeight
Applicable Algorithms: SIM
Description:
- Indicates the average on-hand inventory weight during the simulation period.
- The Average Inventory Weight is equal to Average Inventory Quantity multiplied by the unit Weight of the Product.
# MaxInventoryWeight
Applicable Algorithms: SIM
Description:
- Indicates the maximum on-hand inventory weight of the entire network with Site as the dimension within the simulation period.
# OrderlineFillRate
Applicable Algorithms: SIM
Description:
- Orderline Fill Rate within the Max Service Time.
# QuantityFillRate
Applicable Algorithms: SIM
Description:
- Indicates the quantity of products shipped within the Max Service Time divided by the total demand.
# InventoryTurns
Applicable Algorithms: SIM
Description:
- Statistics are calculated by dividing shipment quantity during the simulation period by average on-hand inventory.
# TotalOrderline
Applicable Algorithms: SIM
Description:
- Total number of Order Lines.
# ServicedOrderlines
Applicable Algorithms: SIM
Description:
- The number of Order Lines that can be satisfied within the Max Service Time.
# LostOrderline
Applicable Algorithms: SIM
Description:
- The number of Order Lines that are still unsatisfied after the simulation ends.
# TotalExpiredQuantity
Applicable Algorithms: SIM
Description:
- Indicates the total expired Qty of the network within the simulation period.
- The products are expired because their storage period in the warehouse exceeds the Product Shelf Life.
# OutputSimProductSummary
# Scenario
Applicable Algorithms: SIM
Description:
- Indicates ScenarioName.
# ProductName
Applicable Algorithms: SIM
Description:
- Indicates the simulated ProductName.
# TotalRevenue
Applicable Algorithms: SIM
Description:
- Indicates the total revenue of Product sales.
- Total Revenue is equal to the quantity of shipments completed to end customers multiplied by the unit Price of the product.
# LostRevenue
Applicable Algorithms: SIM
Description:
- Indicates the revenue lost due to products being cancelled by customers due to waiting or stockouts.
# TotalQuantity
Applicable Algorithms: SIM
Description:
- Indicates the sum of product quantities for orders that are completed within the max time.
- All order lines within the order are in a completed status.
# LostQuantity
Applicable Algorithms: SIM
Description:
- Indicates the sum of product quantities for orders that are not completed within the max time.
- If any order line is not completed within the Max Service Time, the order is marked as unsatisfied.
# TotalOrderline
Applicable Algorithms: SIM
Description:
- Total number of Order Lines.
# ServicedOrderlines
Applicable Algorithms: SIM
Description:
- The number of Order Lines that can be satisfied within the Max Service Time.
# LostOrderline
Applicable Algorithms: SIM
Description:
- The number of Order Lines that are still unsatisfied after the simulation ends.
# OrderlineFillRate
Applicable Algorithms: SIM
Description:
- Orderline Fill Rate within the Max Service Time.
# QuantityFillRate
Applicable Algorithms: SIM
Description:
- Indicates the ratio of product quantity shipped within the Max Service Time to the total demand quantity.
# AverageInventoryQuantity
Applicable Algorithms: SIM
Description:
- Indicates the average on-hand inventory quantity during the simulation period.
# AverageInventoryValue
Applicable Algorithms: SIM
Description:
- Indicates the average on-hand inventory value during the simulation period.
- The Average Inventory Value is equal to Average Inventory Quantity multiplied by the unit Value of the Product.
# MaxInventoryQuantity
Applicable Algorithms: SIM
Description:
- Indicates the maximum on-hand inventory quantity of the entire network with Product as the dimension.
# MaxInventoryValue
Applicable Algorithms: SIM
Description:
- Indicates the maximum on-hand inventory value of the entire network with Product as the dimension.
- Inventory Value is equal to the Inventory quantity multiplied by the unit Value of Product.
# TotalExpiredQuantity
Applicable Algorithms: SIM
Description:
- Indicates the abandoned Qty of the Product in inventory due to exceeding the Shelf Life.
# OutputSimCustomerProductSummary
# Scenario
Applicable Algorithms: SIM
Description:
- Indicates ScenarioName.
# CustomerName
Applicable Algorithms: SIM
Description:
- Indicates SiteName.
- The CustomerName corresponds to the Customer SiteType in the Sites table.
# ProductName
Applicable Algorithms: SIM
Description:
- Indicates ProductName.
- The ProductName corresponds to the Products table.
# AverageOrderCycleTime
Applicable Algorithms: SIM
Description:
- Indicates the average duration from order placement to completion for each order line, across customer and product dimensions.
- The unit is day.
# MaxOrderCycleTime
Applicable Algorithms: SIM
Description:
- Indicates the maximum duration from order placement to completion for each order line in the simulation period.
# TotalRevenue
Applicable Algorithms: SIM
Description:
- Indicates the Total Revenue generated from terminal sales within the simulation period.
# LostRevenue
Applicable Algorithms: SIM
Description:
- Indicates the revenue lost due to products being cancelled by customers due to waiting or stockouts.
# TotalQuantity
Applicable Algorithms: SIM
Description:
- Indicates the sum of product quantities for orders that are completed within the max time.
- If any order line is not completed within the Max Service Time, the order is marked as unsatisfied.
# LostQuantity
Applicable Algorithms: SIM
Description:
- Indicates the sum of product quantities for orders that are not completed within the max time.
- If any order line is not completed within the Max Service Time, the order is marked as unsatisfied.
# TotalOrderline
Applicable Algorithms: SIM
Description:
- Total number of Order Lines.
# ServicedOrderlines
Applicable Algorithms: SIM
Description:
- The number of Order Lines that can be satisfied within the Max Service Time.
# LostOrderline
Applicable Algorithms: SIM
Description:
- The number of Order Lines that are still unsatisfied after the simulation ends.
# OrderlineFillRate
Applicable Algorithms: SIM
Description:
- Orderline Fill Rate within the Max Service Time.
# QuantityFillRate
Applicable Algorithms: SIM
Description:
- Indicates the ratio of product quantity shipped within the Max Service Time to the total demand quantity.
# OutputSimCustomerSummary
# Scenario
Applicable Algorithms: SIM
Description:
- Indicates ScenarioName.
# CustomerName
Applicable Algorithms: SIM
Description:
- indicates SiteName.
- SiteName corresponds to Site Group of SiteType in Site Group table.
- The SiteName corresponds to the SiteType in the Sites table that is designated as Customer.
# AverageOrderCycleTime
Applicable Algorithms: SIM
Description:
- Indicates the average duration from order placement to completion for each order, on a customer dimension.
- The unit is day.
# MaxOrderCycleTime
Applicable Algorithms: SIM
Description:
- Indicates the maximum duration from order placement to completion for each order line in the simulation period.
# SingleSourceRate
Applicable Algorithms: SIM
Description:
- Dimensioned by Customer, count the proportion of order quantity from a single sourcing source to the total order quantity.
- The definition of a single sourcing source is that all Product rows under one OrderID are purchased from the same Site.
# TotalRevenue
Applicable Algorithms: SIM
Description:
- Indicates the Total Revenue generated from terminal sales within the simulation period.
# LostRevenue
Applicable Algorithms: SIM
Description:
- Indicates the revenue lost due to products being cancelled by customers due to waiting or stockouts.
# TotalQuantity
Applicable Algorithms: SIM
Description:
- Indicates the sum of product quantities for orders that are completed within the max time.
- If any order line is not completed within the Max Service Time, the order is marked as unsatisfied.
# LostQuantity
Applicable Algorithms: SIM
Description:
- Indicates the sum of product quantities for orders that are not completed within the max time.
- If any order line is not completed within the Max Service Time, the order is marked as unsatisfied.
# TotalOrderline
Applicable Algorithms: SIM
Description:
- Total number of Order Lines.
# ServicedOrderlines
Applicable Algorithms: SIM
Description:
- The number of Order Lines that can be satisfied within the Max Service Time.
# LostOrderline
Applicable Algorithms: SIM
Description:
- The number of Order Lines that are still unsatisfied after the simulation ends.
# OrderFillRate
Applicable Algorithms: SIM
Description:
- Indicates the ratio of order line shipped within the Max Service Time to the total number of order line.
# OrderlineFillRate
Applicable Algorithms: SIM
Description:
- Orderline Fill Rate within the Max Service Time.
# QuantityFillRate
Applicable Algorithms: SIM
Description:
- Indicates the ratio of product quantity shipped within the Max Service Time to the total demand quantity.
# OutputSimSummary
# Scenario
Applicable Algorithms: SIM
Description:
- Indicates ScenarioName.
# PeriodLength
Applicable Algorithms: SIM
Description:
- The total number of days from the start to the end of the simulation Period.
# TotalRevenue
Applicable Algorithms: SIM
Description:
- Indicates the Total Revenue generated from terminal sales within the simulation period.
# TotalProfit
Applicable Algorithms: SIM
Description:
- Indicates the Total Profit of the Product within the simulation Period.
- Total Profit is equal to Total Revenue minus Total Cost.
# TotalCost
Applicable Algorithms: SIM
Description:
- Indicates the Total Cost of the network within the simulation Period.
# TotalInboundWarehousingCost
Applicable Algorithms: SIM
Description:
- Indicates the Total Inbound Warehousing Cost for unloading and loading within the simulation period.
# TotalOutboundWarehousingCost
Applicable Algorithms: SIM
Description:
- Indicates the Total Outbound Warehousing Cost for sorting, production, and loading within the simulation period.
# TotalProductionCost
Applicable Algorithms: SIM
Description:
- Indicates the Total Production Cost of human resources, water and electricity, etc. invested in the simulation period.
# TotalTransportationCost
Applicable Algorithms: SIM
Description:
- Indicates the Total Transportation Cost of the network within the simulation Period.
# TotalInventoryCost
Applicable Algorithms: SIM
Description:
- Indicates the Total Inventory Cost within the simulation period.
- Inventory Cost refers to the inventory Qty multiplied by the Product cost multiplied by the Inventory Holding Cost (default 12%).
# TotalBomCost
Applicable Algorithms: SIM
Description:
- Indicates the BOM cost of the internal production input of the simulation period.
- BOM cost is calculated based on Bom.
# TotalQuantity
Applicable Algorithms: SIM
Description:
- Indicates the Total Demand of the network within the simulation period.
# TotalUnservedDemandQty
Applicable Algorithms: SIM
Description:
- Statistics on the unfulfilled customer demand.
- The statistical caliber is Product quantity.
# TotalOrder
Applicable Algorithms: SIM
Description:
- Indicates the total number of orders within the simulation period.
# LostQuantity
Applicable Algorithms: SIM
Description:
- Statistics on the unfulfilled customer demand.
- The statistical caliber is Product quantity.
# TotalOrderline
Applicable Algorithms: SIM
Description:
- Total number of Order Lines.
# LostOrderline
Applicable Algorithms: SIM
Description:
- The number of Order Lines that are still unsatisfied after the simulation ends.
# OrderFillRate
Applicable Algorithms: SIM
Description:
- Indicates the number of orders completed within the Duration.
- If any order line is not completed within the Max Service Time, the order is marked as unsatisfied.
# ServicedOrderlines
Applicable Algorithms: SIM
Description:
- The number of Order Lines that can be satisfied within the Max Service Time.
# OrderlineFillRate
Applicable Algorithms: SIM
Description:
- Orderline Fill Rate within the Max Service Time.
# CustomerSingleSourceRate
Applicable Algorithms: SIM
Description:
- Statistically analyze the proportion of order quantity from a single source to the total order quantity, with scenarios as the dimension.
- The definition of a single source is that all product lines under a single order number are sourced from the same Site.
# QuantityFillRate
Applicable Algorithms: SIM
Description:
- Indicates the ratio of product quantity shipped within the Max Service Time to the total demand quantity.
# AverageInventoryValue
Applicable Algorithms: SIM
Description:
- Indicates the average on-hand inventory value during the simulation period.
- The Average Inventory Value is equal to Average Inventory Quantity multiplied by the unit Value of the Product.
# TotalExpiredQuantity
Applicable Algorithms: SIM
Description:
- Indicates the total expired Qty of the network within the simulation period.
- The products are expired because their storage period in the warehouse exceeds the Product Shelf Life.
# OutputNetworkCarbonSummary
# Scenario
Applicable Algorithms: NO
Description:
- Indicates ScenarioName.
# SiteName
Applicable Algorithms: NO
Description:
- Indicates the Site object where carbon trading and carbon tax occur.
# PeriodName
Applicable Algorithms: NO
Description:
- Indicates the Period object where carbon trading and carbon tax occur
# Co2
Applicable Algorithms: NO
Description:
- Indicates the total Carbon emissions by Scenario, Site, and Period dimensions.
# CarbonSales
Applicable Algorithms: NO
Description:
- Indicates the total Carbon Sales by Scenario, Site, and Period dimensions.
# CarbonPurchase
Applicable Algorithms: NO
Description:
- Indicates the total Carbon Purchase by by Scenario, Site, and Period dimensions.
# EndingCarbon
Applicable Algorithms: NO
Description:
- Indicates the Ending Carbon by Scenario, Site, and Period dimensions.
# CarbonSalesRevenue
Applicable Algorithms: NO
Description:
- Indicates the total Carbon Sales Revenue by Scenario, Site, and Period dimensions.
# CarbonPurchaseCost
Applicable Algorithms: NO
Description:
- Indicates the total Carbon Purchase Cost by Scenario, Site, and Period dimensions.
# CarbonCost
Applicable Algorithms: NO
Description:
- Indicates the total Carbon Cost (carbon tax) by Scenario, Site, and Period dimensions.
# TotalCo2Cost
Applicable Algorithms: NO
Description:
- Indicates the total of Carbon Purchase Cost and Carbon Cost (carbon tax) by Scenario, Site, and Period dimensions.
# OutputNetworkPathLane
# Scenario
Applicable Algorithms: NO
Description:
- Indicates the Scenario where the network optimization result is located.
# Lane
Applicable Algorithms: NO
Description:
- Used to identify which end-to-end Site service Lane this Route belongs to
# SourceName
Applicable Algorithms: NO
Description:
- Indicates the upstream-most Site in the end-to-end route where the product is shipped from.
# StartProduct
Applicable Algorithms: NO
Description:
- Indicates the initial status of the Product, which may be Raw material or Finished Product.
# StartPeriod
Applicable Algorithms: NO
Description:
- Indicates the Starting Period of the end-to-end transport route.
# SiteName
Applicable Algorithms: NO
Description:
- Indicates the End Site of the end-to-end transport route.
# EndProduct
Applicable Algorithms: NO
Description:
- Indicates the Product Status upon arrival at the final destination station.
# EndPeriod
Applicable Algorithms: NO
Description:
- Indicates the end Period of the end-to-end transport route.
# Path
Applicable Algorithms: NO
Description:
- Indicates the end-to-end transport route details from the origin Site to the end Site, including the intermediate Site and the mode name used for each route.
# Quantity
Applicable Algorithms: NO
Description:
- Indicates the quantity of the Product transported by this end-to-end transport route.
# PercentQuantity
Applicable Algorithms: NO
Description:
- Indicates the percentage of Product quantity transported by this end-to-end transport route compared to the demand at the destination Site.
# Revenue
Applicable Algorithms: NO
Description:
- Indicates the Revenue of the Product transported by this end-to-end transportation route.
# TotalCost
Applicable Algorithms: NO
Description:
- Indicates the total network cost of transporting the Product on this end-to-end transport route.
- Total Cost = Operating Cost + Sourcing Cost + Transportation Cost + Inbound Warehousing Cost + Outbound Warehousing Cost + Production Cost + Inventory Holding Cost
# UnitLandedCost
Applicable Algorithms: NO
Description:
- Indicates the unit cost for transporting products on this end-to-end transport route.
- Unit Total Cost = Total Cost / Quantity
# Profit
Applicable Algorithms: NO
Description:
- Indicates the Profit of the Product transported by this end-to-end transport route.
- Profit = Revenue - Total Cost
# UnitProfit
Applicable Algorithms: NO
Description:
- Indicates the unit Profit per piece of Product transported by this end-to-end transport route.
- Unit Profit = Profit / Quantity
# OperatingMargin
Applicable Algorithms: NO
Description:
- Indicates the profit margin of the Product transported by this end-to-end transport route.
- Operating Margin = Unit Profit / Price
# OperatingCost
Applicable Algorithms: NO
Description:
- Indicates the cost incurred in maintaining normal operation of Site and Work Center on this end-to-end transportation route within the optimized network.
# SourcingCost
Applicable Algorithms: NO
Description:
- Indicates the Sourcing Cost of purchasing Product from logistics facilities using this end-to-end transportation route in the optimized network model.
- Sourcing Cost = Product Quantity * Unit Procurement Cost
# TransportationCost
Applicable Algorithms: NO
Description:
- Indicates the Transportation Cost of transporting the Product using this end-to-end transportation route in the optimization network model. This cost is composed of the Product quantity, the Variable Transportation Cost in the Transportation Policies Input Table, and the Variable Cost Basis (such as Distance, Quantity, Weight).
# InboundWarehousingCost
Applicable Algorithms: NO
Description:
- Indicates the cost of receiving and warehousing for this end-to-end transportation route in the optimized network model.
- Inbound Warehousing Cost = Product Quantity * Variable Inbound Cost of all Site along the optimized route.
# OutboundWarehousingCost
Applicable Algorithms: NO
Description:
- Indicates the cost of shipping out of the warehouse for this end-to-end transportation route in the optimized network model.
- Outbound warehousing cost = Product Quantity * Variable Outbound Cost of all Site along the optimized route.
# ProductionCost
Applicable Algorithms: NO
Description:
- Indicates the Total Production Cost of the Product flow for this end-to-end transportation route in the optimized network model.
# InvCarryingCostPct
Applicable Algorithms: NO
Description:
- Indicates the Total Cost of the Product flow inventory held in this end-to-end transportation route in the optimized network model, including capital cost and storage cost.
- Capital Cost = Product Inventory Quantity * Product Value * Holding Cost Percentage * Inventory duration.
- Storage Cost = Variable Storage Cost (in the Inventory Policies table) * Product Inventory Quantity.
# PreBuildInventoryCost
Applicable Algorithms: NO
Description:
- Indicates the PreBuild Inventory Holding Cost of the Produc for this end-to-end transportation route in the optimized network model.
- PreBuild Inventory Holding Cost = PreBuild Inventory Quantity * Variable Cost * Inventory Holding Cost (default 12%).
# TurnEstimatedInventoryCost
Applicable Algorithms: NO
Description:
- Indicates the Inventory Holding Cost estimated by InventoryTurns for this end-to-end transportation route Product in the optimized network model.
- Inventory Holding Cost estimated by InventoryTurns = Estimated Inventory Based on InventoryTurns * (Unit Product Value * Inventory Holding Cost% (default 12%) + Unit Storage Cost).
- If InventoryTurns in the Inventory Polices table is filled in, Turn Estimated Inventory = Total outbound quantity / InventoryTurns.
# WipHoldingCost
Applicable Algorithms: NO
Description:
- Indicates the Inventory Holding Cost of all work-in-progress (WIP) on this end-to-end transport route in the optimized network model.
- WIP inventory applies to the quantity of products that are in production and unavailable.
- WIP Inventory Holding Cost = WIP Inventory Quantity * Unit Product Value * Inventory Holding Cost% (default 12%).
# InTransitInventoryHoldingCost
Applicable Algorithms: NO
Description:
- Indicates the cost of In-Transit Inventory on this end-to-end transportation route in the optimized network model, resulting from products being unavailable for use due to transportation.
- In-Transit Inventory Holding Cost = In-transit Inventory * Product Value * Inventory Holding Percentage * Period Days / 365.
# CycleStockCost
Applicable Algorithms: NO
Description:
- Indicates the sum of Product Cycle Inventory costs on this end-to-end transportation route in the optimized network model.
- Cycle Inventory Cost = Cycle Inventory Quantity * Unit Product Value * Inventory Holding Cost % (default is 12%).
# Distance
Applicable Algorithms: NO
Description:
- Indicates the total distance of the end-to-end transportation route in the optimized network model.
# LeadTime
Applicable Algorithms: NO
Description:
- Indicates the Total Time (days) of the end-to-end transportation route in the optimized network model.
# OutputNetworkPathSummary
# Scenario
Applicable Algorithms: NO
Description:
- Indicates the scenario where the network optimization result is located.
# SiteName
Applicable Algorithms: NO
Description:
- Indicates the End Site Group of the transport route.
# EndProduct
Applicable Algorithms: NO
Description:
- Indicates Product Group Status when fulfilled to End Site Group.
# EndPeriod
Applicable Algorithms: NO
Description:
- Indicates the end period of the transport route.
# Quantity
Applicable Algorithms: NO
Description:
- Indicates the Qty of the transport Product Group.
# Revenue
Applicable Algorithms: NO
Description:
- Indicates the revenue of a Product Group shipped to the Site.
# TotalCost
Applicable Algorithms: NO
Description:
- Indicates the total network cost of transporting to a Product Group at the Site.
- Total Cost = Operating Cost + Sourcing Cost + Transportation Cost + Inbound Warehousing Cost + Outbound Warehousing Cost + Production Cost + Inventory Holding Cost
# UnitLandedCost
Applicable Algorithms: NO
Description:
- Indicates the unit cost of transporting to a product group of the site.
- Unit Total Cost = Total Cost / Qty
# Profit
Applicable Algorithms: NO
Description:
- Indicates the Total Profit of a Product Group shipped to the Site.
- Profit=Revenue-Total Cost
# UnitProfit
Applicable Algorithms: NO
Description:
- Indicates the Profit of the number of units shipped to a Product Group at the Site.
- Unit Profit = Profit/Qty
# OperatingMargin
Applicable Algorithms: NO
Description:
- Indicates the profit rate of a product group shipped to the site.
- Profit rate = unit profit / price
# OperatingCost
Applicable Algorithms: NO
Description:
- Indicates the total cost incurred in maintaining the normal operation of Site Group and Work Center in all routes transporting to a Product Group at the Site.
# SourcingCost
Applicable Algorithms: NO
Description:
- Indicates the Total Sourcing Cost of a Product Group at the Site.
- Sourcing Cost = Product GroupQty \ * Unit Sourcing Cost.
# TransportationCost
Applicable Algorithms: NO
Description:
- Indicates the sum of the Transportation Cost of all routes transporting to a Product Group at the Site. This cost is composed of the Product Group Qty, the Variable Transportation Cost in the TransportationPolicies Table, and the Variable Cost Basis (such as Distance, Qty, Weight).
# InboundWarehousingCost
Applicable Algorithms: NO
Description:
- Indicates the sum of the costs of receiving goods into the warehouse for all routes transporting to a certain Product Group at the Site.
- Inbound Warehousing Cost = Product GroupQty * Variable Inbound Warehousing Costs for All Stations on the Optimized Path.
# OutboundWarehousingCost
Applicable Algorithms: NO
Description:
- Indicates the sum of the outbound shipping costs of all routes transporting to a certain Product Group at the Site.
- Outbound Warehousing Cost = Product GroupQty * Variable Outbound Warehousing Costs for All Stations on the Optimized Path.
# ProductionCost
Applicable Algorithms: NO
Description:
- Indicates the Total Cost of producing a Product Group at the Site.
# InvCarryingCostPct
Applicable Algorithms: NO
Description:
- Indicates the total cost of the inventory held by the Site Group in all routes transported to a Product Group at the Site, including capital cost and storage cost.
- Capital cost = Product Group inventory Qty \ * Product Group value * Holding cost Percentage * Inventory time length.
- Storage cost = Variable Storage Cost (in the InventoryPolicies table ) * Product Group inventory Qty.
# PreBuildInventoryCost
Applicable Algorithms: NO
Description:
- Indicates the Pre-build Inventory Holding Cost of the Site Group in all routes transported to a Product Group of the Site.
- Pre-build Inventory Cost = Pre Build Inventory * Unit Cost * Inventory Holding Cost (default 12%).
# TurnEstimatedInventoryCost
Applicable Algorithms: NO
Description:
- Indicates the estimated Inventory Holding Cost of a Site Group based on the turnover rate in all routes transported to a Product Group at the Site.
- Turn estimated inventory cost = Turn Estimated Inventory \ * (Unit Product Group Value * Inventory Holding Cost% (default 12%) + Unit Storage Cost).
- If Inv Turns in the InventoryPolicies table was input, Turn Estimated Inventory = Total Outbound flow Quantity / Inv Turns.
# WipHoldingCost
Applicable Algorithms: NO
Description:
- Indicates the Inventory Holding Cost of the work in progress that is transported to the factory in all routes of a Product Group of the Site.
- Work In Progress Inventory applies to Product GroupQty that is in production and unavailable.
- Work in Progress Inventory Holding Cost = Work In Progress Inventory quantity \ * Unit Product Group Value - Inventory Holding Cost% (default 12%).
# InTransitInventoryHoldingCost
Applicable Algorithms: NO
Description:
- Indicates the cost of In Transit Inv caused by the inability to use the Product Group due to transportation in all routes to a Product Group at the Site.
- In Transit Inventory Holding Cost = In Transit Inv \Product GroupValue \ * Inventory Holding Percentage * Period Days/365.
# CycleStockCost
Applicable Algorithms: NO
Description:
- Indicates the sum of the PeriodInventory Holding Cost of the Site Group in all routes transported to a Product Group at the Site.
- PeriodInventory Holding Cost = Period Inventory \ * Unit Product Group Value * Inventory Holding Cost% (default 12%).
# Distance
Applicable Algorithms: NO
Description:
- Indicates the weighted Distance of all routes from the most upstream Site Group to the End Site Group in the optimized network model.
- If multiple routes are involved, Distance = route1QtyPercentage \ * route1Distance+route2QtyPercentage * route2Distance+...+routenQtyPercentage * routenDistance.
# LeadTime
Applicable Algorithms: NO
Description:
- Indicates the weighted time (days) of all routes from the most upstream Site Group to the End Site Group of the optimized network model.
- If multiple routes are involved, Distance = Route 1 QtyPercentage \ * Route 1 Lead Time + Route 2 QtyPercentage * Route 2 Lead Time + ... + Route n QtyPercentage * Route n Lead Time.
# OutputSimInTransitInventorySummary
# Scenario
Applicable Algorithms: SIM
Description:
- Indicates the Scenario Name related to simulation event.
# SourceName
Applicable Algorithms: SIM
Description:
- Indicates the source site related to simulation event.
# SiteName
Applicable Algorithms: SIM
Description:
- Indicates the destination site related to simulation event.
# ProductName
Applicable Algorithms: SIM
Description:
- Indicates the Product Name related to simulation event.
# AverageQuantity
Applicable Algorithms: SIM
Description:
- In Transit InvQty is the average in-transit value of the Product in the corresponding Lane during the simulation period.
- In Transit InvQty is the Product Qty in the in-transit status at a certain moment.
# MaximumQuantity
Applicable Algorithms: SIM
Description:
- The maximum value of In-transit InvQty at Lane-Product level in the simulation period.
- In-transit InvQty is the Qty of the Product in the in-transit status at a certain moment.
# AverageValue
Applicable Algorithms: SIM
Description:
- In-transit InvValue = In-transit InvQty × Product GroupValue
- Product Value is input from the Product table.
# MaximumValue
Applicable Algorithms: SIM
Description:
- At Lane-Product level, calculate the maximum Value of the In-transit Inventory.
# AverageNumShipment
Applicable Algorithms: SIM
Description:
- The average count of the shipments of the current Product in the corresponding Lane during the simulation period.
- The number of shipment lines means the count of the shipment lines of the certain Product that is in transit at a certain moment.
# MaximumNumShipment
Applicable Algorithms: SIM
Description:
- The maximum value among the shipments of the current Product in the corresponding Lane during the simulation period.
- The number of in-transit shipments is the count of shipments of the current Product that is in-transit at a certain moment.
# OutputShipmentLane
# Scenario
Applicable Algorithms: OA
Description:
- Indicates the corresponding Scenario Name of the Shipment Lane ouput.
# SourceName
Applicable Algorithms: OA
Description:
- Indicates the source site of the Shipment Lane.
# CustomerName
Applicable Algorithms: OA
Description:
- Indicates the destination of of the Shipment Lane.
# ProductName
Applicable Algorithms: OA
Description:
- Indicates the Product transported on the Shipment Lane.
# LaneName
Applicable Algorithms: OA
Description:
- Indicates the name of the assigned Shipment Lane.
# ShippingDate
Applicable Algorithms: OA
Description:
- Indicates the date of shipment from the Source Site.
# TotalOrders
Applicable Algorithms: OA
Description:
- Indicates the total number of Orders on this Shipment Lane.
# Quantity
Applicable Algorithms: OA
Description:
- Indicates the total Qty of the Product on this Shipment Lane.
# Weight
Applicable Algorithms: OA
Description:
- Indicates the total Weight of the Product on this Shipment Lane.
# Volume
Applicable Algorithms: OA
Description:
- Indicates the total Volume of the Product on this Shipment Lane.
# Lots
Applicable Algorithms: OA
Description:
- Indicates the Shipment Lot Size of the Product on the Shipment Lane.
# Value
Applicable Algorithms: OA
Description:
- Indicates the total Value of Products on the Shipment Lane.
# VariableCost
Applicable Algorithms: OA
Description:
- Indicates the Variable Transportation Cost of the Shipment Lane.
- Variable Cost = Unit Shipment Cost \ * the Flow Unit.
# FixedCost
Applicable Algorithms: OA
Description:
- Indicates the Fixed Shipment Cost of the Shipment Lane.
# TotalHoldingCost
Applicable Algorithms: OA
Description:
- Indicates the total Holding Cost of the orders on this Shipment Lane, which is composed of the number of Storage Days and the Unit Holding Cost defined in the Shipments input table.
# LotCost
Applicable Algorithms: OA
Description:
- Indicates the Shipment Lot Cost of the Shipment Lane.
- Lot Cost = Lot Qty \ * Unit Lot Cost.
# TotalCost
Applicable Algorithms: OA
Description:
- Indicates the Total Cost of the Shipment Lane.
- Total Cost = Variable Cost + Fixed Cost + Lot Cost + Total Holding Cost
# OnTimeRate
Applicable Algorithms: OA
Description:
- Indicates the proportion of Shipments arriving on time in this Lane.
- On Time Rate = Qty on-time Shipments / Total Qty of Shipments.
# OutputShipmentAssignmentSummary
# Scenario
Applicable Algorithms: OA
Description:
- Indicates the corresponding Scenario Name of the Shipment Assignment Summary ouput.
# SolveTime
Applicable Algorithms: OA
Description:
- Indicates the duration of the model run (UOM: minutes).
# TotalOrders
Applicable Algorithms: OA
Description:
- Indicates the total count of Shipments within the model horizon.
# TotalQuantity
Applicable Algorithms: OA
Description:
- Indicates the total Quantity of products in the Shipments within the model horizon.
# TotalWeight
Applicable Algorithms: OA
Description:
- Indicates the total Weight of products in the Shipments within the model horizon.
# TotalValue
Applicable Algorithms: OA
Description:
- Indicates the total Value of products in the Shipments within the model horizon.
# TotalVolume
Applicable Algorithms: OA
Description:
- Indicates the total Volume of products in the Shipments within the model horizon.
# TotalLots
Applicable Algorithms: OA
Description:
- This field will take effect after setting the Lot Size.
- Indicates the total number of Shipment Lots within the model horizon.
# VariableCost
Applicable Algorithms: OA
Description:
- Indicates the sum of Variable Costs within the model horizon.
# FixedCost
Applicable Algorithms: OA
Description:
- Indicates the sum of Fixed Costs within the model horizon.
# LotCost
Applicable Algorithms: OA
Description:
- Indicates the sum of Lot Costs within the model horizon.
# TotalHoldingCost
Applicable Algorithms: OA
Description:
- Indicates the sum of Holding Costs within the model horizon.
# ConstraintPenaltyCost
Applicable Algorithms: OA
Description:
- Indicates the sum of Penalty Costs within the model horizon.
# TotalCost
Applicable Algorithms: OA
Description:
- Indicates the Total Cost excluding Penalty Cost within the model horizon.
# OnTimeRate
Applicable Algorithms: OA
Description:
- Indicates the proportion of shipments that are delivered on time in relation to the total number of shipments within the optimization output.
# OutputToTransportationSummary
# Scenario
Applicable Algorithms: TO
Description:
- Indicates the corresponding Scenario Name of the VRP ouput.
# SolveStartTime
Applicable Algorithms: TO
Description:
- Indicates the model running StartTime.
# SolveDuration
Applicable Algorithms: TO
Description:
- Indicates the solving duration of the optimization model (UOM: minutes).
# OptimizationType
Applicable Algorithms: TO
Description:
- Indicates the Solution Type of the optimization model. The default is Self-detected, which means that the model automatically detects based on the input table.
# TotalTransportationSystemCost
Applicable Algorithms: TO
Description:
- Indicates the Total Cost generated in the VRP optimization.
- Total Transportation Cost = Total Route Cost + Total Direct Shipping Cost + Total Asset Cost.
# TotalRouteCost
Applicable Algorithms: TO
Description:
- Indicates the sum of the costs associated with each Route Id in the VRP optimization.
- Total Route Cost equals to the sum of the Total Cost under this Scenario in the Route Summary Table.
# TotalDirectShippingCost
Applicable Algorithms: TO
Description:
- Indicates the sum of the Direct Shipment Costs of all the unassinged Shipments in the VRP optimization.
- The Direct Shipment Cost is calculated based on the Shipments input table.
# TotalFixedAssetCost
Applicable Algorithms: TO
Description:
- Indicates the sum of the Fixed Cost of the Assets used in the VRP optimization.
- The Fixed Cost of each Asset comes from the Fixed Cost field defined in the TransportationAsset table.
# TotalInventoryHoldingCost
Applicable Algorithms: TO
Description:
- Indicates the sum of Holding Cost in VRP optimization.
- Not effective yet.
# TotalRoutes
Applicable Algorithms: TO
Description:
- Indicates the total number of Routes in VRP optimization (one Route represents a Transportation Asset travels from the Start Site and eventually returns to the origin).
# TotalAssets
Applicable Algorithms: TO
Description:
- Indicates the total number of Transportation Assets used by VRP optimization.
# TotalStops
Applicable Algorithms: TO
Description:
- Indicates the total number of stops for the Transportation Assets in the VRP optimization, including Asset Domiciles (Start Site or End Site).
- In general, if the Transportation Assets needs to return Asset Domiciles, Total Stops = Total In Transit Stops + 2 \ * Total Routes.
# TotalInTransitStops
Applicable Algorithms: TO
Description:
- Indicates the sum of In Transit Stops of all Transportation Assets made in the VRP optimization, excluding Asset Domiciles (Only Start Site and End Site count).
# TotalDistance
Applicable Algorithms: TO
Description:
- Indicates the sum of the driving distances of all Transportation Assets in the VRP optimization, including the empty driving distance.
# TotalRepositionDistance
Applicable Algorithms: TO
Description:
- Indicates the sum of reposition distance of the Transportation Assets in the VRP optimization.
- Reposition distance refers to the distance that a Transportation Asset travels without loads(i.e., there is no cargo on the vehicle, the vehicle is empty on the way to the pickup location, or the vehicle is empty on the way back to the domicile).
# TotalTime
Applicable Algorithms: TO
Description:
- Indicates the sum of the waiting, driving, loading, and unloading times of all Transportation Assets in the VRP optimization.
# TotalInputQuantity
Applicable Algorithms: TO
Description:
- Indicates the sum of all input Shipments Qty under the scenario of this VRP optimization model.
# TotalOutputQuantity
Applicable Algorithms: TO
Description:
- Indicates the sum of the dispatched Shipments Qty under the scenario of this VRP optimization model.
# TotalInputWeight
Applicable Algorithms: TO
Description:
- Indicates the sum of the Weight of all input Shipments under the scenario of this VRP optimization model.
# TotalOutputWeight
Applicable Algorithms: TO
Description:
- Indicates the sum of the Weight of the dispatched Shipments under the scenario of this VRP optimization model.
# TotalInputCubic
Applicable Algorithms: TO
Description:
- Indicates the total Volumes of all the input Shipments under the scenario of this VRP optimization model.
# TotalOutputCubic
Applicable Algorithms: TO
Description:
- Indicates the sum of the Volumes of the assigned Shipments under the Scenario of this VRP optimization model.
# TotalSegments
Applicable Algorithms: TO
Description:
- Indicates the sum of the route segments of all Routes in the VRP optimization.
- In each Route, a route segment is from the previous location to the next location.
# TotalDeliveries
Applicable Algorithms: TO
Description:
- Indicates the sum of Delivery Stops of all Routes in the VRP optimization.
# TotalUnroutedShipments
Applicable Algorithms: TO
Description:
- Indicates the number of unassigned Shipments in the VRP optimization.
- Unassigned Shipments refers to the total number of Shipments with Unrouted Status.
# TotalInvalidShipments
Applicable Algorithms: TO
Description:
- Indicates the number of invalid Shipments in VRP optimization (caused by invalid input syntax, for example: the Names of Source, Destination or the Transportation Assets are not defined in the corresponding input table, etc.).
# AssetTimeUtilization
Applicable Algorithms: TO
Description:
- Indicate the average time utilization rate of each Transportation Asset in the VRO Asset Details table.
# RouteUtilization
Applicable Algorithms: TO
Description:
- Equal to the average loading utilization rate of each Transportation Asset in the VRO Asset Details table.
# RouteUtilizationInQuantity
Applicable Algorithms: TO
Description:
- Equal to the average loading utilization rate of each VRP Utilization(Quantity level) in the VRO Asset Details table.
# RouteUtilizationInWeight
Applicable Algorithms: TO
Description:
- Equal to the average loading utilization rate of each VRP Utilization(Weight level) in the VRO Asset Details table.
# RouteUtilizationInVolume
Applicable Algorithms: TO
Description:
- Equal to the average loading utilization rate of each VRP Utilization(Volume level) in the VRO Asset Details table.
# ScenarioId
Applicable Algorithms: TO
Description:
- The model-assigned keys for different scenarios.
# SolverSetting
Applicable Algorithms: TO
Description:
- Indicates the Model Settings, displayed in “default” under the current setting.
# OutputToTransportationAssetSummary
# Scenario
Applicable Algorithms: TO
Description:
- Indicates the corresponding Scenario Name of the VRP ouput.
# SiteName
Applicable Algorithms: TO
Description:
- Indicates the name of Site in the VRP optimization.
# AssetName
Applicable Algorithms: TO
Description:
- Indicates the name of the Trasportatoion Asset at this Site in the VRP optimization.
# AvailableUnits
Applicable Algorithms: TO
Description:
- Indicates the available units of the Transportation Asset at this Site in the VRP optimization.
- It equals to the defined quantity of the Transporation Assets in the Asset Assignment table. If the Fleet Optimization in the model Option is false, this filed will not take effect.
# AssetsUsed
Applicable Algorithms: TO
Description:
- Indicates the quantity of each type of transportation asset in use at each site within the model horizon in the VRP optimization.
# ScenarioId
Applicable Algorithms: TO
Description:
- The model-assigned keys for different scenarios.
# OutputToRouteSummary
# Scenario
Applicable Algorithms: TO
Description:
- Indicates the corresponding Scenario Name of the VRP ouput.
# Route
Applicable Algorithms: TO
Description:
- Indicates the name of a Route.
- A Route is defined as the sequence of activities that a vehicle undertakes, starting from its departure, proceeding through loading and unloading operations, and ultimately returning to its original location.
# AssetName
Applicable Algorithms: TO
Description:
- Indicates the name of Transportation Asset in use on this Route.
# TotalCost
Applicable Algorithms: TO
Description:
- Indicates the Total Cost on this Route, including the Fixed Cost.
# DirectShippingCost
Applicable Algorithms: TO
Description:
- Indicates Direct Shipping Cost in the OutputToRouteSummary
# TotalDistance
Applicable Algorithms: TO
Description:
- Indicates the distance traveled from the start to the end of the Asset Id in the transport Route Id (including reposition distance).
# FixedAssetCost
Applicable Algorithms: TO
Description:
- Indicates the Fixed Cost on this Route. This Fixed Cost corresponds to the Fixed Cost defined in the Rate table.
# UnitCost
Applicable Algorithms: TO
Description:
- Indicates the cost associated with the transport volume on this Route, which corresponds to the PerUnitCost and UnitCostBasis in the Rate table.
# TotalStops
Applicable Algorithms: TO
Description:
- Indicates the total number of Stops on this Route, including the SourceSite and the DestinationSite.
# InTransitStops
Applicable Algorithms: TO
Description:
- Indicates the total number of Stops on this Route, excluding the SourceSite and the DestinationSite.
# TotalWeight
Applicable Algorithms: TO
Description:
- Indicates the sum of the Weight of all Shipments on this Route(in kg).
# TotalCubic
Applicable Algorithms: TO
Description:
- Indicates the sum of the Volume of all Shipments on this Route(in m³).
# TotalQuantity
Applicable Algorithms: TO
Description:
- Indicates the sum of the Quantity of all Shipments on this Route(in pc).
# StartDate
Applicable Algorithms: TO
Description:
- Indicates the Start Date Time of the Route.
# EndDate
Applicable Algorithms: TO
Description:
- Indicates the End Date Time of the Route.
# TotalTime
Applicable Algorithms: TO
Description:
- Indicates the Total Time used on the Route, which is the duration from the Route Start Time to the Route End Time.
# DutyTime
Applicable Algorithms: TO
Description:
- Indicates the total Duty Time used on the Route, which equals to the sum of waiting, loading, driving, and unloading time.
# DriveTime
Applicable Algorithms: TO
Description:
- Indicates the total Drive Time on the Route.
# RepositionTime
Applicable Algorithms: TO
Description:
- Indicates the total Reposition Time of a vehicle on the Route(Reposition Time represents an empty vehicle driving to pick up goods, or empty vehicle returning to the Source Site after delivery, etc.).
# WaitTime
Applicable Algorithms: TO
Description:
- Indicates the total Wait Time on the Route. Generally, the wait of a vehicle is caused by arriving earlier than the time window at the Destination Site.
# OvernightTime
Applicable Algorithms: TO
Description:
- Indicates the total Overnight Time on the Route.
- This field is currently not valid in Hub function.
# ServiceTime
Applicable Algorithms: TO
Description:
- Indicates the total loading and unloading time on the Route.
# RepositionDistance
Applicable Algorithms: TO
Description:
- Indicates the reposition distance of the transport Route Id, corresponding to the Reposition Time.
# AssetDomicile
Applicable Algorithms: TO
Description:
- Indicates the name of Domicile to which the Transportation Asset on the Route belongs, that is the Source Site of the Transportation Asset.
# CapacityQuantity
Applicable Algorithms: TO
Description:
- Indicates the maximum quantity of Product that the Transportation Asset on the Route can carry. If the asset has no Qty capacity limit, this column displays 0.
- If there are multiple products can be carried on the Route, then this field will be calculated based on the Product that can be loaded in the largest quantity under the same conditions.
# CapacityVolume
Applicable Algorithms: TO
Description:
- Indicates the maximum volume of Product that the Transportation Asset on the Route can carry. If the asset has no Volume capacity limit, this column displays 0.
- If there are multiple products can be carried on the Route, then this field will be calculated based on the Product that can be loaded in the largest volume under the same conditions.
# CapacityWeight
Applicable Algorithms: TO
Description:
- Indicates the maximum Weight of Product that the Transportation Asset on the Route can carry. If the asset has no Weight capacity limit, this column displays 0.
- If there are multiple products can be carried on the Route, then this field will be calculated based on the Product that can be loaded in the largest Weight under the same conditions.
# DutyCost
Applicable Algorithms: TO
Description:
- It is equal to the Duty Time of the Route multiplied by the Unit Duty Cost ($/h) in the Rate table corresponding to the Transportation Asset used by the Route.
# DriveTimeCost
Applicable Algorithms: TO
Description:
- Equal to the Drive Time of the transport Route Id * Drive Time Cost (yuan/h) in the transport Rate Id table corresponding to the Asset used by the transport Route Id.
# ServiceTimeCost
Applicable Algorithms: TO
Description:
- Equal to the Service Time of the transport Route Id * the Service Time Cost (yuan/h) in the transport Rate Id table corresponding to the Asset used by the transport Route Id.
# FixedRestTimeCost
Applicable Algorithms: TO
Description:
- Equal to the number of overnight stays on the Route multiplied by the Unit Overnight Cost in the Rate table corresponding to the Transportation Asset used on this Route.
# WaitCost
Applicable Algorithms: TO
Description:
- Equal to the Wait Time(hour) on this Route multiplied by the Unit Wait Time Cost ($/h) in the Rate table corresponding to the Transportation Asset used on this Route.
# TotalStopCost
Applicable Algorithms: TO
Description:
- It is equal to the total Stops on the Routes multiplied by the InTransitStopCost in the Rate table corresponding to the Transportation Asset used on the Route.
# TotalDistanceCost
Applicable Algorithms: TO
Description:
- Equal to the total travel distance of the Route multiplied by the DistanceCostPerKm in the Rate table corresponding to the Transportation Asset used on the Route.
# TotalPerRepositionDistanceCost
Applicable Algorithms: TO
Description:
- It is equal to the Reposition Distance multiplied by the unit RepositionDistanceCostPerKm in the Rate input table corresponding to the Transportation Asset used on the Route.
# DeliveredStops
Applicable Algorithms: TO
Description:
- Equal to the total number of Delivery Stops on the Route during the model Horizon.
# DeliveredQty
Applicable Algorithms: TO
Description:
- Indicate the total Quantity of Products in the Shipments on the Route that have been delivered during the model Horizon.
# DeliveredWeight
Applicable Algorithms: TO
Description:
- Indicate the total Weight of Products in the Shipments on the Route that have been delivered during the model Horizon.
# DeliveredCubic
Applicable Algorithms: TO
Description:
- Indicate the total Volume of Products in the Shipments on the Route that have been delivered during the model Horizon.
# PickupStops
Applicable Algorithms: TO
Description:
- Equal to the total number of Pickup Stops on the Route during the model Horizon.
# PickupQty
Applicable Algorithms: TO
Description:
- Indicate the total Quantity of Products in the Shipments on the Route that have been picked up during the model Horizon.
# PickupWeight
Applicable Algorithms: TO
Description:
- Equal to the sum of the Weights of the Shipments on this Route.
# PickupCubic
Applicable Algorithms: TO
Description:
- Equal to the sum of the Volumes of the Shipments on this Route.
# AssetId
Applicable Algorithms: TO
Description:
- Indicates the Name of the Transportation Asset used on the Route. The model automatically connects the Transportation Asset, SourceSite, DestinationSite, Id and other information to create the unique Asset Id.
# RouteSequence
Applicable Algorithms: TO
Description:
- Indicates the sequential order number of the Transportation Asset among all its Routes, usually a positive integer.
# RouteUtilization
Applicable Algorithms: TO
Description:
- It is equal to the maximum value of Route Utilization Rate measured in the following three dimensions, that is, max(Route Quantity Utilization, Route Weight Utilization, Route Volume Utilization).
# RouteUtilizationInQuantity
Applicable Algorithms: TO
Description:
- It is equal to the sum of the actual load Quantity on the Route divided by the maximum load Quantity of the Transportation Asset used on the Route. Note that for scenarios with pick-up and delivery on the Route, the Route Utilization may be greater than 1.
# RouteUtilizationInWeight
Applicable Algorithms: TO
Description:
- It is equal to the sum of the actual load Weight on the Route divided by the maximum load Weight of the Transportation Asset used on the Route. Note that for scenarios with pick-up and delivery on the Route, the Route Utilization may be greater than 1.
# RouteUtilizationInVolume
Applicable Algorithms: TO
Description:
- It is equal to the sum of the actual load Volume on the Route divided by the maximum load Volume of the Transportation Asset used on the Route. Note that for scenarios with pick-up and delivery on the Route, the Route Utilization may be greater than 1.
# AdditiveCost
Applicable Algorithms: TO
Description:
- Equal to the sum of the Additive Costs involved in the segmented routes, which share a same Route ID. The additive costs are defined in the additive cost field of the Transit Matrix, and usually refer to tolls, bridge fees, etc.
# RateName
Applicable Algorithms: TO
Description:
- Indicates the Rate corresponding to the Transportation Asset used on the Route, which corresponds to the Rate input table. The corresponding relationships between the Asset and Rate are defined in the Asset Assignment input table.
# DockDoorId
Applicable Algorithms: TO
Description:
- Not yet effective.
# DockDoorStartTime
Applicable Algorithms: TO
Description:
- Not yet effective.
# DockDoorEndTime
Applicable Algorithms: TO
Description:
- Not yet effective.
# DecompositionId
Applicable Algorithms: TO
Description:
- Not yet effective.
# MinimumCost
Applicable Algorithms: TO
Description:
- Indicates the Value of the Minimum Rate of the Transportation Asset on this Route(i.e. the Value of the Minimum Rate defined in the Rate table. If the Value is empty, then 0 is displayed here). This value refers to the minimum cost that will incur on this Route, while the Total Cost on the Route could be higher than the Minimum Cost in the result.
# OverrideCost
Applicable Algorithms: TO
Description:
- Equal to the sum of the Override Costs involved in the segmented routes, which share a same Route ID.
- Override Cost is defined in the Override Cost field of the Transit Matrix table. The model will use Override Cost to override all other cost calculation logic from the SourceSite to the DestinationSite of the segmented Routes.
# InventoryHoldingCost
Applicable Algorithms: TO
Description:
- Not yet effective.
# ScenarioId
Applicable Algorithms: TO
Description:
- The model-assigned keys for different scenarios.
# OutputToPeriodicOptimizationSummary
# Scenario
Applicable Algorithms: TO
Description:
- Indicates which Scenario of the transport period optimization result
# SourceName
Applicable Algorithms: TO
Description: Not effective
# SiteName
Applicable Algorithms: TO
Description:
- Indicates which Site of the transport period optimization result
# FrequencyOfVisit
Applicable Algorithms: TO
Description:
- Indicates the delivery frequency of visit recommended by the transportation period optimization model
# DaysOfVisit
Applicable Algorithms: TO
Description: Not effective
# TotalInventoryHoldingCost
Applicable Algorithms: TO
Description: Not effective
# TotalQuantityDelivered
Applicable Algorithms: TO
Description: Not effective
# TotalWeightDelivered
Applicable Algorithms: TO
Description: Not effective
# TotalVolumeDelivered
Applicable Algorithms: TO
Description: Not effective
# ScenarioId
Applicable Algorithms: TO
Description: Not effective
# OutputWorkResourceSummary
# Scenario
Applicable Algorithms: NO
Description:
- Indicates the corresponding Scenario Name of the network optimization result.
# WorkResource
Applicable Algorithms: NO
Description:
- Indicates the Work Resource used by the Production Process.
# SiteName
Applicable Algorithms: NO
Description:
- Indicates the Site to where the aggregated Work Resources belong.
# PeriodName
Applicable Algorithms: NO
Description:
- Indicates the model Period which is currently in effect.
# WorkResourceHour
Applicable Algorithms: NO
Description:
- Indicates the number of hours used by the Work Resource.
# FixedCost
Applicable Algorithms: NO
Description:
- Indicates the total Work Resource Fixed Cost within the model Period, such as the total management cost of staff members, etc..
# VariableCost
Applicable Algorithms: NO
Description:
- Indicates the hourly variable cost of each Work Resource within the model Horizon.
# TotalCost
Applicable Algorithms: NO
Description:
- Indicates the Total Cost generated by each Work Resource in the model Horizon.
- Total Cost = Fixed Cost + Variable Cost.
# StepCapacity
Applicable Algorithms: NO
Description:
- Indicates the Step Capacity at the Step where the Work Resource reached.
- Obtained based on the Fixed Cost or Hourly Cost entered in the Work Resource (or Work Resource Multi-Period), refer to the Step Capacity field in the Site Summary output table.
# StepRemainingCapacity
Applicable Algorithms: NO
Description:
- Indicates the remaining amount of the Step Capacity where the Work Resource is reached.
- Obtained based on the Fixed Cost or Hourly Cost in the Work Resource (or Work Resource Multi Period table), refer to the Step Remaining Capacity field in the Site Summary output table.
# StepCapacityUtilization
Applicable Algorithms: NO
Description:
- Indicates the utilization rate of the Step Capacity where the Work Resource is reached.
- Obtained based on the Fixed Cost or Hourly Cost entered in the Work Resource table or Work Resource Multi-Period table), refer to the Step Capacity Utilization field in the Site Summary output table.
# TotalCapacity
Applicable Algorithms: NO
Description:
- Indicates the Total Capacity of the Work Resource.
# TotalRemainingCapacity
Applicable Algorithms: NO
Description:
- Indicates the remaining amount of the Total Capacity of the Work Resource.
# TotalCapacityUtilization
Applicable Algorithms: NO
Description:
- Indicates the utilization rate(%) of the Work Resource's total capacity.
# OutputClusteringSummary
# Scenario
Applicable Algorithms: CT
Description:
- The ScenarioName of the classification algorithm executed this time.
# StartTime
Applicable Algorithms: CT
Description:
- The Start Time of the classification algorithm executed this time.
# RunningTime
Applicable Algorithms: CT
Description:
- The Running Time of the classification algorithm executed this time.
# NumClusters
Applicable Algorithms: CT
Description:
- The number of classification algorithm categories.
# NumTrees
Applicable Algorithms: CT
Description:
- The Depth of the classification algorithm tree.
# NumClustringDimensions
Applicable Algorithms: CT
Description:
- The number of dimensions used for classification.
# Flow
# OutputInventory
# Scenario
Applicable Algorithms: NO
Description:
- Indicates the scenario of the inventory output.
# PeriodName
Applicable Algorithms: NO
Description:
- Indicates the Period of the inventory output.
# SiteName
Applicable Algorithms: NO
Description:
- Indicates the Site Name of the inventory output.
# ProductName
Applicable Algorithms: NO
Description:
- Indicates the product name of the inventory output.
# PreBuildInventory
Applicable Algorithms: NO
Description:
- Indicates the inventory quantity that is held in advance for incoming peak season demand.
- Since peak season demand may exceed a site's capacity hence the demand cannot be fulfilled, the site is able to use its idle capacity in earlier period to produce more products as pre-build inventory, within the inventory constraint. Then the pre-built inventory can be used to fulfill the site's demand in addition to its capacity during peak seasons.
- The Pre Build Inventory of current Period = Ending Inventory of the Previous Period = Initial Inventory of the Previous Period + inbound or produced quantity - outbound quantity
# SafetyStock
Applicable Algorithms: NO
Description:
- Indicates buffer inventory to prevent possible stock-outs in case of unexpected demand variance, which is calculated in the network optimization model based on the safety inventory settings in the inventory strategy.
- The Safety Inventory of a period is equal to the Safety Inventory entered in the inventory strategy, and becomes available inventory in the next period.
# CycleStock
Applicable Algorithms: NO
Description: Indicates the inventory used to meet immediate demand.
- Calculated based on the minimum order quantity entered in the Sourcing Policy and Days Between Replenishment in the Transportation Policy, production cycle inventory = minimum production quantity/2, replenishment cycle inventory = max(Days Between Replenishment\Flow Quantity in Period/Period days, minimum order quantity)/2
# TurnEstimatedInventory
Applicable Algorithms: NO
Description:
- If Inventory Turns in the inventory policy table was input, Turn Estimated Inventory = Total outbound flow Quantity/Inventory Turns.
# WorkInProgressInventory
Applicable Algorithms: NO
Description:
- Indicates the inventory of Product that is not available because it is still in production.
- Calculation formula = (production flow\min(Fixed Order Time, remaining time of model horizon)/Period days)/2
# TotalEndingInventory
Applicable Algorithms: NO
Description:
- Indicates the remaining inventory at the end of the Model Horizon of the optimization model.
# TotalEndingInvHoldingCost
Applicable Algorithms: NO
Description:
- Indicates the Inventory Holding Cost generated by the remaining inventory at the end of the Model Horizon of the optimization model, including holding cost and warehousing cost.
# InTransitInventory
Applicable Algorithms: NO
Description:
- Indicates the in-transit inventory quantity on thisLane in the network optimization results.
# InTransitInventoryHoldingCost
Applicable Algorithms: NO
Description:
- Indicates the holding cost of the in-transit inventory on this Lane in the network optimization results.
# TotalInventory
Applicable Algorithms: NO
Description:
- Indicates the Total Inventory of the Product held in the optimization model.
- Equals the pre-build inventory + Safety Inventory + Cycle Stock, excluding in-transit/work-in-progress inventory.
# TotalDos
Applicable Algorithms: NO
Description:
- Indicates the Days of Total Inventory(DOS) on this Lane in the network optimization results.
# TotalInvHoldingCost
Applicable Algorithms: NO
Description:
- Indicates the total holding cost of inventory in the optimization model, including capital cost and storage cost, refer to Input-Inventory Holding Cost.
- Capital Cost = Inventory Quantity\Product Value\ * Holding Cost Percentage\ * Inventory Time Length.
- Storage Cost = Variable Storage Cost (in the inventory policy table)* Inventory Quantity
# TotalInventoryCarryingCostRatio
Applicable Algorithms: NO
Description:
- Total Inventory Carrying Cost Ratio=Inventory Holding Cost/Total Inventory Holding Cost.
# PreBuildInventoryCost
Applicable Algorithms: NO
Description:
- The pre-build Inventory Holding Cost is equal to the sum of the total pre-build Inventory Holding Cost of each Product in each Site.
- The total pre-build Inventory Holding Cost of a single Product is equal to Pre-build Inventory multiplied by Product Value, multiplied by Inventory Holding Cost percentage (default 12%).
# SafetyStockCost
Applicable Algorithms: NO
Description:
- Safety Stock Holding Cost is equal to the sum of the total Safety Stock Holding Cost of each Product in each Site.
- The total Safety Stock Holding Cost of a single Product is equal to Safety Stock multiplied by Product Value, multiplied by Inventory Holding Cost percentage (default 12%).
# CycleStockCost
Applicable Algorithms: NO
Description:
- Cycle Stock Holding Cost is equal to the sum of the total Cycle Stock Holding Cost of each Product in each Site.
- Total Cycle Stock Holding Cost of a single Product is equal to the Cycle Stock multiplied by the Product Value, multiplied by the Inventory Holding Cost percentage (default 12%).
# TurnEstimatedInventoryCost
Applicable Algorithms: NO
Description:
- The Turn-estimated Inventory Holding Cost is equal to the sum of the Turn-estimated Inventory Holding Cost of each Product in each Site.
- The Turn-estimated Inventory Holding Cost for a single Product is equal to the Turn-estimated Inventory \ * Product Value * Inventory Holding Cost percentage (default 12%).
# TotalInventoryPrice
Applicable Algorithms: NO
Description:
- Total Inventory Price is equal to the sum of the Total Inventory Price of each Product in each Site.
- The Total Inventory Price of a single Product is equal to the Total Inventory quantity multiplied by Product Price.
# TotalInventoryValue
Applicable Algorithms: NO
Description:
- Total Inventory Value is equal to the sum of the Total Inventory Value of each Product in each Site.
- The Total Inventory Value of a single Product is equal to the Total Inventory Quantity multiplied by Product Value.
# Co2
Applicable Algorithms: NO
Description:
- Indicates the amount of CO2 emitted by storing the Product.
# TotalInventoryWeight
Applicable Algorithms: NO
Description:
- Total Inventory Weight is equal to the sum of the Total Inventory Weight of each Product in each Site.
- The Total Inventory Weight of a single Product is equal to the Total Inventory Quantity multiplied by Product Weight.
# TotalInventoryVolume
Applicable Algorithms: NO
Description: Total Inventory Volume is equal to the sum of the Total Inventory Volume of each Product in each Site.
- The Total Inventory Volume of a single Product is equal to the Total Inventory Quantity multiplied by Product Volume.
# WipHoldingCost
Applicable Algorithms: NO
Description:
- Work in Progress Inventory Holding Cost is the Inventory Holding Cost of the Product Quantity that is in production and unavailable.
- For a single Product, its Inventory Holding Cost is equal to the Work In Progress Inventory quantity multiplied by the Product Value, multiplied by the Inventory Holding Cost percentage (default 12%).
# OutputFlow
# Scenario
Applicable Algorithms: NO
Description:
- Indicates the scenario name of this transportation flow.
# PeriodName
Applicable Algorithms: NO
Description:
- Indicates the PeriodName of this transportation flow.
# ArrivingPeriodName
Applicable Algorithms: NO
Description:
- PeriodName when the transport arrives
# SourceName
Applicable Algorithms: NO
Description:
- Indicates the Source SiteName of this transportation flow.
# SiteName
Applicable Algorithms: NO
Description:
- Indicates the Destination SiteName of this transportation flow.
# SiteType
Applicable Algorithms: NO
Description:
- Indicates whether the destination SiteType is Customer or Facility.
# ProductName
Applicable Algorithms: NO
Description:
- Indicates the ProductName of this transportation flow.
# ModeName
Applicable Algorithms: NO
Description:
- Indicates the ModeName of this transportation flow.
# FlowUnits
Applicable Algorithms: NO
Description:
- Indicates the flow units of this transportation flow.
# FlowCubic
Applicable Algorithms: NO
Description:
- Indicates the flow volume of this transportation flow.
# FlowWeight
Applicable Algorithms: NO
Description:
- Indicates the flow weight of this transportation flow.
# TotalFlowValue
Applicable Algorithms: NO
Description: Indicates the total Value of the transport Product.
# TotalFlowPrice
Applicable Algorithms: NO
Description:
- Indicates the total Price of the transport Product.
# InboundWarehousingCost
Applicable Algorithms: NO
Description:
- Indicates the total inbound cost of shipping the Product to the Destination Site. This cost is calculated by multiplying the flow units by the Variable Inbound Cost of the Destination Site.
# OutboundWarehousingCost
Applicable Algorithms: NO
Description:
- Indicates the total outbound cost of shipping the Product from the Source Site. This cost is calculated by multiplying the flow units by the Variable Oubound Cost of the Source Site.
# TotalTransportationCost
Applicable Algorithms: NO
Description:
- Indicates the Total Cost of using this Route to transport the Product. - Equels to the variable transportation cost plus fixed transportation cost
# VariableTransportationCost
Applicable Algorithms: NO
Description:
- Indicates the total Variable Transportation Cost generated on the Shipment Lane in the network optimization results. The Variable Transportation Cost is affected by the Variable Transportation Cost parameters in the Transportation Policy input table.
# FixedShipmentCost
Applicable Algorithms: NO
Description:
- Indicates the Fixed Shipment Cost generated on the Lane in the network optimization results. Shipment Cost is affected by the Fixed Shipment Cost and Shipment Size parameters in the Transportation Policy input table.
# NumShipments
Applicable Algorithms: NO
Description:
- Indicates the number of shipment batches corresponding to the shipping volume on this Route. The number of batches is affected by the Shipment Size in the Transportation Policy input table.
# SourcingCost
Applicable Algorithms: NO
Description:
- Indicates the cost of sourcing Product from source Site to destination site. This cost is calculated by multiplying the flow units by the Unit Sourcing Cost and in the sourcing policy table.
# DaysBetweenReplenishment
Applicable Algorithms: NO
Description:
- Days Between Replenishment for Inventory Optimization.
- Days Between Replenishment equals to the input number in transportation policy table.
# CycleStock
Applicable Algorithms: NO
Description: Indicates the Cycle Stock allocated for transportation between Sites. - Cycle stock = 1/2\flow units\ * days between replenishment/period length
# InTransitInventory
Applicable Algorithms: NO
Description:
- Indicates Product Qty that cannot be used due to transportation.
- In Transit Inv = Flow Qty\Transport Time/Period length.
- E.g. In one year, the ocean shipping Lane from Shanghai to Guangzhou has a total cargo volume of 100 tons, and the Transport Time is 12 days, then In Transit Inv=100\ * 12/365=3.29 tons.
# InTransitInventoryHoldingCost
Applicable Algorithms: NO
Description:
- Indicates the holding cost of In Transit Inv caused by the inability to use due to transportation.
- For specific meaning, please refer to Input-Inventory Holding Cost.
- In transit Inventory Holding Cost = In Transit Inv\Product Value\ * Inventory Holding Percentage\ * Period length/365.
- Eg In one year, the ocean shipping Lane from Shanghai to Guangzhou transports 100 tons of A Product, and the Transport Time is 12 days, then In Transit Inv=100\ * 12/365=3.29 tons. If the A Product Value per ton is 20 yuan, and the inventory holding percentage is 12%, then the in transit Inventory Holding Cost = 3.29\ * 20*12%*365/365=7.9 yuan.
# InTransitInvOwnership
Applicable Algorithms: NO
Description:
- Indicates whether the owenership of the in-transit inventory generated on this route belongs to the Source Site or the Destination Site. The result of this field is affected by the setting of the InTransitInvOwnership field in the Transportation Policy input table.
# ServiceDistance
Applicable Algorithms: NO
Description:
- Indicates the service distance of this transportation flow.
- If transport Distance is filled in transportation policy, equals to this Distance.
- If transport Distance is left blank in transportation policy, it is calculated based on the spherical Distance from Source Site to Destination Site multiply extra Circuity Factor defined in model option.
# Co2
Applicable Algorithms: NO
Description:
- Indicates the amount of CO2 generated by transporting the Product
# ServiceHour
Applicable Algorithms: NO
Description:
- Indicates the service time of this transportation flow.
- if transport time is filled in transportation policy, equals to the this transportation time \ * 24 hour
- if transport time is left blank in transportation policy, Calculated based on the service distance and the default driving speed in the model option, which is equal to service distance/default driving speed(KM/hour).
# OutputProduction
# Scenario
Applicable Algorithms: NO
Description:
- Indicates the scenario for which the production flow occurs.
# PeriodName
Applicable Algorithms: NO
Description:
- Indicates the Period in which production flow occurs.
# ArrivingPeriodName
Applicable Algorithms: NO
Description:
- Period Name when production is completed.
# SiteName
Applicable Algorithms: NO
Description:
- Indicates the Site where the production flow occurs.
# ProductName
Applicable Algorithms: NO
Description:
- Indicates the Product in the production flow.
# TotalProductionCost
Applicable Algorithms: NO
Description:
- Indicates the Total Cost of producing the Product in the Site during the Period.
- Equal to Production Policy Cost + Production Process Cost + BOM Cost
# ProductionQuantity
Applicable Algorithms: NO
Description:
- Indicates the Quantity of the product produced by the Site in the Period.
# ProductionCubic
Applicable Algorithms: NO
Description:
- Indicates the Volume of products produced by the Site in the Period.
# ProductionWeight
Applicable Algorithms: NO
Description: Indicates the Weight of the product produced by the Site in the Period.
# ProductionPolicyCost
Applicable Algorithms: NO
Description:
- Indicates the Production Policy related costs incurred by the Site in producing the Product during the Period.
- Calculated by multiplying the Unit Production Cost in the Production Policy Table by the Production Quantity.
# ProductionProcessCost
Applicable Algorithms: NO
Description:
- Indicates the Production Process related costs incurred by the Site in producing the product during the Period.
- Calculated by multiplying the variable production process step cost of each process step in the production process table by the production Quantity, in addition to the production lots multiplied by the fixed lot cost.
- The production process cost is equal to the sum of the production costs of each process step of each production line in a Site.
# WorkResourceCost
Applicable Algorithms: NO
Description:
- Indicates the total Work Resource cost corresponding to the production record in the network optimization result.
# WorkCenterCost
Applicable Algorithms: NO
Description:
- Indicates the total cost of the Work Center corresponding to the production record in the network optimization result.
# ByproductProductionQuantity
Applicable Algorithms: NO
Description:
- Indicates the Quantity of the byproducts produced by the Site in the Period.
# BillOfMaterialsCost
Applicable Algorithms: NO
Description:
- Indicates the Total Cost of the BOM used by the Site to produce the Product in the Period.
- Calculated based on the Unit BOM Cost\Production Qty of the BOM assigned.
# FixedProductionTime
Applicable Algorithms: NO
Description:
- Indicates the Fixed Production Time corresponding to the production record in the network optimization result. The Fixed Production Time result is affected by the Production Lot Size and Fixed Production Time in the Production Policy input table.
# Co2
Applicable Algorithms: NO
Description:
- Indicates the amount of CO2 emitted in producing the Product.
# OutputProductionProcess
# Scenario
Applicable Algorithms: NO
Description:
- Indicates the scenario for which the production process flow occurs.
# PeriodName
Applicable Algorithms: NO
Description:
- Indicates the Period in which production process flow occurs.
# ProcessName
Applicable Algorithms: NO
Description:
- Indicates the Process Name where the production occurs.
# SiteName
Applicable Algorithms: NO
Description:
- Indicates the Site where the production process flow occurs.
# ProductName
Applicable Algorithms: NO
Description:
- Indicates the Product in the production process flow.
# ProcessStep
Applicable Algorithms: NO
Description:
- Indicates the Step Name of the production process step where the production process occurs.
# StepSequence
Applicable Algorithms: NO
Description:
- Indicates the Step ID of the production process step where the production process occurs.
# WorkCenter
Applicable Algorithms: NO
Description:
- Indicates the Work Center used by the production process flow.
# WorkResource
Applicable Algorithms: NO
Description:
- Indicates the Production Resources used by the Production Process.
# FlowUnits
Applicable Algorithms: NO
Description:
- Indicates the product quantity produced in the production process.
# FlowWeight
Applicable Algorithms: NO
Description:
- Indicates the product weight produced in the production process.
# FlowCubic
Applicable Algorithms: NO
Description:
- Indicates the product volume produced in the production process.
# FlowCost
Applicable Algorithms: NO
Description:
- Indicates the production process flow cost incurred by the production process.
- Calculation formula: Flow Cost = Total Flow Quantity \ * Unit production process cost
# SetupCost
Applicable Algorithms: NO
Description:
- Indicates the fixed cost of each production step for each batch produced in the production process.
- Calculation formula: Setup Cost = (Total FlowQty\Fixed Lot Setup Cost set in the production process table)/batch size
# TotalCost
Applicable Algorithms: NO
Description:
- Indicates the Total Cost in the production process (including variable cost and fixed cost).
- Total Cost = Flow Cost + Setup Cost + Production Lot Cost
# ProcessTime
Applicable Algorithms: NO
Description:
- Indicates the time that the Work Center is used to produce the production process of the Product.
# ChangeoverTime
Applicable Algorithms: NO
Description:
- Indicates the Total Time for production changeover after each batch produced in the Production Process step.
# WorkResourceHour
Applicable Algorithms: NO
Description:
- Indicates the time when the production resources used by the production process.
# WorkResourceCost
Applicable Algorithms: NO
Description:
- Indicates the total cost of Work Resource conducting this production process in the network optimization result.
# WorkCenterCost
Applicable Algorithms: NO
Description:
- Indicates the total cost of the Work Center conducting this Production Process in the network optimization result.
# Co2
Applicable Algorithms: NO
Description:
- Indicates the amount of CO2 emitted in the production process.
# OutputBOM
# Scenario
Applicable Algorithms: NO
Description:
- Indicates the scenario name of this Bom flow.
# PeriodName
Applicable Algorithms: NO
Description:
- Indicates the Period name of this Bom flow.
# SiteName
Applicable Algorithms: NO
Description:
- Indicates the production SiteName of this Bom flow.
# ProductName
Applicable Algorithms: NO
Description:
- Indicates the finished ProductName in this Bom flow.
# BomName
Applicable Algorithms: NO
Description:
- Indicates the BOM name used in this Bom flow.
# BomProductName
Applicable Algorithms: NO
Description:
- Indicates the Bom ProductName(component or byproduct) used in this Bom flow.
# BomProductType
Applicable Algorithms: NO
Description:
- Indicates the Type of the finished product in this Bom flow. Component or Byproduct.
# BillOfMaterialsCost
Applicable Algorithms: NO
Description:
- Indicates the cost of using this Bom.
- is equal to the flow units produced by this Bom multiplied by the Unit Bom Cost in the Bom table.
# FlowUnits
Applicable Algorithms: NO
Description:
- Indicates the flow units of the component or byproduct used to produce the final Product.
# FlowCubic
Applicable Algorithms: NO
Description:
- Indicates the flow volume of the component or byproduct used to produce the final Product.
# FlowWeight
Applicable Algorithms: NO
Description:
- Indicates the flow weight of the component or byproduct used to produce the final Product.
# Co2
Applicable Algorithms: NO
Description:
- Indicates the amount of CO2 generated in producing the final Product.
# OutputGreenFieldFlow
# Scenario
Applicable Algorithms: GF
Description:
- Indicates the scenario of this greenfield flow.
# SourceName
Applicable Algorithms: GF
Description:
- Indicates the source site of this greenfield flow.
# CustomerName
Applicable Algorithms: GF
Description:
- Indicates the site served by the source site of this greenfield flow.
# Distance
Applicable Algorithms: GF
Description:
- Indicates the distance from the source site to the destination site in this greenfield flow.
# FlowUnits
Applicable Algorithms: GF
Description:
- Indicates the flow units from the source site to the destination site in this greenfield flow.
# FlowsTimesDistance
Applicable Algorithms: GF
Description:
- Indicates the flow units multiply by service distance from the source site group to the destination site in this greenfield flow.
# OutputInventoryPolicyDetail
# Scenario
Applicable Algorithms: SSO
Description:
- Indicates the scenario of the Safety Stock Optimization Detail output.
# SourceName
Applicable Algorithms: SSO
Description:
- Indicates the upstream Site Name of the Safety Stock Optimization Detail output.
# SiteName
Applicable Algorithms: SSO
Description:
- Indicates the Site Name of the Safety Stock Optimization Detail output.
# SourceProduct
Applicable Algorithms: SSO
Description:
- Indicates the upstream Product Name of the Safety Stock Optimization Detail output.
# ProductName
Applicable Algorithms: SSO
Description:
- Indicates the Product Name of the Safety Stock Optimization Detail output.
# ModeName
Applicable Algorithms: SSO
Description:
- Indicates the Mode Name or production Mode Name of the Safety Stock Optimization Detail output.
# ServiceTime
Applicable Algorithms: SSO
Description:
- Indicates the preparation time allowed after the Site receives the Order. For customer-facing Sites, this parameter defaults to 0, which means that once the customer places an order, the Site must to have enough inventory to fulfill the order immediately.
# OutputSimCustomerOrderSummary
# Scenario
Applicable Algorithms: SIM
Description:
- Indicates ScenarioName.
# OrderId
Applicable Algorithms: SIM
Description:
- Indicates the order number.
- Multiple order line numbers are allowed under the same order number.
# OrderlineId
Applicable Algorithms: SIM
Description:
- Indicates the order line number.
- Multiple order line numbers can correspond to the same order.
- The order number is differentiated by product.
# CustomerName
Applicable Algorithms: SIM
Description:
- indicates CustomerName.
- CustomerName corresponds to “Cutomer” of SiteType in Site table.
# ProductName
Applicable Algorithms: SIM
Description:
- Indicates Product Name.
- Product Name corresponds to the Product table.
# OrderDate
Applicable Algorithms: SIM
Description:
- Indicates the date the order was placed.
# DueDate
Applicable Algorithms: SIM
Description:
- Indicates the deadline for Orders to be completed.
# CompleteDate
Applicable Algorithms: SIM
Description:
- Indicates the Date when the Order was completed.
# OrderQuantity
Applicable Algorithms: SIM
Description:
- Indicates the quantity of statistics in terms of order number.
# FilledQuantity
Applicable Algorithms: SIM
Description:
- Indicates Product quantity that has been shipped by the OrderDate.
# ServicedOnTime
Applicable Algorithms: SIM
Description:
- Whether the order is satisfied within the Max Service Time.
# OutputSimTransactionDetails
# Scenario
Applicable Algorithms: SIM
Description:
- Indicates ScenarioName.
# TransactionType
Applicable Algorithms: SIM
Description:
- Indicates the transaction type to which the event belongs.
- The type information describes the classification of the transaction order, such as replenishment or transportation.
# OrderId
Applicable Algorithms: SIM
Description:
- Indicates the Customer Order number corresponding to the event.
- If the input is empty, the Customer Order number is the sequence number created by the system in chronological order.
# OriginalOrderlineId
Applicable Algorithms: SIM
Description:
- Indicates the name of the original input of the transaction corresponding to the event.
# OrderlineId
Applicable Algorithms: SIM
Description:
- Indicates the order line number of the completed transaction corresponding to the event.
- If the input is empty, the order line number is a sequence number created by the system in chronological order.
# OrderDate
Applicable Algorithms: SIM
Description:
- Indicates the order time.
# CompleteDate
Applicable Algorithms: SIM
Description:
- Indicates the transaction event Complete Date.
# SourceName
Applicable Algorithms: SIM
Description:
- Indicates the originating SiteName of the transaction order.
- SiteName corresponds to the non-customer Type data in the Site table.
# SiteName
Applicable Algorithms: SIM
Description:
- Indicates the destination SiteName of the transaction.
- SitepName corresponds to the Site table.
# ProductName
Applicable Algorithms: SIM
Description:
- Indicates Product Name.
- Product Name corresponds to the Product table.
# ModeName
Applicable Algorithms: SIM
Description:
- Indicates the Mode Name of the transaction corresponding to the event completed.
# OrderQuantity
Applicable Algorithms: SIM
Description:
- Indicates the NameQty corresponding to the event.
# OrderWeight
Applicable Algorithms: SIM
Description:
- Indicates the OrderWeight of the transaction completed corresponding to the event.
# OrderVolume
Applicable Algorithms: SIM
Description:
- Indicates the OrderVolume for which the transaction corresponding to the event is completed.
# FilledQuantity
Applicable Algorithms: SIM
Description:
- Indicates the Product quantity of the transaction corresponding to the event completed.
# TotalCost
Applicable Algorithms: SIM
Description:
- Indicates the Total Cost incurred by the event.
# TransactionDetail
Applicable Algorithms: SIM
Description:
- Indicates the Transaction Detail to which the event belongs.
- The details describe the object of the transaction service, such as a site or a customer.
# ServicedOnTime
Applicable Algorithms: SIM
Description:
- Whether the Name is satisfied within the Max Service Time
# OutputSimInventorySnapshot
# Scenario
Applicable Algorithms: SIM
Description:
- Indicates the scenario used to generate summary data.
# SiteName
Applicable Algorithms: SIM
Description:
- Indicates the simulated site object, including factories and warehouses of all levels
# ProductName
Applicable Algorithms: SIM
Description:
- Indicates the product used for simulation calculations.
# SnapshotDate
Applicable Algorithms: SIM
Description:
- Indicates the event time related to inventory changes during the simulation period.
# OnHandQuantity
Applicable Algorithms: SIM
Description:
- Indicates the quantity of products in stock at the site.
- Applicable to factory and warehouse sites.
# OnHandValue
Applicable Algorithms: SIM
Description:
- Indicates the total value of products in stock at the site.
- The total value is calculated by multiplying product quantity by the unit product value.
- Applicable to facility-type sites.
# OrderedQuantity
Applicable Algorithms: SIM
Description:
- Indicates the quantity of products ordered by the site from upstream
# InTransitQuantity
Applicable Algorithms: SIM
Description:
- Indicates the quantity of products that have been shipped from upstream factories/warehouses but are still in transit.
# WipStock
Applicable Algorithms: SIM
Description:
- Indicates the quantity of products for which production orders have been issued but production is not yet complete.
- Applicable to factory sites with production strategies configured.
# BookedQuantity
Applicable Algorithms: SIM
Description:
- Indicates the quantity of downstream orders not yet shipped by the current site.
# AverageInventoryAge
Applicable Algorithms: SIM
Description:
- For each product in stock as of the snapshot date, calculates the average time from production completion at the factory to the snapshot date.
- Batch quantities are used as weights for products in different batches.
- Time is measured in days.
# OutputNetworkPathDetail
# Scenario
Applicable Algorithms: NO
Description:
- Indicates the scenario for which summary data is generated.
# EndId
Applicable Algorithms: NO
Description:
- Indicates the sequence ID of the endpoint in an end-to-end network path.
# TrackingId
Applicable Algorithms: NO
Description:
- Indicates the sequence of loading sites in the end-to-end route, starting from the endpoint and tracing back to the origin. For example, the starting site of the first segment has a tracking ID of 1, the second segment has a tracking ID of 2, and so on.
# Lane
Applicable Algorithms: NO
Description:
- In the Network Path analysis results, the ID is a randomly assigned key to this end-to-end Path.
# SourceName
Applicable Algorithms: NO
Description:
- Indicates the starting site's name for the segmented transport route.
# StartProduct
Applicable Algorithms: NO
Description:
- Indicates the initial status of the product, such as raw materials or finished goods.
# StartPeriod
Applicable Algorithms: NO
Description: -Indicates the start period of the segmented transport route.
# ModeName
Applicable Algorithms: NO
Description:
- Indicates the transportation mode for the segmented route. If the start and end sites are the same production plant, the mode is 'Direct_Production'.
# SiteName
Applicable Algorithms: NO
Description:
- Indicates the endpoint name of the segmented transport route.
# EndProduct
Applicable Algorithms: NO
Description:
- Indicates the product at the endpoint of the segmented transport route.
# EndPeriod
Applicable Algorithms: NO
Description:
- Indicates the end period of the segmented transport Route.
# EndSite
Applicable Algorithms: NO
Description:
- Indicates the final endpoint of the entire end-to-end route.
# Quantity
Applicable Algorithms: NO
Description:
- Indicates the quantity of products transported on this segmented transport route.
# OperatingCost
Applicable Algorithms: NO
Description:
- Indicates the total cost incurred in maintaining the normal operation of site groups and work centers on this segmented transport route.
- Total fixed operating cost = Total operating cost from the network site group summary + Total operating cost from the network work center summary.
# SourcingCost
Applicable Algorithms: NO
Description:
- Indicates the sourcing cost of products at the starting site of this segmented transport route.
- It is calculated by multiplying the sourcing quantity by the variable sourcing cost and cost basis (e.g., distance, quantity, weight) from the sourcing policy input table.
# TransportationCost
Applicable Algorithms: NO
Description:
- Indicates the transportation cost incurred for transporting products on this segmented transport route.
- It is composed of the traffic quantity, variable transportation costs, and cost basis (e.g., distance, quantity, weight) from the transportation policy input table.
# InboundWarehousingCost
Applicable Algorithms: NO
Description:
- Indicates the inbound warehousing cost for this segmented transport route.
# OutboundWarehousingCost
Applicable Algorithms: NO
Description:
- Indicates outbound warehousing cost for the segmented transport route.
# ProductionCost
Applicable Algorithms: NO
Description:
- Indicates the production cost of products at the site in this segmented transport route.
# InvCarryingCostPct
Applicable Algorithms: NO
Description: Indicates the total inventory holding cost at the site for this segmented transport route, including capital cost and storage cost. Capital cost = Inventory quantity × Product value × Holding cost percentage × Inventory duration. Storage cost = Variable storage cost (from the inventory policy table) × Inventory quantity.
# PreBuildInventoryCost
Applicable Algorithms: NO
Description:
- Indicates the pre-build inventory cost for products at the site on this segmented transport route.
- Pre-build inventory cost = Pre-build inventory quantity × Unit cost × Inventory holding cost (default 12%).
# TurnEstimatedInventoryCost
Applicable Algorithms: NO
Description:
- Turn estimated inventory cost = Turn estimated inventory quantity × (Unit product value × Inventory holding cost (default 12%) + Unit storage cost).
- If the inventory turns is entered in the inventory policy table, turn estimated inventory quantity= Total outbound quantity ÷ Inventory turns
# WipHoldingCost
Applicable Algorithms: NO
Description:
- Indicates the inventory holding cost of work-in-progress (WIP) products that are unavailable for use at the site on this segmented transport route.
- WIP holding cost = WIP inventory quantity × Unit product value × Inventory holding cost (default 12%).
# InTransitInventoryHoldingCost
Applicable Algorithms: NO
Description:
- Indicates the inventory holding cost of products in transit that cannot be used on this segmented transport route.
- In-transit inventory holding cost = In-transit inventory quantity × Unit product value × Inventory holding cost (default 12%).
# CycleStockCost
Applicable Algorithms: NO
Description:
- Indicates the cycle stock cost reserved at the site on this segmented transport route to meet daily demand.
- Cycle stock cost = Cycle stock quantity × Unit product value × Inventory holding cost (default 12%).
# Distance
Applicable Algorithms: NO
Description:
- Indicates the distance of the segmented route in the optimized network model.
# LeadTime
Applicable Algorithms: NO
Description:
- Indicates the lead time (in days) for the segmented route in the optimized network model.
# OutputSimInTransitInventorySnapshot
# Scenario
Applicable Algorithms: SIM
Description:
- ScenarioName related to simulation event simulation
# SourceName
Applicable Algorithms: SIM
Description:
- SourceName related to simulation event simulation
# SiteName
Applicable Algorithms: SIM
Description:
- SiteName related to simulation event simulation
# ModeName
Applicable Algorithms: SIM
Description:
- Transportation mode associated with the simulation of the simulation event
# ProductName
Applicable Algorithms: SIM
Description:
- Product GroupName related to simulation event simulation
# SnapshotDate
Applicable Algorithms: SIM
Description:
- Time when the simulation event occurs
# Quantity
Applicable Algorithms: SIM
Description:
- Output the quantity of In Transit Inv in the Lane-Product dimension in the entire simulation period
- In Transit Inv refers to the Product quantity that has been sent from the Start Site but has not yet arrived at the destination Site
- In Transit Inv quantity= the total quantity of the Product in the In Transit Inv Status
# Weight
Applicable Algorithms: SIM
Description:
- Output the Weight of In Transit Inv in the Lane-Product Group-Mode Name dimension in the entire simulation Period
- Price of In Transit Inv = Qty of Product Group In Transit Inv × Weight of Product Group
- Product GroupWeight is input from the Product Group table
# Volume
Applicable Algorithms: SIM
Description:
- Output the Volume of In Transit Inv in the Lane-Product Group-Mode Name dimension in the entire simulation Period
- Volume of In Transit Inv = Qty of Product GroupIn Transit Inv × Volume of Product Group
- Product GroupVolume is input from the Product Group table
# Value
Applicable Algorithms: SIM
Description:
- Output the In Transit Inv Value of the Lane-Product Group-Mode Name dimension in the entire simulation Period
- In Transit Inv Price = Product GroupIn Transit Inv Qty × Product Group Value
- Product Group Value is input from the Product Group table
# Price
Applicable Algorithms: SIM
Description:
- Output the Price of In Transit Inv in the lane-product dimension in the entire simulation Period
- Price of In Transit Inv = quantity of Product Transit Inv * Price of Product
- Product Price is input from the Product table
# NumShipment
Applicable Algorithms: SIM
Description:
- Output the number of order lines in the lane-product dimension over the entire simulation cycle
- The number of order lines is the number of products in the simulation cycle after de-duplication.
# OutputShipmentAssignment
# Scenario
Applicable Algorithms: OA
Description:
- Indicates the Scenario where the optimization model data is located.
# OrderId
Applicable Algorithms: OA
Description:
- Indicates the number of the order defined in the transport order table.
# ShippingDate
Applicable Algorithms: OA
Description:
- Indicates the source site shipment time.
# OrderDate
Applicable Algorithms: OA
Description:
- Indicates the date the order was placed.
# SourceName
Applicable Algorithms: OA
Description:
- Indicates the source site of order.
# CustomerName
Applicable Algorithms: OA
Description:
- Indicates the destination of the order.
# ProductName
Applicable Algorithms: OA
Description:
- Indicates the Product required by order.
# LaneName
Applicable Algorithms: OA
Description:
- Indicates the Lane to which the order is assigned.
# Quantity
Applicable Algorithms: OA
Description:
- Indicates the Product quantity of the Name.
# Weight
Applicable Algorithms: OA
Description:
- Indicates the Product Weight of the Name.
# Volume
Applicable Algorithms: OA
Description:
- Indicates the Product Volume of the Name.
# Value
Applicable Algorithms: OA
Description:
- Indicates the Value of the order.
# HoldingCost
Applicable Algorithms: OA
Description:
- Indicates the Holding Cost for Name shipped later than NameDate.
- is equal to (Shipping Date-NameDate) * Daily Unit Holding Cost(day).
# IsLate
Applicable Algorithms: OA
Description:
- Indicates whether the Name is shipped later than the Latest Delivery Date.
# OutputNetworkCustomerShipments
# Scenario
Applicable Algorithms: NO
Description:
- Indicates the aggregated ScenarioName.
# CustomerName
Applicable Algorithms: NO
Description:
- Indicates the aggregated SiteName.
# ProductName
Applicable Algorithms: NO
Description:
- Indicates the aggregated ProductName.
# ArrivingPeriodName
Applicable Algorithms: NO
Description:
- Indicates the aggregated shipment arrival period, where demand may be requested in the first cycle but actually shipped in the second period.
# DemandPeriodName
Applicable Algorithms: NO
Description:
- Indicates the aggregated demand Period.
# ShipmentQuantity
Applicable Algorithms: NO
Description:
- Indicates the quantity of customer and product demand within a Demand Period for a single Scenario that is fulfilled within the Delivery Arrival Period.
# LostSalesPenaltyCost
Applicable Algorithms: NO
Description:
- Indicates the Lost Sales Penalty Cost caused by the unsatisfied demand of the Site and Product in the Demand Period under a single Scenario within all the delivery arrival periods.
# DemandQuantity
Applicable Algorithms: NO
Description:
- Indicates the total demand of Site and Product in the demand Period under a single Scenario.
- If demand is partially deferred, the Customer-Product combination will appear across multiple rows with Arriving Periods, while the total demand quantity remains consistent.
# PenaltyCost
Applicable Algorithms: NO
Description:
- Indicates the Penalty Cost caused by delayed shipments for the customer and product demand within a demand period under a single Scenario during the shipment arrival period.
# Data Validation
# OutputDataValidation
# TableName
Applicable Algorithms: All
Description:
- Indicates the table where information does not match after cross-table verification.
# ColumnName
Applicable Algorithms: All
Description:
- Indicates the ColumnName whose information in the table does not match after cross-table verification.
# ColumnValue
Applicable Algorithms: All
Description:
- Indicates the original input value of the column whose information in the table does not match after cross-table verification, which is convenient for directly locating the cell to correct it.
# ValidationDate
Applicable Algorithms: All
Description:
- Indicates the running date of cross-table verification.
# Infeasible Analysis
# OutputInfeasibilityDiagnosis
# Scenario
Applicable Algorithms: All
Description:
- The name of the scenario which conducted the Infeasibility Diagnosis.
# GroupId
Applicable Algorithms: All
Description:
- Indicates a constraint group that causes the model to be infeasible, for example, "CZ1-PERIOD1-DC1-PRODUCT-LTL".
# Description
Applicable Algorithms: All
Description:
- Indicates the Constraint Group which makes the model infeasible(e.g. Production Constraint).
# ConstraintValue
Applicable Algorithms: All
Description:
- Indicates the constraint value set for the constraint group that causes the model to be infeasible.
# SuggestValue
Applicable Algorithms: All
Description: None
# Details
# OutputToBaselineOutputShipment
# Scenario
Applicable Algorithms: TO
Description: Not effective
# BaselineSolution
Applicable Algorithms: TO
Description: Not effective
# ShipmentName
Applicable Algorithms: TO
Description:
- Shippment Name based on the OutputToBaselineOutputShipment after running the "Shippmeng Constraints"
# Route
Applicable Algorithms: TO
Description:
- Route Name in the baseline transport result after running based on "Shippmeng Constraints"
# RouteStartDate
Applicable Algorithms: TO
Description:
- Route Start Date Time in the OutputToBaselineOutputShipment after running based on "Shippmeng Constraints"
# PickupSequence
Applicable Algorithms: TO
Description:
- Pickup Sequence Id in the OutputToBaselineOutputShipment after running the "Shippmeng Constraints"
# DeliverySequence
Applicable Algorithms: TO
Description:
- Delivery Sequence Id in the OutputToBaselineOutputShipment after running the "Shippmeng Constraints"
# AssetName
Applicable Algorithms: TO
Description:
- AssetName in the OutputToBaselineOutputShipment after running the "Shippmeng Constraints"
# AssetDomicile
Applicable Algorithms: TO
Description:
- Asset Domicile in the OutputToBaselineOutputShipment after running the "Shippmeng Constraints"
# AssetTour
Applicable Algorithms: TO
Description: Not effective
# RouteSequence
Applicable Algorithms: TO
Description: Not effective
# ForceShipDirect
Applicable Algorithms: TO
Description: Not effective
# LinehaulRoute
Applicable Algorithms: TO
Description: Not effective
# Hub
Applicable Algorithms: TO
Description: Not effective
# PickupLocation
Applicable Algorithms: TO
Description: Not effective
# DeliveryLocation
Applicable Algorithms: TO
Description: Not effective
# ScenarioId
Applicable Algorithms: TO
Description: Not effective
# OutputToShipmentOutput
# Scenario
Applicable Algorithms: TO
Description:
- Indicates the Scenario where the optimization model data is located.
# ShipmentName
Applicable Algorithms: TO
Description:
- Indicate the order number filled in the shipment table.
# ProductName
Applicable Algorithms: TO
Description:
- Indicate the Product Name filled in the shipment table.
# SourceName
Applicable Algorithms: TO
Description:
- Indicate the Source Name filled in the shipment table.
# SiteName
Applicable Algorithms: TO
Description:
- Indicate the Customer Name filled in the shipment table.
# Weight
Applicable Algorithms: TO
Description:
- Indicate the order weight that should be filled in the shipment table corresponding to this order. If it is not filled in the shipment table, the result calculated automatically by the model will be displayed. The model calculates this result by using the quantity and product name filled inshipment table in combination with the weight field in the product table.
# Volume
Applicable Algorithms: TO
Description:
- Indicate the order volume that should be filled in the shipment table corresponding to this order. If it is not filled in the shipment table, the result calculated automatically by the model will be displayed. The model calculates this result by using the quantity and product name filled inshipment table in combination with the volume field in the product table.
# Quantity
Applicable Algorithms: TO
Description:
- Indicate the order quantity filled in the shipment table corresponding to this order.
# Status
Applicable Algorithms: TO
Description: Indicates the order allocation status, including Routed and Unrouted. Routed means assigned, and Unrouted means unassigned.
- Unassigned orders are listed in the Unrouted shipments Table.
# Comment
Applicable Algorithms: TO
Description:
- Unrouted Reasons include “Direct shipping is cost saving” and “All feasible assets are used”. The former means that direct shipping of the Name can save Total Cost, and the latter means that the order cannot be shipped due to limited transportation resources (Asset Id).
# PickupTime
Applicable Algorithms: TO
Description:
- Indicates the time when the order starts loading.
# DeliveryTime
Applicable Algorithms: TO
Description:
- Indicates the time when the order starts unloading.
# EarliestPickupTime
Applicable Algorithms: TO
Description:
- Indicates the Earliest Pickup Date corresponding to the order loading at the Start Site, which comes from the Earliest Pickup Date in the input shipment table.
# LatestPickupTime
Applicable Algorithms: TO
Description:
- Indicates the Latest Pickup Date corresponding to the Name loading at the Start Site, which comes from the Latest Pickup Date in the input table transport Name.
# EarliestDeliveryTime
Applicable Algorithms: TO
Description:
- Indicates the earliest unloading time corresponding to order unloading at Site (End Site), which comes from the earliest unloading date in the input shipment table.
# LatestDeliveryTime
Applicable Algorithms: TO
Description: Indicates the latest unloading time corresponding to the unloading of order at Site (End Site), which comes from the latest unloading date in the input shipment table.
# Route
Applicable Algorithms: TO
Description:
- Indicates the name of the transport route ID that carries the order.
# RouteStartDate
Applicable Algorithms: TO
Description:
- Indicates the time when the transport Route Id carrying the orderstarts.
# PickupSequence
Applicable Algorithms: TO
Description:
- Indicates the order of the loading point of the order in the transport Route Id. The sequence is: starting from the departure point of the Route Id, the departure point is 1, the second stop is 2, and so on.
# DeliverySequence
Applicable Algorithms: TO
Description:
- Indicates the order of the unloading place of the Name in the transport Route Id. The sequence is: starting from the departure point of the Route Id, the departure point is 1, the second stop is 2, and so on.
# AssetId
Applicable Algorithms: TO
Description:
- Indicates the Asset ID that carries this order.
# AssetName
Applicable Algorithms: TO
Description:
- Indicates the AssetName that carries this Order.
# AssetDomicile
Applicable Algorithms: TO
Description:
- Indicates the LocationSite to which the Asset Id carrying this order belongs.
# RouteSequence
Applicable Algorithms: TO
Description:
- Indicates the sequence of the Route ID carrying the order among the multiple Route IDs transported by the Asset Id.
# Hub
Applicable Algorithms: TO
Description:
- Takes effect in the Hub Used function, indicating the Hub UsedName that the Name passes through.
# DirectShippingCost
Applicable Algorithms: TO
Description: Indicates the cost required for direct delivery of the Name, i.e. the Direct Shipment Cost filled in the Transport Name table.
# ServiceDays
Applicable Algorithms: TO
Description:
- If the earliest loading time of the Name in the shipment table is not empty, Service Days refers to the time required from the earliest loading time of the order to the actual start of unloading time, in days.
# PvrpVisitSequenceId
Applicable Algorithms: TO
Description:
- Not yet effective.
# DecompositionId
Applicable Algorithms: TO
Description:
- Not yet effective.
# ScenarioId
Applicable Algorithms: TO
Description:
- The scenario numbers within the model have no actual meaning.
# OutputToDeliveredShipments
# Scenario
Applicable Algorithms: TO
Description:
- Indicates the Scenario where the optimization model data is located.
# ShipmentName
Applicable Algorithms: TO
Description:
- Corresponding to the order number filled in the shipment table.
# Route
Applicable Algorithms: TO
Description:
- Indicates the name of the transport route ID that carries the name.
# PickupTime
Applicable Algorithms: TO
Description:
- Indicates the time when the Name starts loading.
# DeliveryTime
Applicable Algorithms: TO
Description:
- Indicates the time when the Name starts unloading.
# Weight
Applicable Algorithms: TO
Description:
- The Name corresponds to the NameWeight filled in the Transport Name table. If the Transport Name table is not filled in, the display model automatically calculates the result through the Qty and Product GroupName filled in the Transport Name table combined with the WeightColumn in the Product Group table.
# Volume
Applicable Algorithms: TO
Description: The Name corresponds to the NameVolume filled in the Transport Name table. If the Transport Name table is not filled in, the display model automatically calculates the result through the Qty and Product GroupName filled in the Transport Name table and the VolumeColumn in the Product Group table.
# Quantity
Applicable Algorithms: TO
Description:
- This Name corresponds to the Qty filled in the Transport Name table.
# PickupStopId
Applicable Algorithms: TO
Description:
- Indicates the order of the stops of the Site Group where the loading link of the Name is located in the Route Id.
# ProductName
Applicable Algorithms: TO
Description:
- Indicates the Product GroupName corresponding to this Name in the transport Name table.
# DeliveryStopId
Applicable Algorithms: TO
Description:
- Indicates the order of the stops of the Site Group where the unloading link of the Name is located in the Route Id.
# SourceName
Applicable Algorithms: TO
Description:
- is equal to the Start SiteName filled in the Transport Name table.
# SiteName
Applicable Algorithms: TO
Description:
- is equal to the SiteName filled in the Transport Name table.
# Hub
Applicable Algorithms: TO
Description:
- Takes effect in the Hub Used function, indicating the Hub that the order passes through.
# DirectShippingCost
Applicable Algorithms: TO
Description:
- Indicates the cost required for direct delivery of the order, i.e. the Direct Shipment Cost filled in the shipment table.
# DecompositionId
Applicable Algorithms: TO
Description:
- Not yet effective.
# ScenarioId
Applicable Algorithms: TO
Description:
- The scenario numbers within the model have no actual meaning.
# OutputToInvalidShipments
# Scenario
Applicable Algorithms: TO
Description: Indicates the Scenario where the optimization model data is located.
# ShipmentName
Applicable Algorithms: TO
Description:
- Corresponding to the order number filled in the shipment table.
# ProductName
Applicable Algorithms: TO
Description:
- Indicates the Product GroupName corresponding to this Name in the transport Name table.
# Quantity
Applicable Algorithms: TO
Description: -Indicate the quantity filled in the shipment table.
# Weight
Applicable Algorithms: TO
Description:
- Indicate the order weight that should be filled in the shipment table corresponding to this order. If it is not filled in the shipment table, the result calculated automatically by the model will be displayed. The model calculates this result by using the quantity and product name filled inshipment table in combination with the weight field in the product table.
# Volume
Applicable Algorithms: TO
Description:
- Indicate the order volume that should be filled in the shipment table corresponding to this order. If it is not filled in the shipment table, the result calculated automatically by the model will be displayed. The model calculates this result by using the quantity and product name filled inshipment table in combination with the volume field in the product table.
# Comment
Applicable Algorithms: TO
Description: Invalid Reasons are mainly: The source site, destination site, or the product is not defined. Or the time window is invalid. That is, the Start Site, End Site, and Product Group of the transport Name are not defined in the corresponding input table, or the Time window of the Name is invalid (for example, it has no intersection with the business time of the Start Site and End Site Group).
# SourceName
Applicable Algorithms: TO
Description:
- Indicate the Source Name filled in the shipment table.
# SiteName
Applicable Algorithms: TO
Description:
- Indicate the Customer Name filled in the shipment table.
# ScenarioId
Applicable Algorithms: TO
Description:
- The scenario numbers within the model have no actual meaning.
# OutputToUnroutedShipments
# Scenario
Applicable Algorithms: TO
Description:
- Indicates the scenario name where the optimization model data is located.
# ShipmentName
Applicable Algorithms: TO
Description:
- Corresponding to the order number filled in the shipment table.
# ProductName
Applicable Algorithms: TO
Description:
- Indicates the product name corresponding to the order in the shipment table.
# Weight
Applicable Algorithms: TO
Description:
- The column corresponds to the weight filled in the shipments table. If the shipments table is not filled in, the model automatically calculates the result through the Qty and product name filled in the shipments table combined with the weight in the products table.
# Volume
Applicable Algorithms: TO
Description:
- The column corresponds to the volume filled in the shipments table. If the shipments table is not filled in, the model automatically calculates the result through the Qty and product name filled in the shipments table combined with the volume in the products table.
# Quantity
Applicable Algorithms: TO
Description:
- This field corresponds to the Qty filled in the shipments table.
# SourceName
Applicable Algorithms: TO
Description:
- This field is equal to the source name filled in the shipments table.
# DirectShippingCost
Applicable Algorithms: TO
Description:
- Indicates the cost required for direct shipping of the order, i.e. the direct shipping cost filled in the shipments table.
# SiteName
Applicable Algorithms: TO
Description:
- is equal to the site name filled in the shipments table.
# Comment
Applicable Algorithms: TO
Description:
- Unassigned Reasons include Direct shipping is cost saving and all feasible assets are used. The former means that direct shipping of order can save on total cost, and the latter means that the order cannot complete the delivery due to limited transportation assets (Asset Id).
# ScenarioId
Applicable Algorithms: TO
Description:
- The field indicates the scenario numbers within the model, have no actual meaning.
# OutputToRouteDetails
# Scenario
Applicable Algorithms: TO
Description:
- Indicates the scenario where the vehicle route optimization's output is located.
# AssetName
Applicable Algorithms: TO
Description:
- Indicates that the activity asset name
# AssetId
Applicable Algorithms: TO
Description:
- Indicates the asset Id. The model automatically connects the asset id's asset name, start site, number and other information to name the asset id.
# Route
Applicable Algorithms: TO
Description:
- Indicates the route id to which this operation belongs.
- A Route Id refers to the process of a vehicle from departure, loading, unloading, and returning to the location.
# GanttId
Applicable Algorithms: TO
Description:
- Indicates the sequence number of the activity in the route id. The model uses consecutive positive integers to identify the sequence of different activities of the same route. Gantt Ids from small to large represent from first to last.
# SourceName
Applicable Algorithms: TO
Description:
- Indicates the name of the start site (site group) of the activity.
# SiteName
Applicable Algorithms: TO
Description:
- Indicates the destination site (site group) of the activity. If the operation does not involve displacement (such as loading and unloading), the end location is the same as the start location.
# ActivityType
Applicable Algorithms: TO
Description:
- Indicates the type of the activity, which can be as follows: EquipmentStart: asset new route starts, EquipmentEnd: asset route ends, Load: asset loading, Unload: asset unloading, Wait: asset waiting, Travel: asset driving, long break: overnight.
# ActivityStartTime
Applicable Algorithms: TO
Description:
- Indicates the start time of the activity.
# ActivityEndTime
Applicable Algorithms: TO
Description:
- Indicates the end time of the activity.
# Distance
Applicable Algorithms: TO
Description:
- Indicates the travel distance corresponding to the operation. If and only if the operation Type is Travel, the Distance is greater than zero.
# CumulativeDistance
Applicable Algorithms: TO
Description:
- Indicates the accumulated travel distance from the start of the Route Id to the end of the current operation in the Route Id where the operation is located.
# ActivityTime
Applicable Algorithms: TO
Description:
- Indicates the activity time corresponding to the activity, that is, the difference between the end time and the start time of the activity.
# CumulativeTime
Applicable Algorithms: TO
Description:
- Indicates the accumulated activity time from the beginning of the route to the end of the route.
# ActivityCost
Applicable Algorithms: TO
Description:
- Indicates the activity cost corresponding to the activity.
- When the activity type is equipmentStart, the corresponding Activity Cost is the Fixed Cost of Route (i.e. the Fixed Cost in the Rate table).
- The cost corresponding to the transport volume (i.e. the Per Unit Cost in the Rate table) is recorded in the Load activity corresponding to the order.
# CumulativeCost
Applicable Algorithms: TO
Description:
- Indicates the accumulated activity cost from the beginning of the route to the end of the route where the activity is located.
# LoadUnloadQuantity
Applicable Algorithms: TO
Description:
- The sum of the Qty (Quantity) of the orders involved in the activity (such as loading and unloading activities).
# LoadUnloadWeight
Applicable Algorithms: TO
Description:
- The sum of the weights of the orders involved in the activity (such as loading and unloading activities).
# LoadUnloadCubic
Applicable Algorithms: TO
Description: The sum of the volumes of the orders involved in the activity (such as loading and unloading activities).
# LoadUnloadShipmentCount
Applicable Algorithms: TO
Description:
- The quantity of order involved in the activity (such as loading and unloading activities).
# TotalQuantity
Applicable Algorithms: TO
Description:
- After the activity is completed, the sum of the Qty (Quantity) of all orders loaded by the asset.
# TotalWeight
Applicable Algorithms: TO
Description:
- At the end of the activity, the sum of the weights of all orders loaded by the asset.
# TotalCubic
Applicable Algorithms: TO
Description:
- At the end of the activity, the sum of the volumes of all orders loaded by the asset.
# TotalQuantity
Applicable Algorithms: TO
Description:
- At the end of the activity, the quantity of all orders loaded by the Asset that performed the activity.
# RemainingQuantityCapacity
Applicable Algorithms: TO
Description:
- After the activity is completed, the remaining capacity (in Qty) of the asset that performs the activity. If the asset of the asset type does not define capacity quantity (Asset table), this column displays 0.
# RemainingWeightCapacity
Applicable Algorithms: TO
Description:
- After the activity is completed, the remaining capacity (in weight) of the asset that performs the activity. If the asset of the asset type does not define capacity quantity (Asset table), this column displays 0.
# RemainingCubicCapacity
Applicable Algorithms: TO
Description:
- After the activity is completed, the remaining capacity (in volume) of the asset that performs the activity. If the asset of the asset type does not define capacity quantity (Asset table), this column displays 0.
# StartLocationLatitude
Applicable Algorithms: TO
Description:
- Indicates the latitude of the start site, which is derived from the latitude column entered in the Sites table.
# StartLocationLongitude
Applicable Algorithms: TO
Description:
- Indicates the longitude of the start site, which is derived from the longitude column entered in the Sites table.
# EndLocationLatitude
Applicable Algorithms: TO
Description:
- Indicates the latitude of the end site, which is derived from the latitude column entered in the Sites table.
# EndLocationLongitude
Applicable Algorithms: TO
Description:
- Indicates the longitude of the end site, which is derived from the longitude column entered in the Sites table.
# ScenarioId
Applicable Algorithms: TO
Description:
- The field indicates the scenario numbers within the model, have no actual meaning.
# OutputToSegments
# Scenario
Applicable Algorithms: TO
Description:
- Indicates the scenario where the vehicle route optimization's output is located.
# StartDate
Applicable Algorithms: TO
Description:
- Indicates the start time of the segment route, that is, the time to arrive at the Start Site of the segment route.
# EndDate
Applicable Algorithms: TO
Description:
- Indicates the end time of the segmented route, that is, the time of leaving the segmented route End Site.
# Distance
Applicable Algorithms: TO
Description:
- Indicates the travel distance from the Start Site to the End Site corresponding to the segmented Route, which comes from the Transit Matrix table in the input table.
# DriveTime
Applicable Algorithms: TO
Description:
- Indicates the Driving time from the Start Site to the End Site corresponding to the segmented route, which comes from the transit matrix table in the input tables.
# AdditiveCost
Applicable Algorithms: TO
Description:
- Indicates the additional cost corresponding to the segmented route, which comes from the transit matrix table in the input tables. Additional cost usually refers to tolls, bridge tolls, etc.
# SegmentId
Applicable Algorithms: TO
Description:
- Indicates the name of the segmented route.
- In general, use consecutive positive integers to name the segmented routes.
# Route
Applicable Algorithms: TO
Description:
- Indicates the route id to which this segmented route belongs.
- A Route Id refers to the process of a vehicle from departure, loading, unloading, and returning to the Location. A vehicle can execute multiple Routes.
# SequenceId
Applicable Algorithms: TO
Description:
- Indicates the Sequence ID of the segmented route within the corresponding Route ID.
- In general, Sequence IDs are consecutive positive integers, representing the order of the segmented routes from first to last.
# StartStopId
Applicable Algorithms: TO
Description:
- Indicates the Sequence ID of the Start Site of this route segment.
- corresponds one-to-one with the Sequence Id of the stop in the stop details.
# SourceName
Applicable Algorithms: TO
Description:
- Indicates the name of the start site of this route segment defined in the site group table.
# EndStopId
Applicable Algorithms: TO
Description:
- Indicates the sequence id of the end site stop of this route segment.
- Corresponds one-to-one with the stop sequence id in the stop details.
# SiteName
Applicable Algorithms: TO
Description:
- Indicates the name of the end site of this route segment defined in the site group table.
# ScenarioId
Applicable Algorithms: TO
Description:
- The field indicates the scenario numbers within the model, have no actual meaning.
# OutputToAssets
# AssetId
Applicable Algorithms: TO
Description:
- Asset Id is usually named as "AssetName_SourceSite_Sequence Id", where AssetName and SourceSite are taken from the Asset Assignment table (Input table).
# Scenario
Applicable Algorithms: TO
Description:
- Indicates the scenario where the vehicle route optimization's output is located.
# AssetName
Applicable Algorithms: TO
Description:
- Indicates that the activity asset name
# AssetDomicile
Applicable Algorithms: TO
Description:
- Indicates the start location (i.e., starting site) of the asset.
# StartDate
Applicable Algorithms: TO
Description:
- Indicates the time when the asset starts working.
# EndDate
Applicable Algorithms: TO
Description:
- Indicates the time when the asset ends its work.
# TotalTransportationSystemCost
Applicable Algorithms: TO
Description:
- Indicates the total cost consumed by the Asset.
- Transportation Cost = Total Route Cost + Fixed Cost
# FixedAssetCost
Applicable Algorithms: TO
Description:
- Indicates the fixed cost corresponding to the asset.
- Corresponds to the Fixed Cost in the asset input table.
# TotalRouteCost
Applicable Algorithms: TO
Description:
- Indicates the sum of the route costs of each route ID (see the route summary table) of the asset .
# TotalDistance
Applicable Algorithms: TO
Description:
- Indicates the sum of the travel distances (including reposition distances) of each Route ID of the Asset ID (see VRO Route Summary Table).
# RepositionDistance
Applicable Algorithms: TO
Description:
- Indicates the sum of the Reposition Distances of each Route ID of the Asset ID (see VRO Route Summary Table). Reposition Distance refers to the sum of driving distances under the empty status of the Asset ID (empty vehicle driving to pick up goods, empty vehicle returning to Location after delivery, etc.).
# TotalStops
Applicable Algorithms: TO
Description:
- Indicates the sum of the number of stops for each route (see Route Summary Table) of the Asset.
# InTransitStops
Applicable Algorithms: TO
Description:
- Indicates the sum of In Transit Stops of each route (see Route Summary Table) of the Asset.
# TotalWeight
Applicable Algorithms: TO
Description:
- Indicates the sum of the order weight carried by the asset.
# TotalCubic
Applicable Algorithms: TO
Description:
- Indicates the sum of the order volume carried by the asset.
# TotalQuantity
Applicable Algorithms: TO
Description:
- Indicates the sum of the order quantity carried by the asset.
# TotalTime
Applicable Algorithms: TO
Description:
- Indicates the total time of the asset, in minutes, which is equal to the difference between the end time and the start time.
# DutyTime
Applicable Algorithms: TO
Description:
- Indicates the duty time of the Asset, which is equal to the sum of the waiting, driving, loading and unloading times, that is, the sum of the duty times of each Route Id (see Route Summary Table) of the Asset.
# DriveTime
Applicable Algorithms: TO
Description:
- Indicates the drive time of the Asset, which is equal to the sum of the Drive Time (including reposition Time) of each Route Id (see Route Summary Table) of the Asset.
# RepositionTime
Applicable Algorithms: TO
Description:
- Indicates the Reposition Time of the Asset Id, which is equal to the sum of the Reposition Time of each Route Id (see Route Summary Table) of the Asset Id, and corresponds to the reposition Distance.
# ServiceTime
Applicable Algorithms: TO
Description: Indicates the sum of the loading and unloading time of the Asset Id, that is, the sum of the Service Time of each Route Id (see Route Summary Table) of the Asset Id.
# WaitTime
Applicable Algorithms: TO
Description:
- Indicates the sum of the Wait Time of the Asset Id, which is equal to the sum of the Wait Time of each Route Id (see Route Summary Table) of the Asset.
# OvernightTime
Applicable Algorithms: TO
Description:
- Indicates the total overnight time of the Asset, which is equal to the total overnight time of each Route Id (see Route Summary Table) of the Asset.
# TotalGapTimeBetweenRoutes
Applicable Algorithms: TO
Description:
- Indicates the sum of the time intervals between multiple Route IDs of the Asset ID.
- If the Asset ID has only one Route ID, the Total Gap Time Between Routes is equal to 0.
# TimeUtilization
Applicable Algorithms: TO
Description:
- Indicates the ratio of the Duty Time of the Asset to the total duration of the Period, which is equal to (Total Time - Total Gap Time Between Routes) / Period duration.
# RouteUtilization
Applicable Algorithms: TO
Description:
- It is equal to the maximum value of Route Utilization measured in the following three dimensions, that is, max[Route Utilization-Qty, Route Utilization-Weight, Route Utilization-Volume].
# RouteUtilizationInWeight
Applicable Algorithms: TO
Description:
- It is equal to the sum of the actual load weights of all Route IDs of the Asset ID (see Route Summary Table) divided by the maximum load weight corresponding to the Asset ID used by the Route ID and then divided by the Qty of the Route ID. Note that in the scenario of interleave, Route Utilization may be greater than 1.
# RouteUtilizationInQuantity
Applicable Algorithms: TO
Description: It is equal to the sum of the actual loading Qty (Quantity) of all Route IDs of the Asset ID (see Route Summary Table) divided by the maximum loading Qty corresponding to the Asset ID used by the Route ID and then divided by the Qty of the Route ID. Note that in the scenario of interleave, Route Utilization may be greater than 1.
# RouteUtilizationInVolume
Applicable Algorithms: TO
Description:
- It is equal to the sum of the actual loading volumes of all Route IDs of the Asset ID (see Route Summary Table) divided by the maximum loading volume corresponding to the Asset ID used by the Route ID and then divided by the Qty of the Route ID. Note that in the scenario of interleave, Route Utilization may be greater than 1.
# NumberOfRoutesInAsset
Applicable Algorithms: TO
Description:
- Equal to the number of Routes the Asset take.
# DecompositionId
Applicable Algorithms: TO
Description:
- Not yet effective.
# ScenarioId
Applicable Algorithms: TO
Description:
- The field indicates the scenario numbers within the model, have no actual meaning.
# OutputToStops
# Scenario
Applicable Algorithms: TO
Description:
- Indicates the scenario where the vehicle route optimization's output is located.
# StopId
Applicable Algorithms: TO
Description:
- Indicates the id of the stop, which corresponds to the Sequence Id of the start and the Sequence Id of the end site in the segment route details.
# Route
Applicable Algorithms: TO
Description:
- Indicates the name of the Route Id to which the stop belongs.
- A Route Id refers to the process of a vehicle from departure, loading, unloading, and returning to the Location.
# SequenceId
Applicable Algorithms: TO
Description:
- Indicates the Sequence ID within the Route ID to which the stop belongs.
- In general, Sequence IDs are consecutive positive integers, representing the order of the stops from small to large.
# SiteName
Applicable Algorithms: TO
Description:
- Indicates the Name of the stop defined in the Sites table.
# ArriveDateTime
Applicable Algorithms: TO
Description:
- Indicates the time when the Asset arrives at the stop.
# DeliveryTime
Applicable Algorithms: TO
Description:
- Indicates the time when the Asset starts unloading after arriving at the stop.
- For the interleave scenario, this column refers to the time when loading starts.
# LeaveDateTime
Applicable Algorithms: TO
Description:
- Indicates the time when the Asset leaves the stop.
# Longitude
Applicable Algorithms: TO
Description:
- Indicates the Longitude of the Site to which this stop corresponds, which is derived from the Longitude Column entered in the Sites table.
# Latitude
Applicable Algorithms: TO
Description:
- Indicates the Latitude of the Site corresponding to this stop, which is derived from the Latitude Column entered in the Sites table.
# StopType
Applicable Algorithms: TO
Description:
- Indicates the Type of the operation, which can be one of the following (or a mixture of the following, connected by a dash):
- Equipment Start: Asset new Route starts, - Equipment Return: Route ends, - Pickup: Asset loading, - Delivery: Asset unloading.
# PickupCubic
Applicable Algorithms: TO
Description:
- The sum of the Volume of the cargo loaded at this stop.
# PickupWeight
Applicable Algorithms: TO
Description:
- The sum of the weight of the cargo loaded at this stop.
# PickupQty
Applicable Algorithms: TO
Description:
- The sum of the quantity of the cargo loaded at this stop.
# DeliveredCubic
Applicable Algorithms: TO
Description:
- The sum of the Volume of the cargo unloaded at this stop.
# DeliveredWeight
Applicable Algorithms: TO
Description:
- The sum of the weight of the cargo unloaded at this stop.
# DeliveredQty
Applicable Algorithms: TO
Description:
- The sum of the quantity of the cargo unloaded at this stop.
# RemainingCubic
Applicable Algorithms: TO
Description:
- The sum of the volumes loaded on the Asset after the loading and unloading operations at this stop are completed.
# RemainingWeight
Applicable Algorithms: TO
Description:
- The sum of the Weights loaded on the Asset after the loading and unloading operations at the stop are completed.
# RemainingQty
Applicable Algorithms: TO
Description: The sum of the Qty (Quantity) loaded on the Asset Id after the loading and unloading operations at the stop are completed.
# Quantity
Applicable Algorithms: TO
Description:
- The sum of the Qty (Quantity) of orders involved in the loading and unloading operations at this stop is equal to the sum of the loading Qty and the unloading Qty.
# Weight
Applicable Algorithms: TO
Description:
- Indicates the total weight of orders involved in the loading and unloading operations at this Site, which equals the sum of the loading weight (kg) and unloading weight (kg).
# Volume
Applicable Algorithms: TO
Description:
- Indicates the total volume of orders involved in the loading and unloading operations at this Site, which equals the sum of the loading volume (cbm) and unloading volume (cbm).
# ScenarioId
Applicable Algorithms: TO
Description:
- The field indicates the scenario numbers within the model, have no actual meaning.
# Weight
Applicable Algorithms: All
Description:
- The sum of the Weight of orders involved in the loading and unloading operations at this stop is equal to the sum of the loading Weight (kg) and the unloading Weight (kg).
# Volume
Applicable Algorithms: All
Description:
- The sum of the Volumes of orders involved in the loading and unloading operations of this stop is equal to the sum of the loading Volume (cbm) and the unloading Volume (cbm).
# OutputToBreaks
# Scenario
Applicable Algorithms: TO
Description:
- Indicates the scenario where the vehicle route optimization's output is located.
# RouteBreakId
Applicable Algorithms: TO
Description:
- Indicates the Sequence Id corresponding to this break.
# BreakStartDateTime
Applicable Algorithms: TO
Description:
- Indicates the Start Date & Time of this break.
# BreakEndDateTime
Applicable Algorithms: TO
Description:
- Indicates the End Date & Time of this break.
# Route
Applicable Algorithms: TO
Description:
- Indicates the Route Id to which this break belongs.
- A Route Id refers to the process of a vehicle from departure, loading, unloading, and returning to the Location.
# BreakCost
Applicable Algorithms: TO
Description:
- Indicates the cost of this break, which corresponds to the Overnight Cost in the Rate table associated with the Asset used by the Route.
# SegmentId
Applicable Algorithms: TO
Description:
- Associated with the segment route name in the segment Route details table.
- Note that if the break occurs during driving, it can correspond to the corresponding segment route, but if the break occurs during other operation types such as waiting, loading and unloading, the segment route name here is displayed as -1.
# ScenarioId
Applicable Algorithms: TO
Description:
- The field indicates the scenario numbers within the model, have no actual meaning.
# OutputToPeriodicOptimizationInventoryDetails
# Scenario
Applicable Algorithms: TO
Description: Not effective
# SourceName
Applicable Algorithms: TO
Description: Not effective
# SiteName
Applicable Algorithms: TO
Description: Not effective
# Date
Applicable Algorithms: TO
Description: Not effective
# InventoryHoldingCost
Applicable Algorithms: TO
Description: Not effective
# BeginningInventory
Applicable Algorithms: TO
Description: Not effective
# EndingInventory
Applicable Algorithms: TO
Description: Not effective
# UnitsReceived
Applicable Algorithms: TO
Description: Not effective
# UnitsConsumed
Applicable Algorithms: TO
Description: Not effective
# ScenarioId
Applicable Algorithms: TO
Description: Not effective
# OutputConstraintDetail
# Scenario
Applicable Algorithms: NO, SSO, OA
Description:
- Indicates the scenario name where the optimization model data is located.
# Expression
Applicable Algorithms: NO, SSO, OA
Description:
- Indicates the Expression name corresponding to the expression constraints.
# GroupId
Applicable Algorithms: NO, SSO, OA
Description:
- Indicates a constraint group. For example, PERIOD1-DC1-CZ1-PRODUCT-LTL.
# Description
Applicable Algorithms: NO, SSO, OA
Description:
- indicates the constraint category of the constraint Group, such as Flow Constraint.
# ConstraintType
Applicable Algorithms: NO, SSO, OA
Description:
- Indicates the type of the constraint, such as Max, Min, etc.
# ConstraintValue
Applicable Algorithms: NO, SSO, OA
Description:
- Indicates the constraint value set for the constraint group. For example, a flow constranit of 10,000 is set for DC1.
# ConstraintResult
Applicable Algorithms: NO, SSO, OA
Description:
- Indicates the actual value after optimization with the Constraint Group.
# UnitConstraintPenaltyCost
Applicable Algorithms: NO
Description:
- Indicates the Penalty Cost triggered by soft constraints in the network optimization results.
# OutputClusteringResults
# Scenario
Applicable Algorithms: CT
Description:
- The ScenarioName of this category.
# SiteName
Applicable Algorithms: CT
Description:
- The SiteName of this category.
# ProductName
Applicable Algorithms: CT
Description:
- The ProductName of this category.
# ClusterId
Applicable Algorithms: CT
Description:
- The self-incrementing ID of this category.
# OutputClusteringTrees
# Scenario
Applicable Algorithms: CT
Description:
- The ScenarioName of the classification decision tree.
# TreeId
Applicable Algorithms: CT
Description:
- The self-incrementing ID of the classification decision tree.
# TreeInfo
Applicable Algorithms: CT
Description:
- The decision branch information of the classification decision tree.
# Transaction Data Forecast
# OutputForecastValue
# SubmodelName
Applicable Algorithms: FA
Description:
- The SubmodelName of the prediction point with a large predicted deviation determined by the system.
# Scenario
Applicable Algorithms: FA
Description:
- ScenarioName of the predicted result.
# SiteName
Applicable Algorithms: FA
Description:
- Indicates SiteName in the Forecasting model.
# ProductName
Applicable Algorithms: FA
Description:
- ProductName of the predicted result.
# PeriodName
Applicable Algorithms: FA
Description:
- PeriodName of the predicted Period.
# ForecastDate
Applicable Algorithms: FA
Description:
- StartDate of the prediction time point.
# ForecastValue
Applicable Algorithms: FA
Description:
- Predicted total quantity at the prediction time point.
# ConstraintResult
Applicable Algorithms: FA
Description:
- Historical fitted value, if the forecast time is at or after the start of the prediction period, the output will be 0.
# ForecastRmse
Applicable Algorithms: FA
Description:
- Uncertainty of forecast results
# PeriodLength
Applicable Algorithms: FA
Description:
- The number of days in the prediction Period.
# OutputForecastModel
# SubmodelName
Applicable Algorithms: FA
Description:
- Identify the submodel tag, which is carried from the SubmodelName of the prediction model parameter. It does not participate in the calculation.
# Scenario
Applicable Algorithms: FA
Description:
- Indicates the scenario for generating summary data.
# SiteName
Applicable Algorithms: FA
Description:
- Indicates SiteName in the Forecasting model.
# ProductName
Applicable Algorithms: FA
Description:
- Indicates the Product name that generates summary data.
# StartDate
Applicable Algorithms: FA
Description:
- Indicates the historical PeriodStart Date of the Product at the Site during this forecast.
# EndDate
Applicable Algorithms: FA
Description:
- Indicates the historical PeriodEnd Date of the Product at the Site during this forecast.
# Mean
Applicable Algorithms: FA
Description:
- Indicates the average demand quantity for the Product at the Site during this forecast.
- Average Demand Quantity = Σ(Demand Quantity of Order 1 + Demand Quantity of Order 2 + ...) ÷ Number of Days in the Model Period
# StandardDeviation
Applicable Algorithms: FA
Description:
- Indicates the standard deviation of demand quantities for the Product at the Site.
- Standard Deviation of Demand Quantities = Square root of [((Quantity of Order 1 - Mean of Demand)² + (Quantity of Order 2 - Mean of Demand)² + ...) ÷ Number of Days in the Model Period]
# NonZeroMean
Applicable Algorithms: FA
Description:
- Indicates the average quantities of non-zero demand for the Product Product at the Site.
- Average Demand Quantity = Σ(Demand Quantity of Order 1 + Demand Quantity of Order 2 + ...) ÷ Number of Days with Non-zero Demand
# NonZeroStandardDeviation
Applicable Algorithms: FA
Description:
- Indicates the non-zero standard deviation of demand quantities for the Product at the Site.
- Standard Deviation of Non-zero Demand Quantities = Square root of [((Quantity of Order 1 - Mean of Non-zero Demand)² + (Quantity of Order 2 - Mean of Non-zero Demand)² + ...) ÷ Number of Days with Non-zero Demand]
# MeanDemandInterval
Applicable Algorithms: FA
Description:
- Indicates the average demand interval for the Product at the Site.
# CoefficentOfVariation
Applicable Algorithms: FA
Description:
- Indicates the Variation Coefficient of demand quantities for the product at the site.
- Variation Coefficient = Mean / Standard Deviation
# DemandCount
Applicable Algorithms: FA
Description:
- Indicates the number of days that the Product has demanded in the Site within the Period.
- Total Value = Total Quantity * Unit Value, where Unit Value is referenced from the value field in the product table.
# TotalQuantity
Applicable Algorithms: FA
Description:
- Indicates the total Quantity of all forecasted demands for this particular Product within this specific Site
- The total Quantity is the sum of the order Quantity from the Customer Order table within the model Horizon.
# TotalWeight
Applicable Algorithms: FA
Description:
- Indicates the total Weight of all demands of this Product in this Site during the forecast period.
- Total Weight = Total Qty \ * Unit Weight, where Unit Weight is referenced from the Weight field defined in the Product table.
# TotalVolume
Applicable Algorithms: FA
Description:
- Indicates the total Volume of all forecasted demands for this Product Group in this Site Group - Total Volume = Total Qty
- Unit Volume, where The Unit Volume is obtained from the Volume field of the Product table.
# TotalValue
Applicable Algorithms: FA
Description:
- Indicates the total value of all forecasted demand for the Product in the Site
- Total Value = Total Qty \ * Unit Value, where Unit Value is obtained from the Value field of the Product table.
# TotalRevenue
Applicable Algorithms: FA
Description:
- Indicates the Total Revenue of all demands of this Product in this Site during the forecast period.
- Total Revenue = Total Qty \ * (Unit Price - Unit Value), where Unit Price and Unit Value are referenced from the Price and Value fields defined in the Product table.
# InSampleRmse
Applicable Algorithms: FA
Description:
- Evaluation Metrics for Forecasting.
- Uncertainty of Forecasting Results.
- Lower values are preferred.
# InSampleRmsse
Applicable Algorithms: FA
Description:
- Evaluation Metrics for Forecasting.
- RMSSE is the RMSE of the Forecasting algorithm/RMSE of the Naive algorithm.
- Lower values are preferred.
# InSampleMape
Applicable Algorithms: FA
Description:
- Evaluation Metrics for Forecasting.
- Uncertainty of Forecasting Results.
- Lower values are preferred.
# OutputForecastSummary
# Scenario
Applicable Algorithms: FA
Description:
- ScenarioName of the Forecasting algorithm executed this time.
# LastRunTime
Applicable Algorithms: FA
Description:
- Start time when the forecast algorithm runs.
# GlobalStartDate
Applicable Algorithms: FA
Description:
- Deprecated. Only one unified Start Date is allowed for each execution of the forecast algorithm.
- The global Start Date for this forecast algorithm execution.
# ForecastStartDate
Applicable Algorithms: FA
Description:
- Start Date of this forecast algorithm execution.
# NumSiteProduct
Applicable Algorithms: FA
Description:
- Number of site-product combinations within the forecast algorithm model.
# TotalValueWeightedRmsse
Applicable Algorithms: FA
Description:
- RMSSE accuracy weighted by Product Value.
- RMSSE is the RMSE of the Forecasting algorithm/RMSE of the Naive algorithm.
- Lower values are preferred.
# OutputForecastOutlier
# Scenario
Applicable Algorithms: FA
Description:
- The ScenarioName of the prediction point where the system determines that the prediction deviation is relatively large.
# SiteName
Applicable Algorithms: FA
Description:
- The Name of the Site with prediction points where the system detects relatively significant deviations.
# ProductName
Applicable Algorithms: FA
Description:
- The product names corresponding to the prediction points where the system detects relatively significant deviations.
# Date
Applicable Algorithms: FA
Description:
- The Dates with relatively large forecast deviations.
# ForecastValue
Applicable Algorithms: FA
Description:
- The Forecast Value where the system detects a relatively significant deviation.
# ConstraintResult
Applicable Algorithms: FA
Description:
- The system determines that the historical actual value with a large forecast deviation
# PercentDeviation
Applicable Algorithms: FA
Description:
- The Deviation Percentage between Forecast Value and Actual Value where the system detects relatively significant deviations.
# OutputForecastFeatureImportance
# Scenario
Applicable Algorithms: FA
Description:
- The ScenarioName of the corresponding Forecast Feature Importance output.
# SubmodelName
Applicable Algorithms: FA
Description:
- The key used for identifying the sub-model. It is derived from the name of the sub-model in the prediction model parameters and does not participate in calculations.
# SiteName
Applicable Algorithms: FA
Description:
- The Name of the Site corresponding to the regression Feature.
# ProductName
Applicable Algorithms: FA
Description:
- The Name of the Product or the Product Group corresponding to the Regressor.
# FeatureName
Applicable Algorithms: FA
Description:
- The Name of the regression Feature.
# Importance
Applicable Algorithms: FA
Description:
- The weight proportion of this regression Feature used for determining splits in the gradient boosting trees within the sub-model.
# Description
Applicable Algorithms: FA
Description:
- The description of built-in regressors.
# FeatureCategory
Applicable Algorithms: FA
Description:
- The category of the regression Feature includes the system built-in calendars, statistical features, user-defined events.
# Integrity Warning
# OutputDataIntegrityWarnings
# Scenario
Applicable Algorithms: NO
Description:
- Indicates the Scenario where the data anomaly is detected during the algorithm execution process. Output Data Integrity Warnings serve as warning information. The presence of Output Data Integrity Warnings does not necessarily mean the model will fail to run, but attention should still be given to these alerts to assess the correctness of the model's output.
# TableName
Applicable Algorithms: NO
Description:
- Indicates the table where the data anomaly is detected during the algorithm execution process. Output Data Integrity Warnings serve as warning information. The presence of Output Data Integrity Warnings does not necessarily mean the model will fail to run, but attention should still be given to these alerts to assess the correctness of the model's output.
# RowDetail
Applicable Algorithms: NO
Description:
- Indicates key field elements in the anomaly table detected during the algorithm execution process, such as PeriodName, SiteName, ProductName, etc. Output Data Integrity Warnings serve as warning information. The presence of Output Data Integrity Warnings does not necessarily mean the model will fail to run, but attention should still be given to these alerts to assess the correctness of the model's output.
# ColumnName
Applicable Algorithms: NO
Description:
- Indicates the column where the data anomaly is detected during the algorithm execution process. Output Data Integrity Warnings serve as warning information. The presence of Output Data Integrity Warnings does not necessarily mean the model will fail to run, but attention should still be given to these alerts to assess the correctness of the model's output.
# Description
Applicable Algorithms: NO
Description:
- Indicates the specific manifestation of data anomalies detected during the algorithm execution process.Output Data Integrity Warnings serve as warning information. The presence of Output Data Integrity Warnings does not necessarily mean the model will fail to run, but attention should still be given to these alerts to assess the correctness of the model's output.
← Input