# Help documentation
# Getting Started
# Register
The current version of SCATLAS is not open for registration. If you need a login account, please contact Lanxingai support service ( support@lanxingai.com )
# Log in
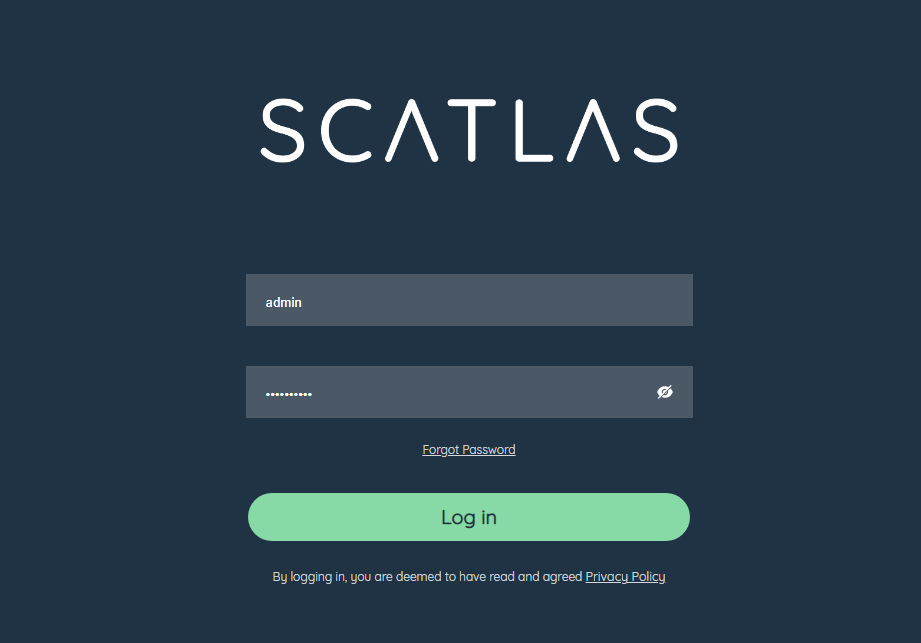
www.scatlas.com in the browser , open the SCATLAS login page, the button in the upper right corner of the page can switch the language, and enter the login information in the login box to log in. Google Chrome is recommended.
# Privacy Policy
The privacy policy of SCATLAS is attached below the login box, which explains in detail how SCATLAS collects, uses, stores and protects personal information. We attach great importance to the security of users' personal information, and logging in means you have read and agreed to the "Privacy Policy". If you have any questions about information security, please contact Lanxingai support service ( support@lanxingai.com ).
# Global function
After logging in, in the upper right corner of the SCATLAS model list page and the lower left corner of the model detail page, you can find the global functions of the software for a series of models, which are explained one by one below.
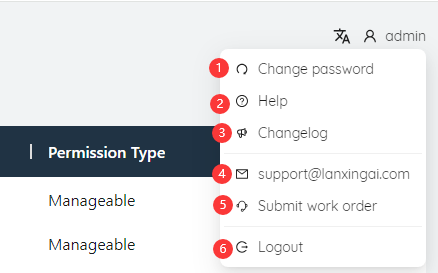
# ①Exit
Click the user name at top-right corner of main page to pop up options to modify the password or log out of the current login.

# ②Update log
Click the update log button  to view the new features, optimizations and bug fixes of each version of the software in the pop-up web page.
# ③Help
Click the Help button  to view the SCATLAS help page, which contains detailed software tutorials, function descriptions, and table and field descriptions. You can switch languages in the upper right corner.
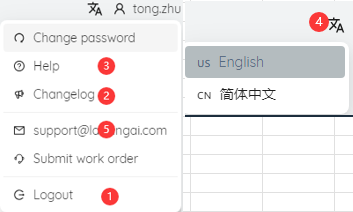
# ④Internationalization
SCATLAS currently provides Chinese and English versions.  You can click to switch on the login interface and the internationalization button on the software interface.
# ⑤Contact support
Click the user name at top-right corner of main page, and click the post-sale contact email to copy it, and you can send support and other SCATLAS-related usage questions to the email for help.

# Model Library
The first interface you enter after logging in is the model library interface. The folder can accommodate multiple models, so it can be used to intuitively manage different projects and models that serve different targets. In this interface, you can create and rename folders, open created folders, and manage folder permissions.

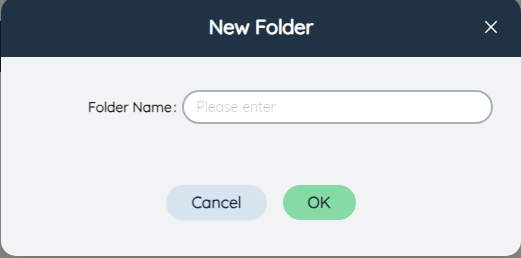
# ①Add a new folder
Click to pop up the New Folder window, enter the name of the new folder and click Add to add a new folder to the current user's list. It should be noted that the folder cannot have the same name, otherwise an error will be reported.
# ②Rename folder
Select a folder, click the button to pop up the rename folder interface, you can change the folder to a new name.
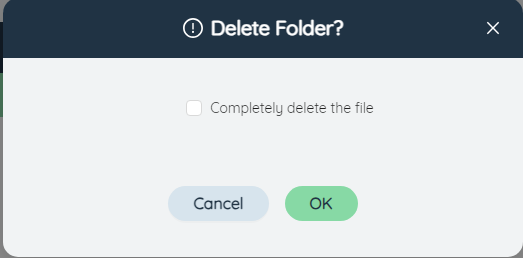
# ③Delete folder
Select a folder, click the button to pop up a delete confirmation dialog box, click OK to delete the folder and all the models contained in it, please operate with caution.
# ④Download folder
Select a folder and click the button to package and download all the models in the folder. When there are many models, the download time may be longer. It is recommended not to download a folder with many models at one time.
# ⑤Folder list
Displays a list of all folders created by the current user and has permission to browse and edit, including folder name, model number, creator, creation time, last access time and other information, in reverse order of last access time. The last column can manage the permissions of user-created folders. In the search box at the top right of the list, you can enter text to quickly filter the list.
# ⑥Member rights management
For user-created folders, click Manage to modify the access rights of other users to the folder. The options include read-only, editable, and invisible. Enter the user name in the search box in the upper right corner to quickly filter the user list.
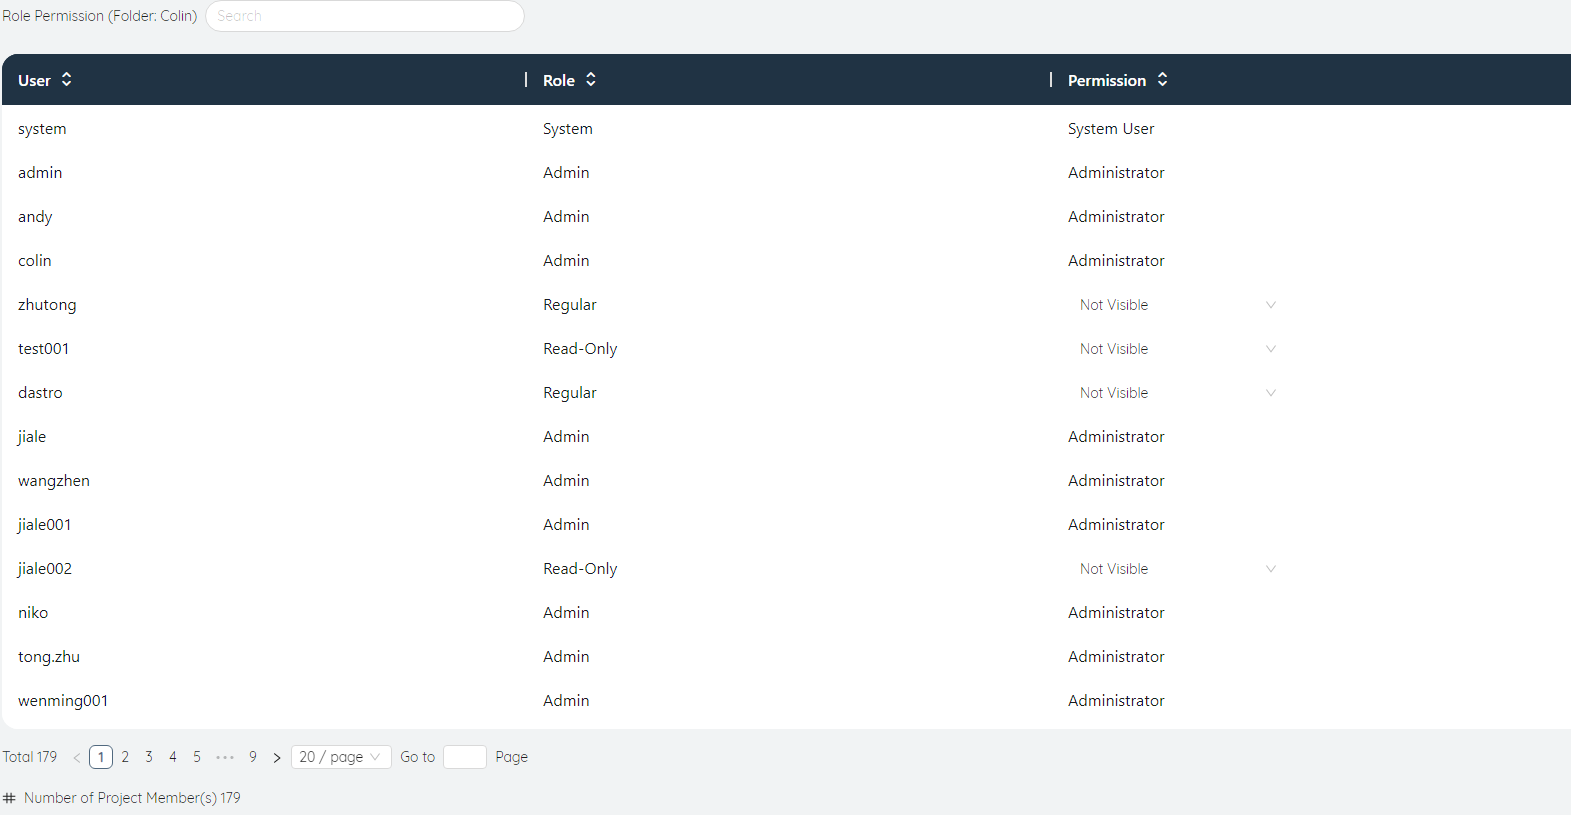
- Invisible: The account will not show this folder
- Read only: The account can access this folder, but cannot edit or download models in it.
- Editable: The account can access this folder, and can edit and download models in it.
# Model management
Double-click a folder to enter the model list page, which displays all models in the current folder. You can create, copy, upload, and download models on this page. One by one is explained below.
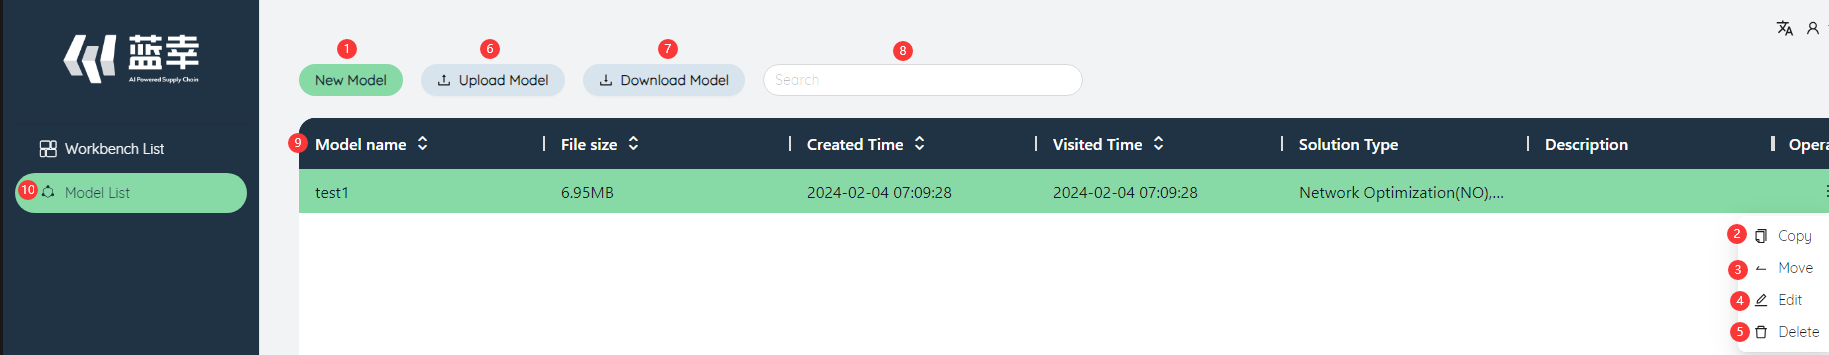
# ①Create a new model
Click New Model, enter the model name in the pop-up dialog box, select the solution type, and fill in the remarks (optional, up to 400 characters), and then click Add to generate a new model in the current folder.

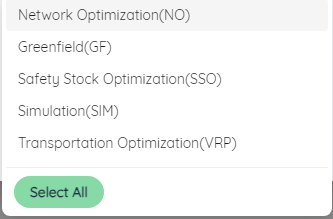
Among them, the model name is not allowed to be repeated. Multiple solution types can be selected at the same time, including: network optimization (SSO), location analysis (GF), safety stock optimization (SSO), simulation (SIM), order allocation, transportation optimization, input and output displayed by default for different types Tables and fields will be different. It is recommended to select the corresponding solution type only for the model to be established. If you do not know the required solution type, you can also select all types through the "Select All" button.
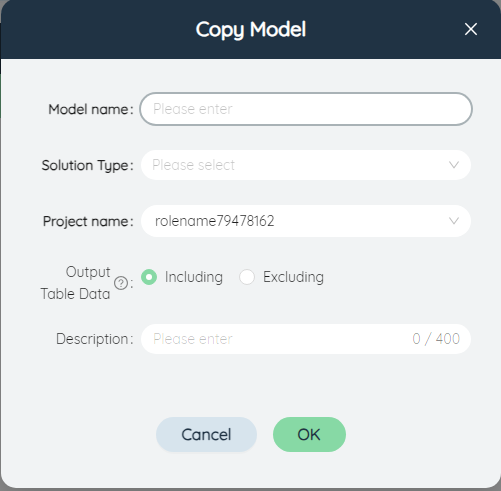
# ②Copy model
Select a current model and click the button to pop up the Copy Model dialog box. The copied model will automatically add the suffix "_copy" to the model name. The solution type and remarks are the same as the current model by default, and can also be modified manually.
# ③Move model
Select a current model and click the button to pop up the Move Model dialog box. You can select other folders that the user has permission to edit. After clicking Move, the model will be moved to the new folder.

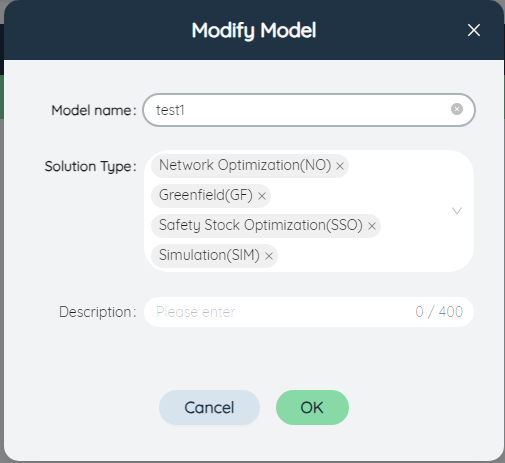
# ④Edit model
Select a current model, click the button to pop up the edit Model dialog box, where you can edit the model name, solution type, remarks and other information, which is the same as the new model, and will not be repeated here.
# ⑤Delete model
Select a current model, click the button to pop up a delete confirmation dialog box, click OK to delete the current model.

# ⑥Upload model
Click to pop up the file selection dialog box, select a model file and upload it. It should be noted that the extension of the model file should be zip or db.
# ⑦Download model
Select a current model, click to download the model file to the local, the file suffix is db.
# ⑧Search model
Enter text in the search box and press Enter to quickly filter the models in the current list by name.
# ⑨Model list
Displays all models in the current folder, including name, file size, creation time, last access time, remarks, etc. By default, they are sorted by creation time, or you can manually sort by column by clicking the triangle button next to the column name. The current folder name is listed above the list, along with the total number of models.
# ⑩Back to Model Library
By clicking the Logo on the upper left, you can jump out of the current folder and return to the list of all folders in Model Library.
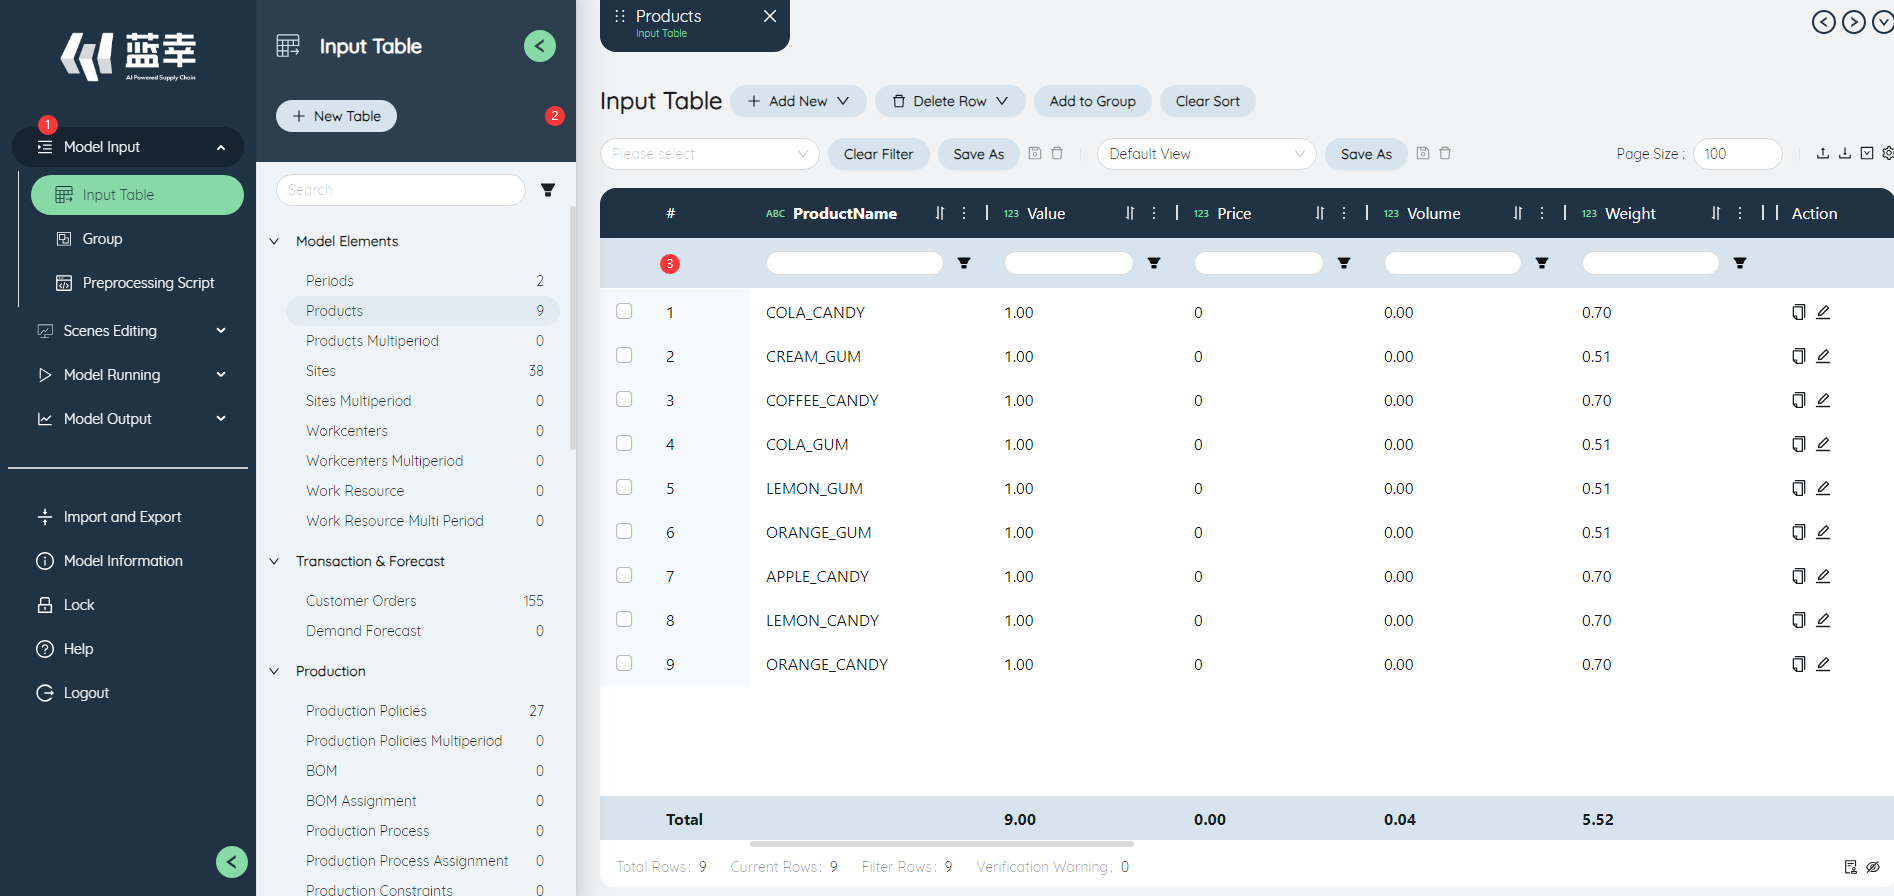
# Software interface
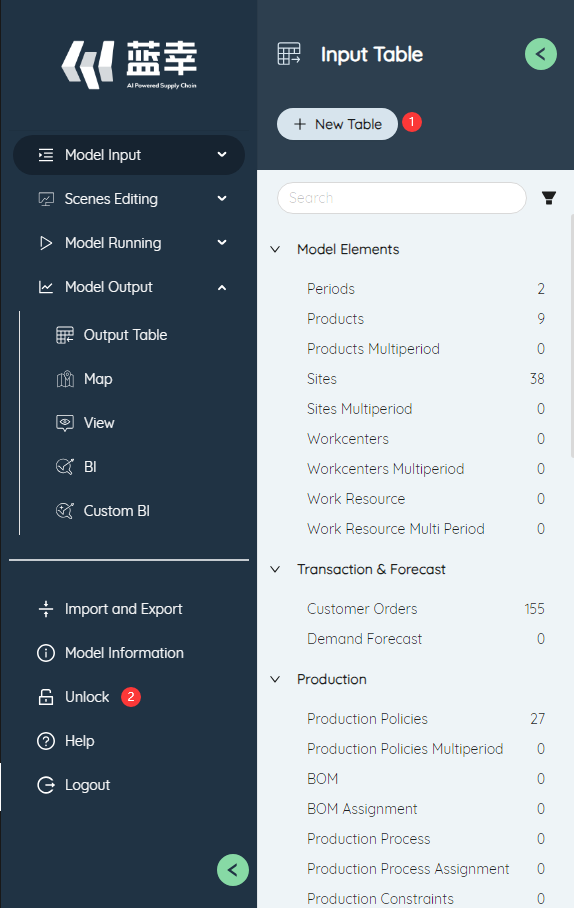
Double-click any model in the model list to enter the model details page similar to the following figure. The page function area is mainly divided into three parts: ①Function module buttons, ②Sidebar, ③Content editing area, which are explained below.
# Function module button
The function module buttons on the left can switch between different model functions. The main function modules include four parts: model input, scenario editing, running options, and model output. The functions of each module will be described in detail in the following chapters.
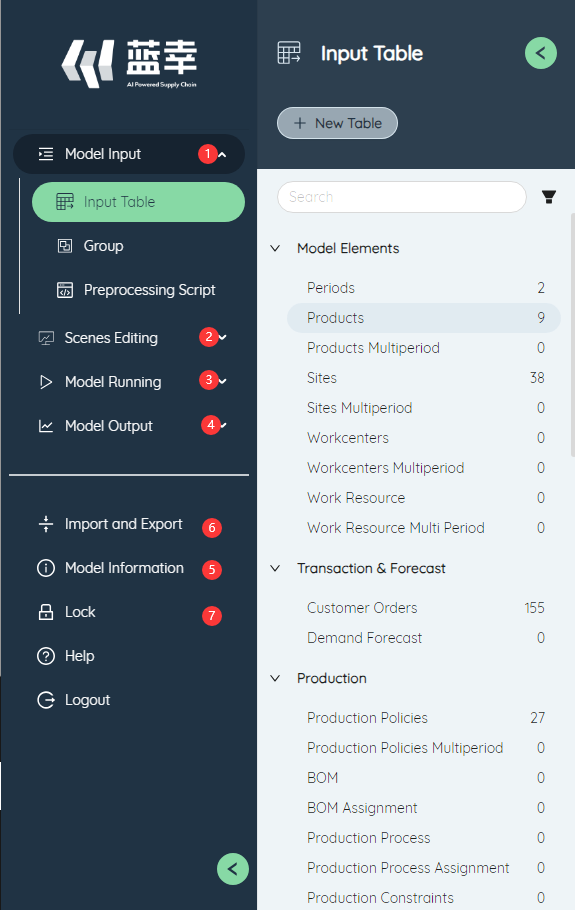
# ①Model input
Contains two sub-function modules, input table and group .
# ②Scenario editing
Contains three sub-function modules, scenario , scenario item , scenario editor .
# ③Model running
Contains two sub-function modules, Run Queue , model options .
# ④Model output
Contains three sub-function modules, output table , map , BI .
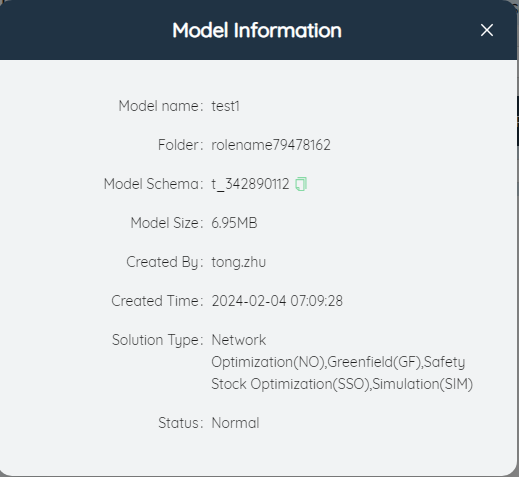
# ⑤Model information
Click to view the current model details, including model name, folder, model mode, model size, creator, creation time, solution type and other information.
The model schema shows the database storage SCHEMA used by the model in the SCATLAS database. When using database connection software such as DASTRO to modify the model data in batches, this information needs to be used to confirm the storage location of the model in the database.
# ⑥Import and export
Click the button to use the model import and export related functions, including importing data, exporting data, viewing the import and export list, and clearing the output data.

Import data: Select a local Excel file to import data related to one or more input tables. This function is similar to the "Import" function of a single input sheet, but batch import of multiple sheets can be performed here.
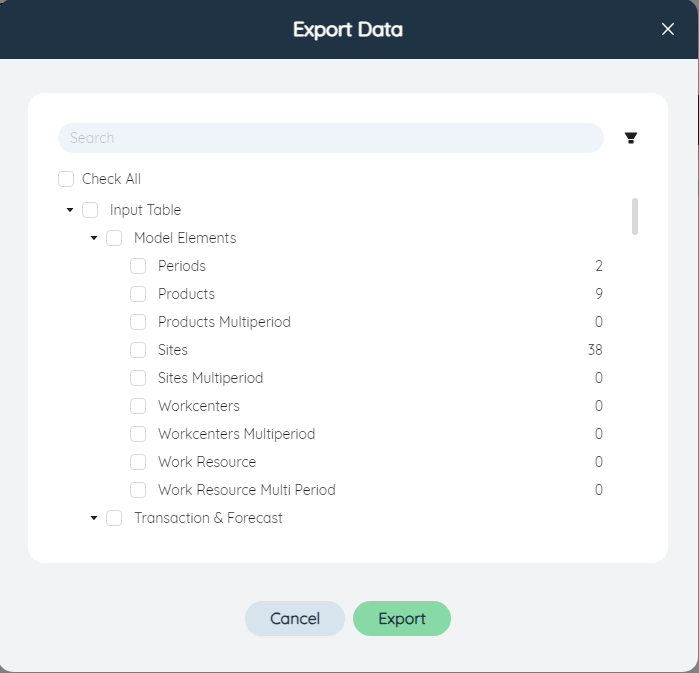
Export Data: Download multiple input and output tables in the current model to an Excel file, each selected data table will become a tab in Excel. The search box above can enter text to filter the data table, and the filter button on the right side of the search box can filter the data table according to the model solution type, whether it is empty or not.
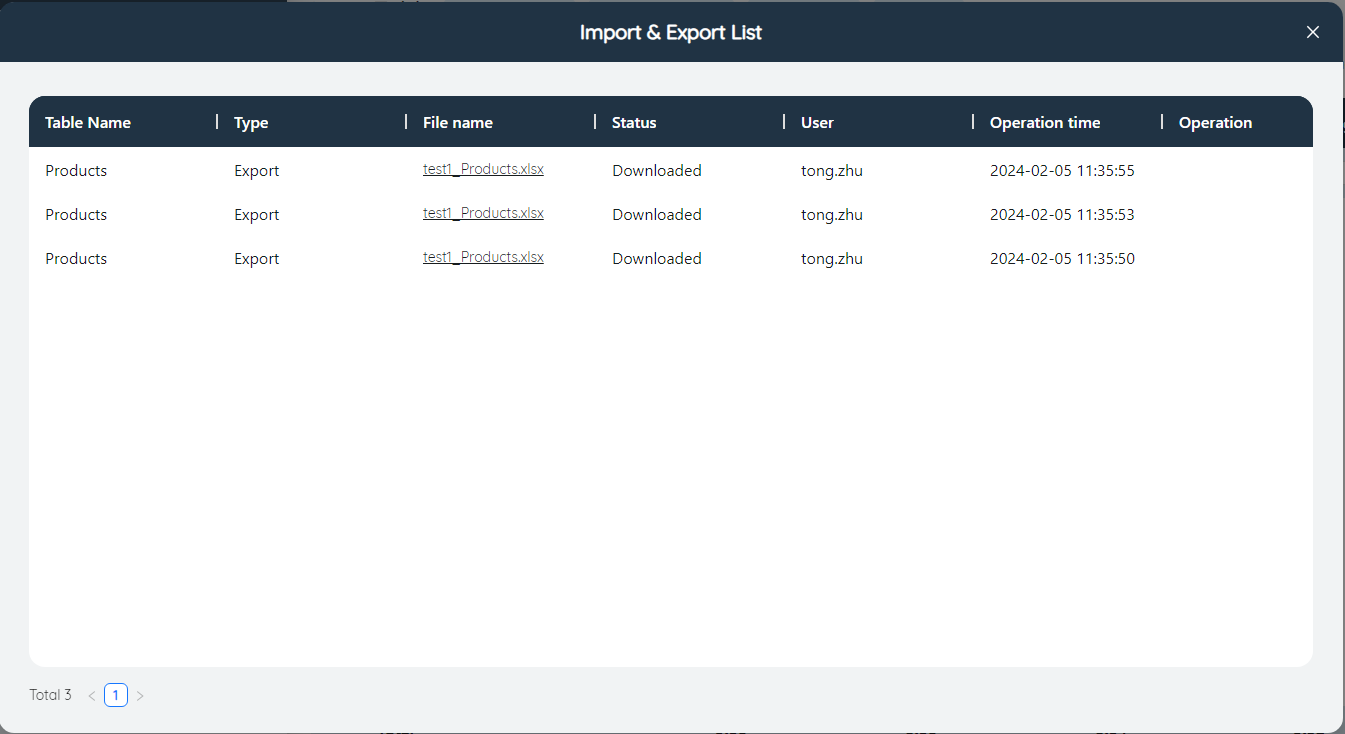
Import and export list: Display the status of all import and export operations of the current user. Click the file name to download the file again. For failed import and export operations, click the download log to view the specific error information.
Clear output data: Clear all the data in the current model or the output table related to the specified scenario. After selecting "Clear Selected", you can clear only the output table data of the corresponding scenario by checking the scenario name.
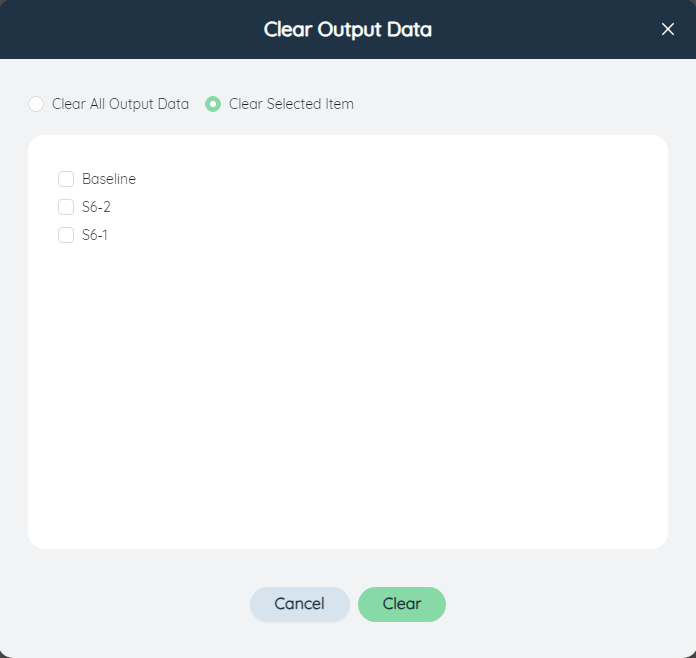
The operation of clearing data cannot be recovered and requires a second confirmation. Please operate with caution.

# ⑦Lock the sidebar
Click the button to toggle to locked  to keep the sidebar always expanded. When unlocked
  , the sidebar will automatically collapse when the mouse is clicked elsewhere on the screen.
# ⑧Contact us, help and exit
Is the same as that of the button at the global function , and will not be repeated here.
# Sidebar
Clicking most of the sub-function module buttons on the left will pop up a sidebar to display a list of newly created items in the current model, such as input table, output table, group, scenario, etc. The items are sorted alphabetically by default.
# ①Global function button
The global function of the current function module is located below the function title, and the position marked ①Is generally the "New" function, which is used to create a new project.
# ②Lock the sidebar
function of locking the sidebar has been described above and will not be repeated here.
# ③Project name change, copy, delete
In the sidebar of some functions (such as group, scenario, scenario item, scenario editor, map), clicking an item will display the buttons for renaming, copying, and deleting the item, which are located on the right side of the item, at the mark ①
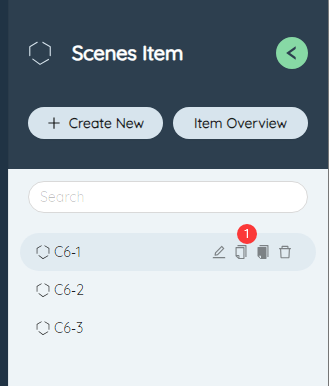
- Click the rename button to change the project name, click the check mark to confirm.
- Click the Copy button to copy the current project to a new project.
- Click the delete button to delete the current project.
# Content editing area
Double-click an item in the sidebar, and the content of the current item will be displayed in the content editing area on the right. The editing method will be explained in detail in the subsequent function description. Below the content editing area is a fixed page tab bar, and the newly opened page will be displayed at the far right. Click the tab to open the corresponding page.
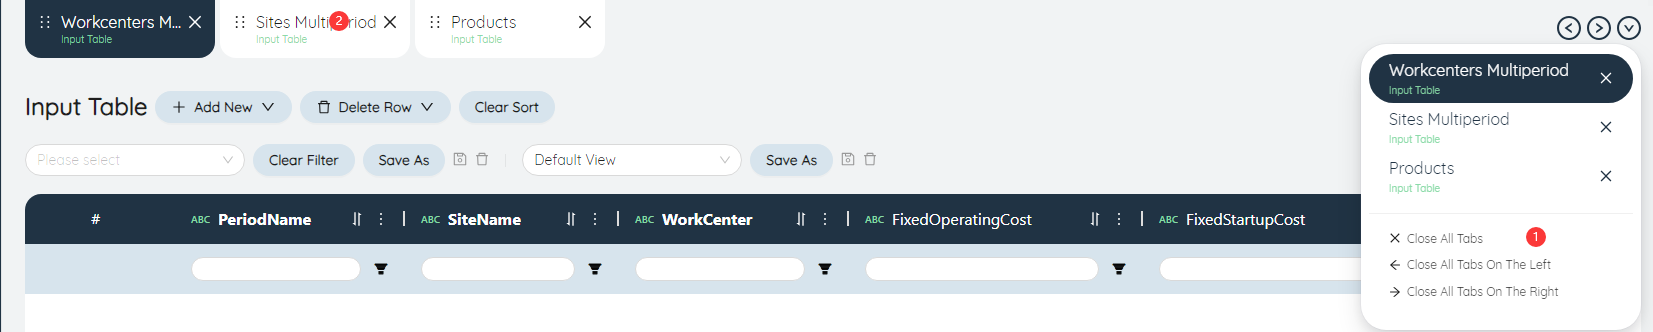
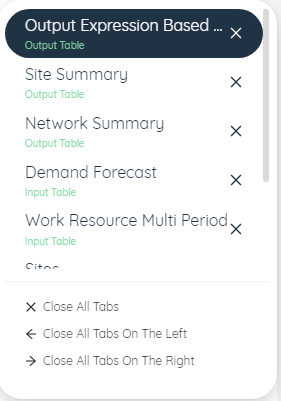
# ①Batch close button

Click to display three batch closing functions, close the current tab, close all tabs on the left, and close all tabs on the right.
# ②Page tab bar
Click a label to open the corresponding page. When there are too many labels, you can use the left and right arrows on the right to turn the page.
# ③Tab list
When there are too many tabs, you can also click the tab list button to select and switch to the tab in the pop-up window
# Model function
# Data input
# Input table
# New table
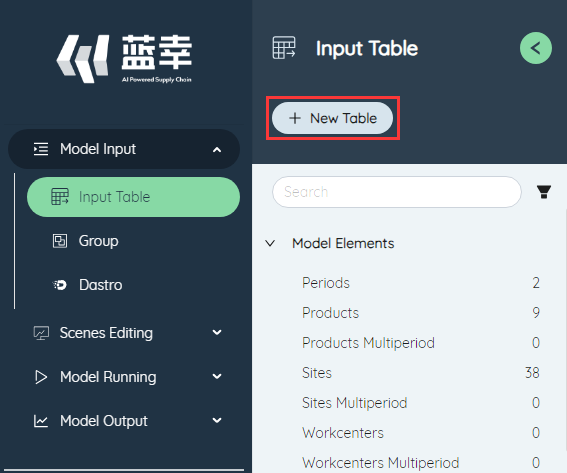
The new table function can create a new user-defined table. You can create a new user-defined table by clicking the New Table button at the top of the left navigation bar and entering the table name of the new table in the pop-up window.
# Search form
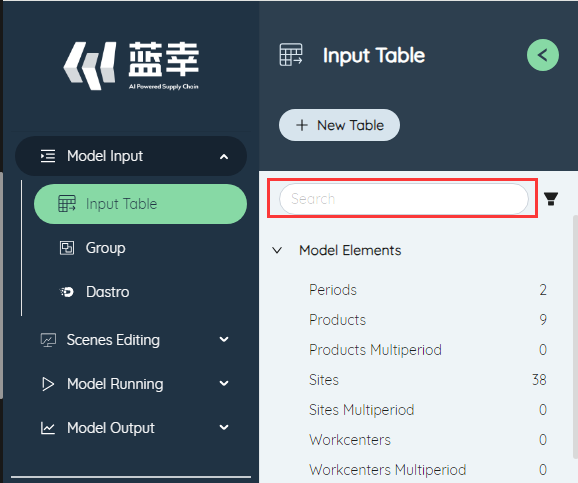
In the model input table interface, the input table can be filtered. The filter box on the left can support the user to enter keywords to search the input table, and the filter button on the right can support sorting the input table by function/type, or Hide empty table feature.
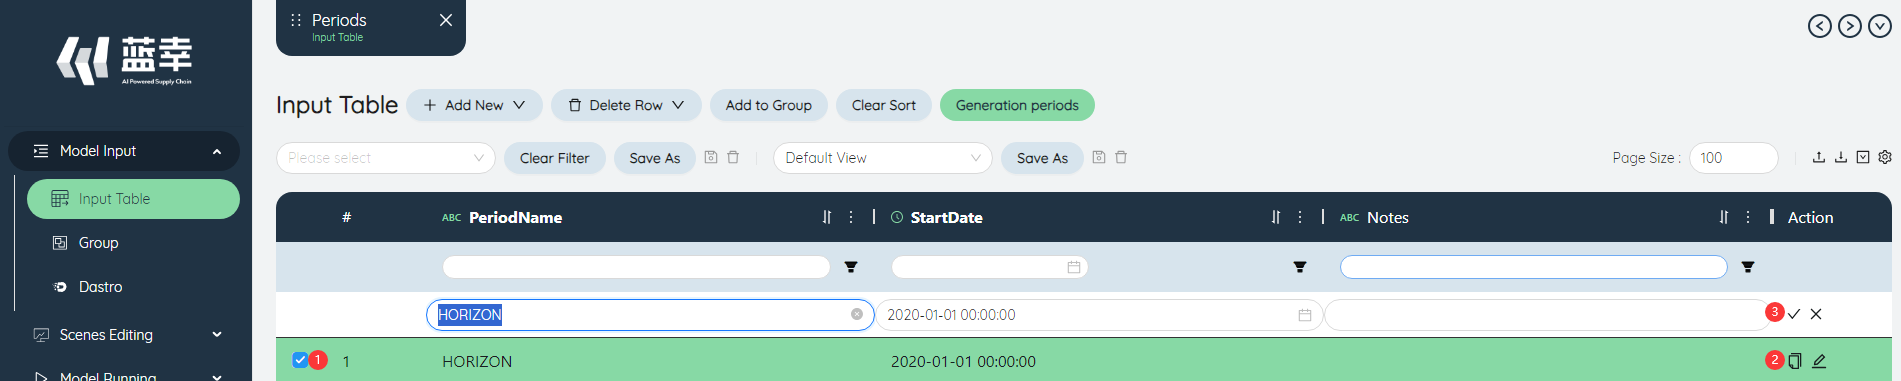
# Add row
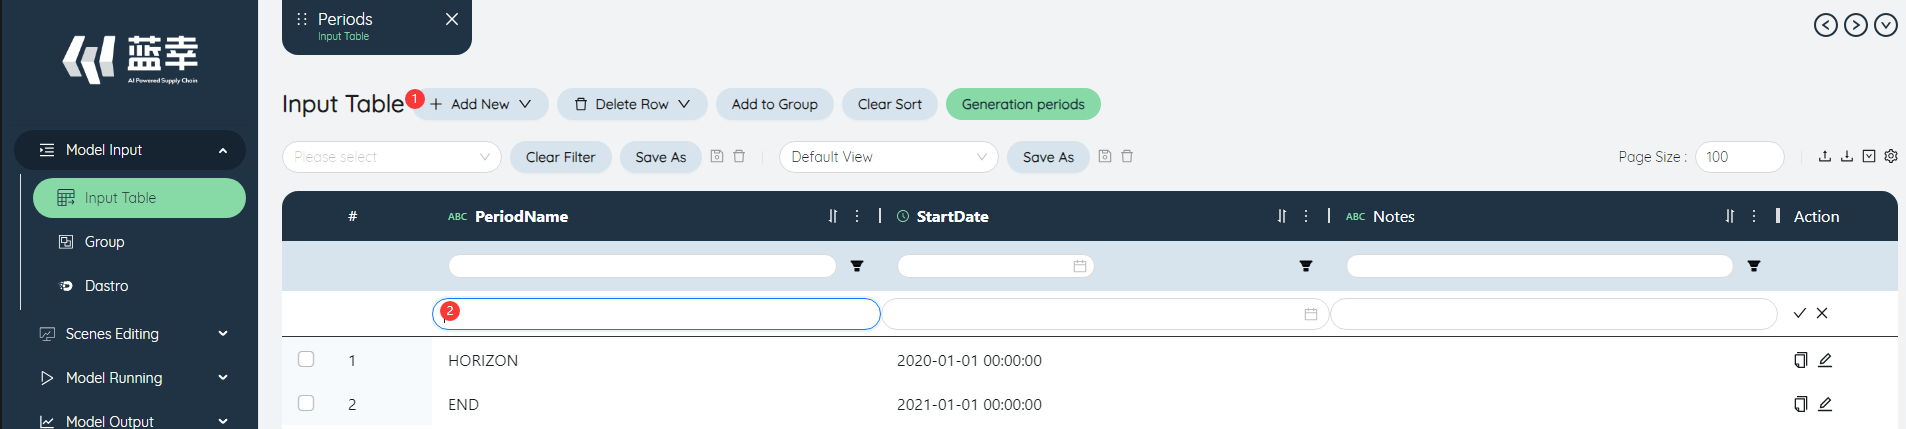
- Click the Add Row button above the table to create a new row of data.
- Fill in the new row step by step.
- Click the check mark to successfully create a new row. If you click the wrong number, the operation of creating a new row will be canceled.
# Copy row
- Check the lines to be copied.
- Click the copy row button above the table to realize the function of copying row data.
- Click the check mark to successfully copy the row. If you click the wrong number, the operation of copying the row will be canceled.
# Delete row
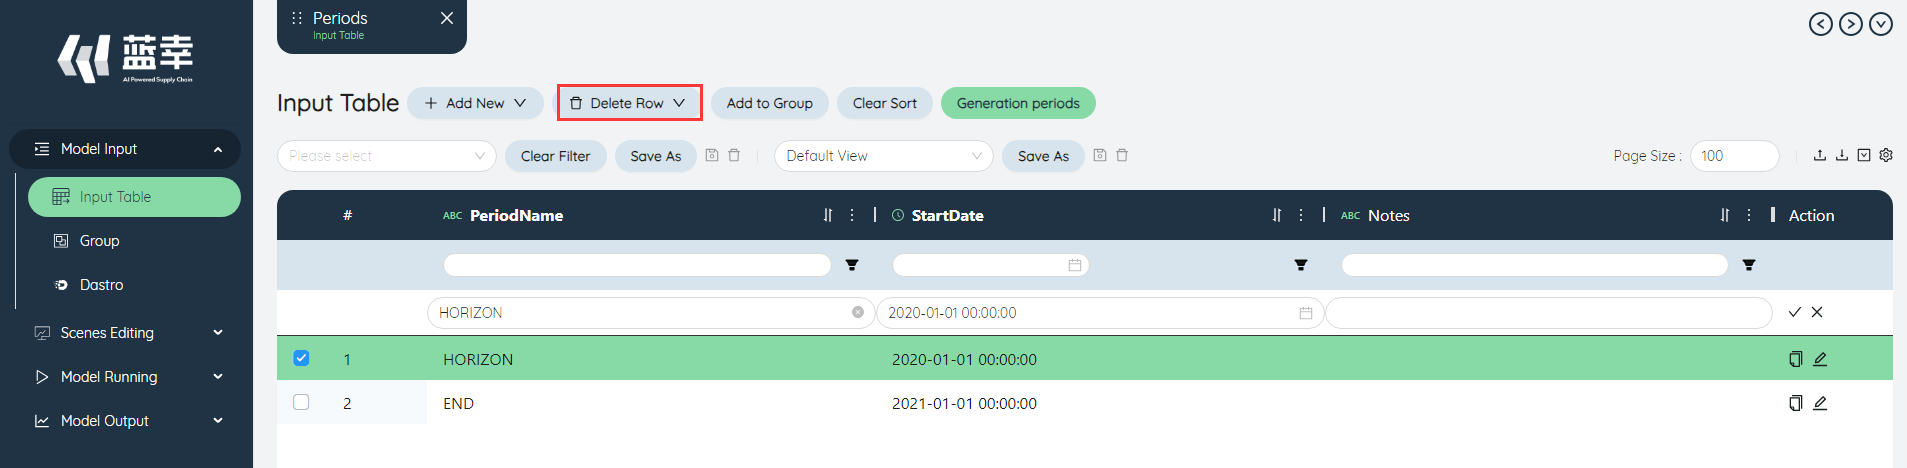

Click the delete row in the upper left corner, and select the row to be deleted in the pop-up window to delete the row.
# Add to group
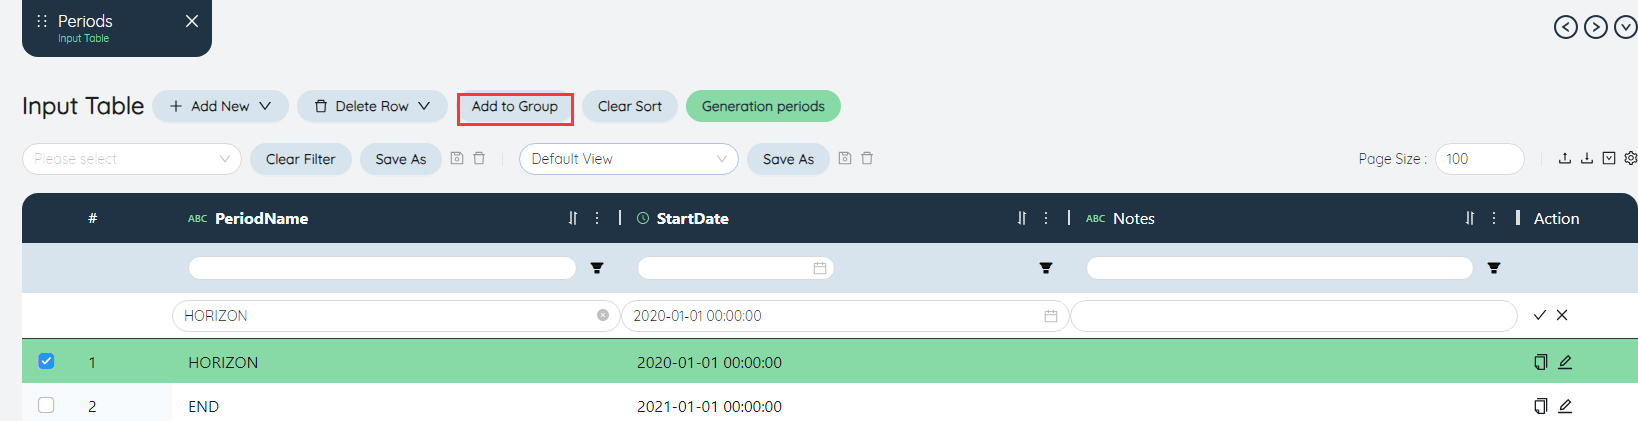
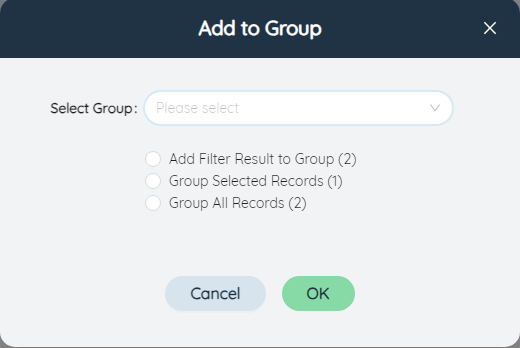
After filtering the data in the table, you can add the filtered content to the group, you can choose to create a new group or add to an existing group. If you choose to create a new group, you need to enter the group name and group type. The group type can be set to Set/Individual. You can also select records to add to the group below.
# Table filter
Table filtering can temporarily filter the data in the table.
# Filter
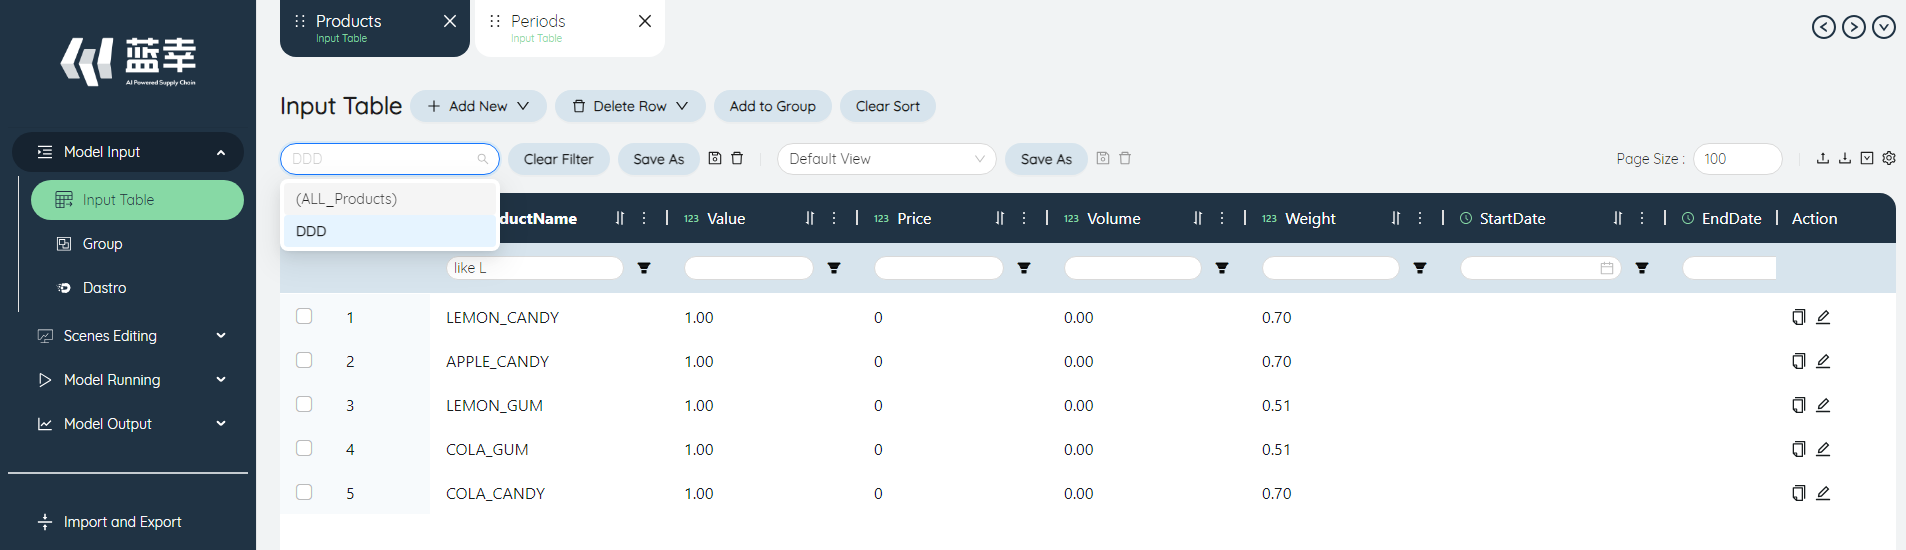
You can select a saved table filter in the upper left corner of the table, and click the name of the corresponding filter to view the filtered data.
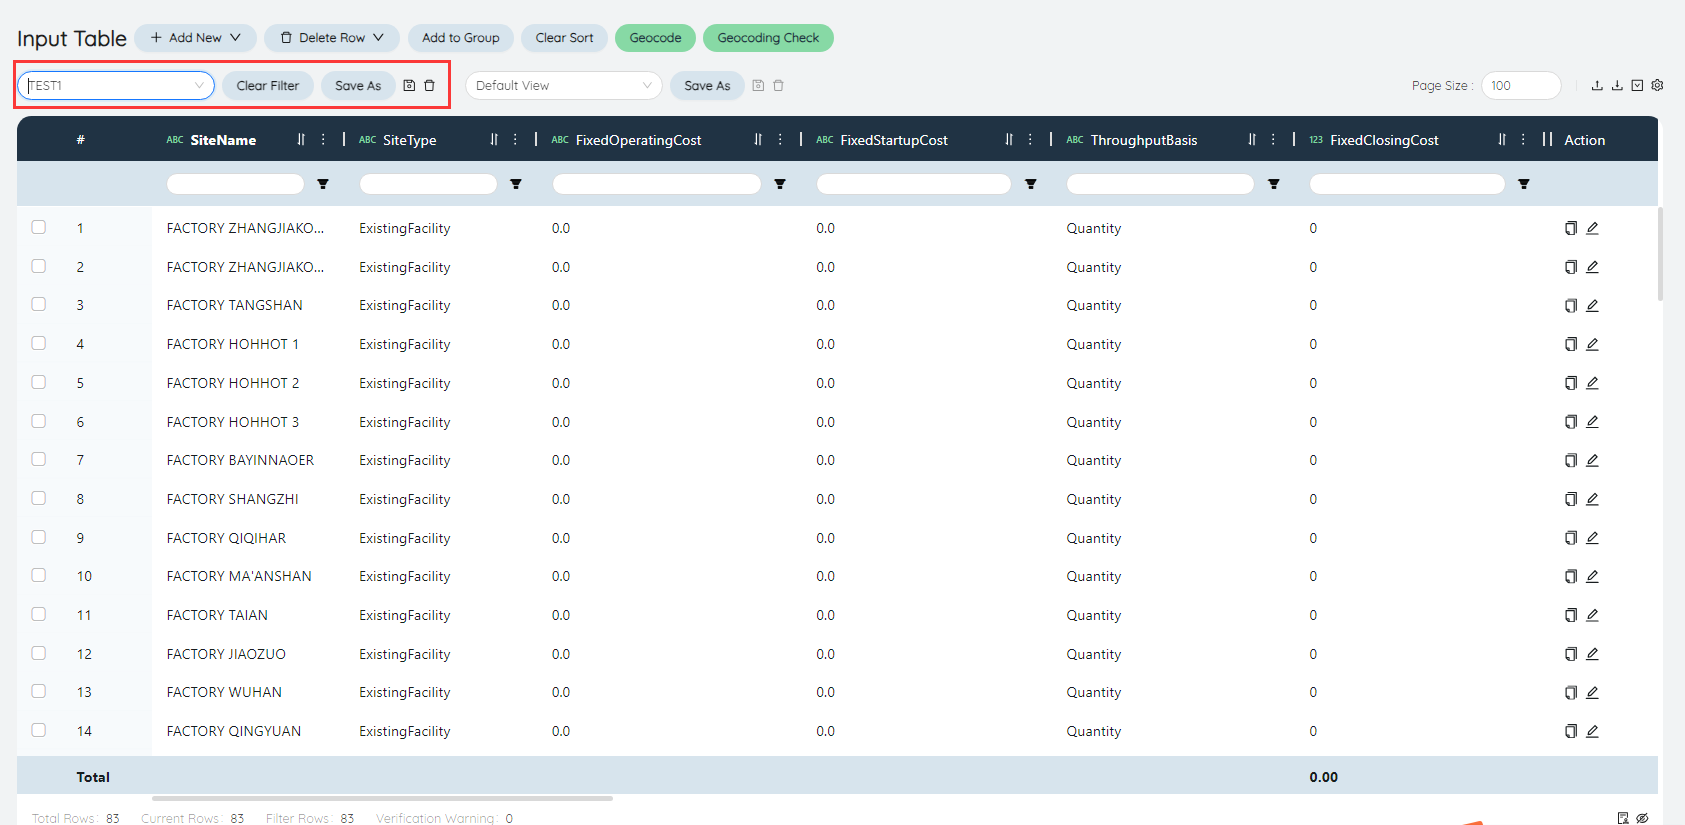
The Clear/Save Filter/Save As buttons to the right of the table filter perform various operations on the table filter.
# Table view
The table view can support modifying and saving the table display form when reviewing data.

You can select a saved table view in the upper left corner of the table, and click the name of the corresponding view to use the saved view to review the data.
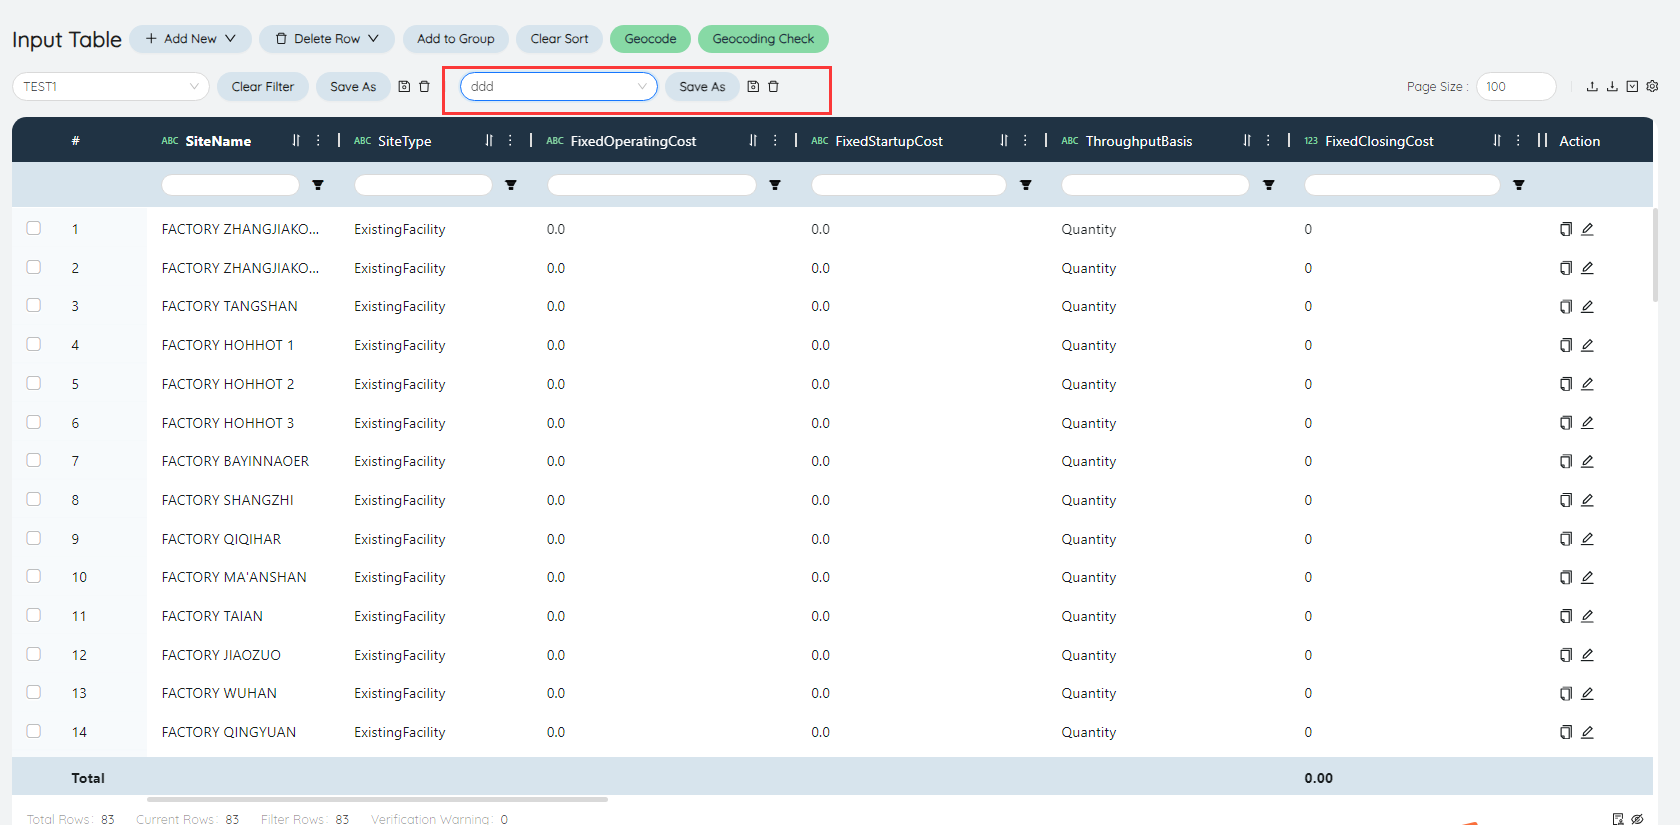
The Clear/Save Filter/Save As buttons to the right of the table filter perform various operations on the table filter.
# Table sorting

Click the sort icon on the right side of each column to perform operations such as forward/reverse order on the data in the table.
# Verify form validity
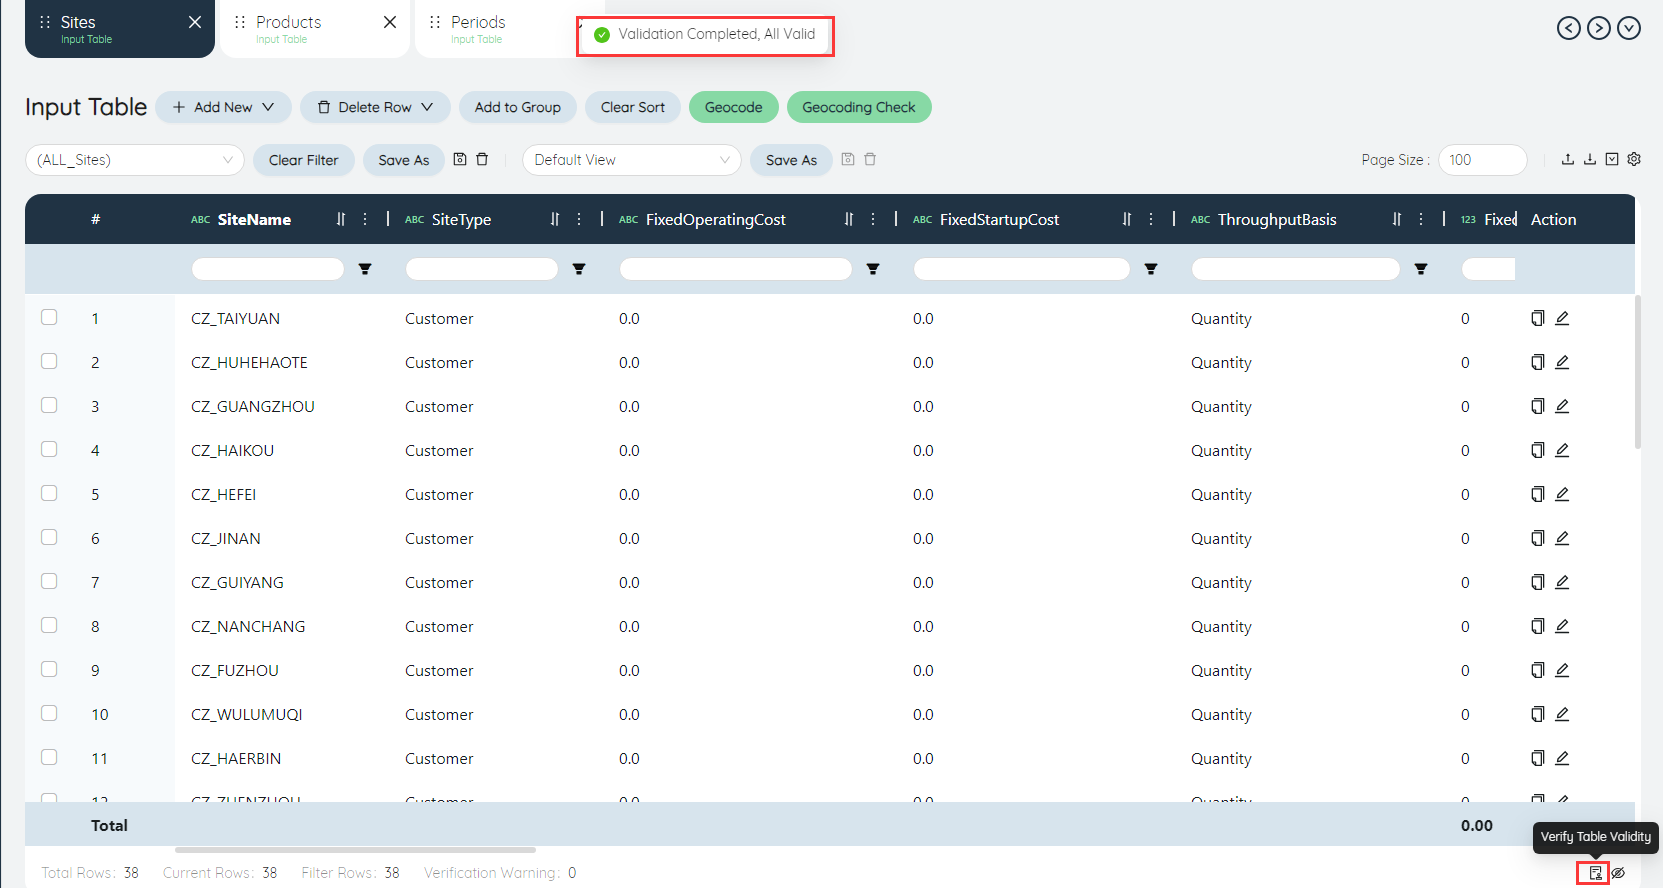
Click the "Verify Form Validity" form in the lower right corner of the form to verify the validity of the form, and the verification result will appear in a pop-up window.
# Group
# New group
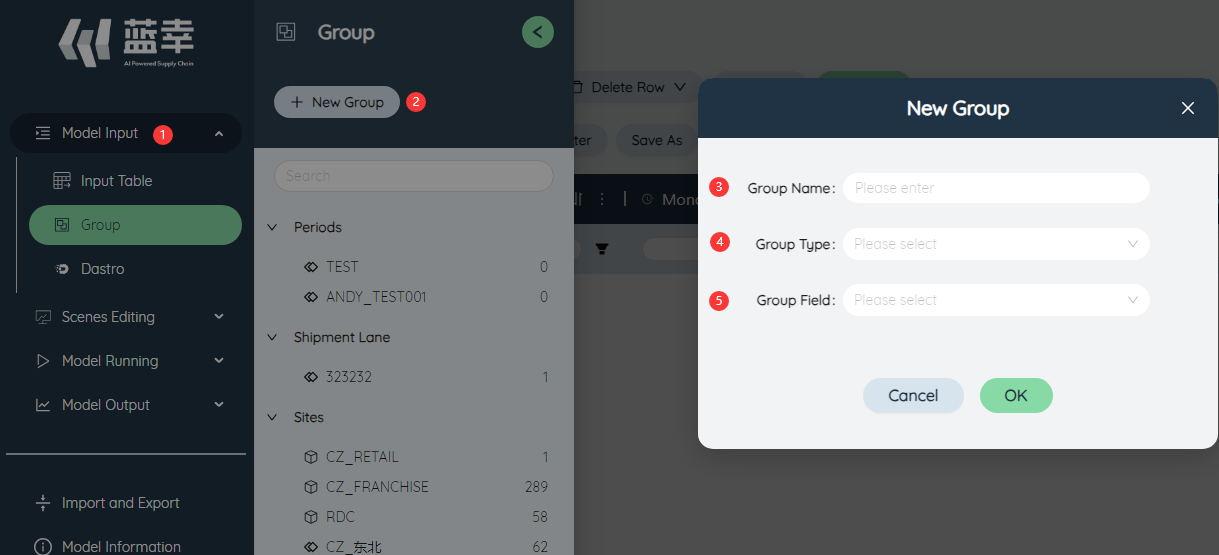
Click the Group button on the left sidebar
Click New Group
Enter group name
Select group type
Set
When used, it is equivalent to treating all elements in the group as a whole
Eg When filling in the flow restriction table, if there are 3 modes of transport for A product from MFG-CZ1: sea, train, truck, ALL_MODES_SET is their Set group.
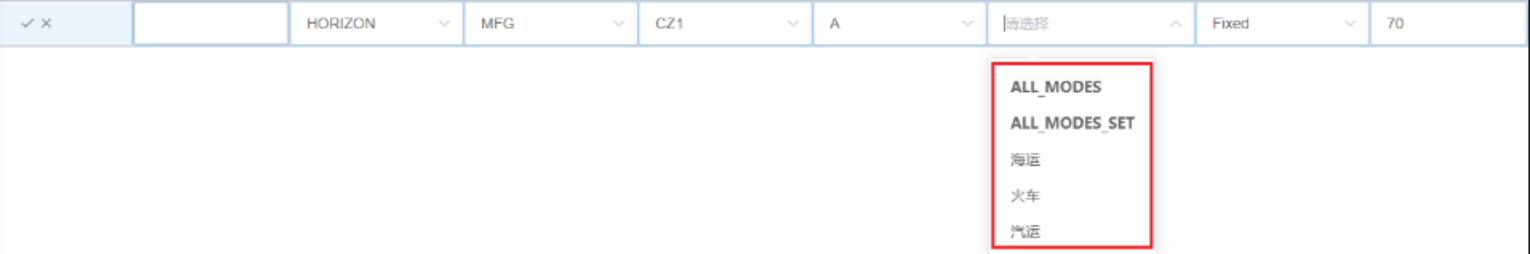
The meaning of the figure below is that the sum of the transportation volume of sea, train and automobile transportation is 70.

Individual
When used, it is equivalent to writing each element in the group as a separate line
Eg When filling out the flow restriction table, if there are 3 modes of transport for A product from MFG-CZ1: sea, train, truck, ALL_MODES is their Individual group.
The meaning of the figure below is that the volume of shipping by sea is 70; the volume of train is 70; the volume of truck is 70.

Select the table name corresponding to the group
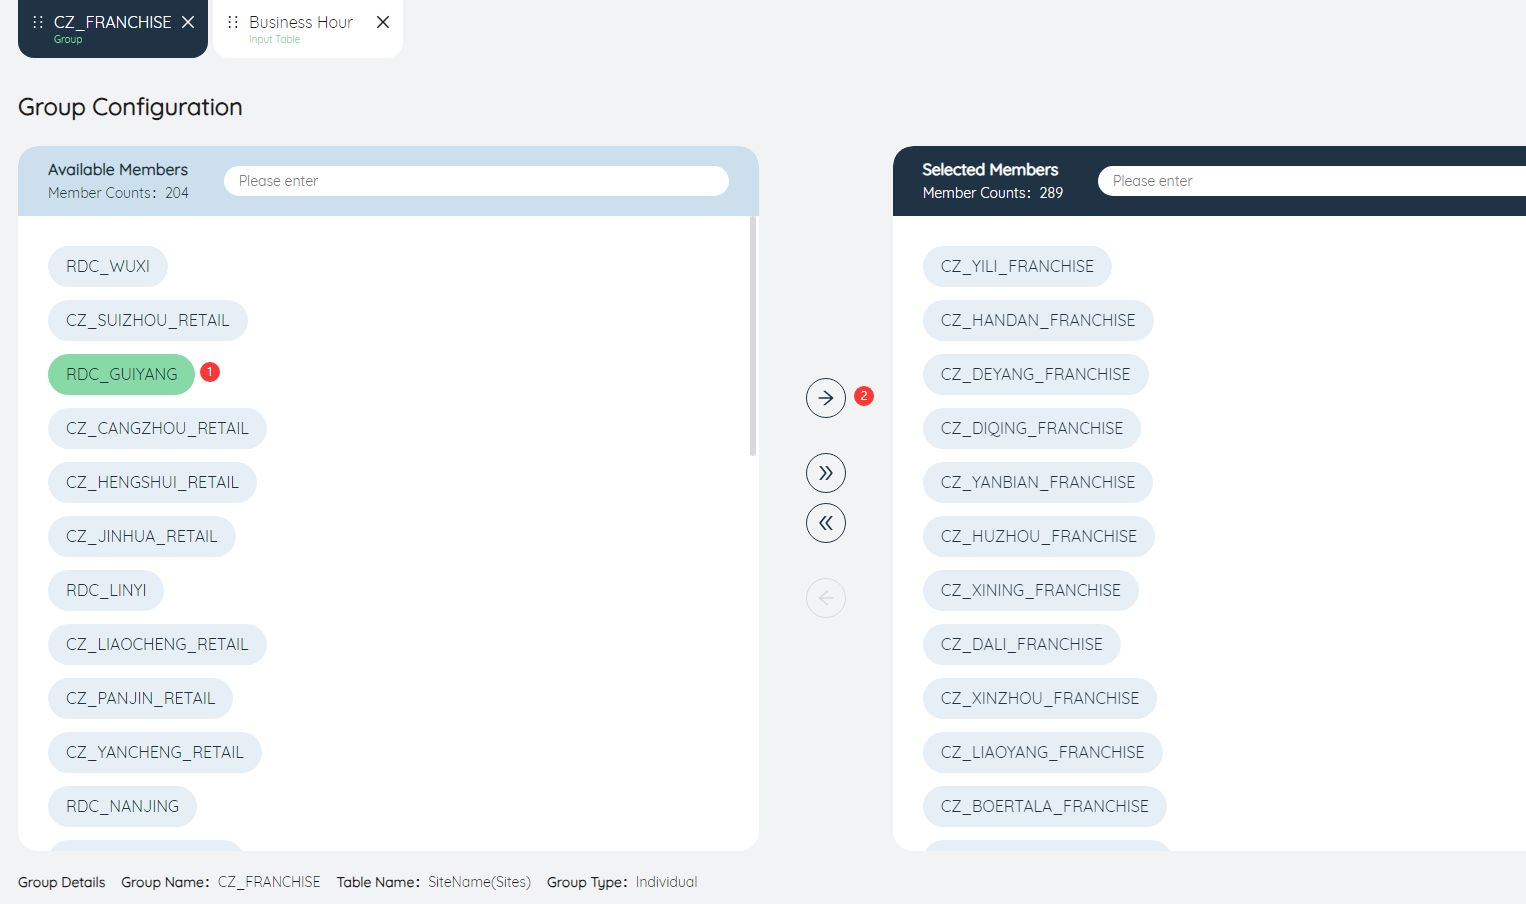
Add group members
- Search group members
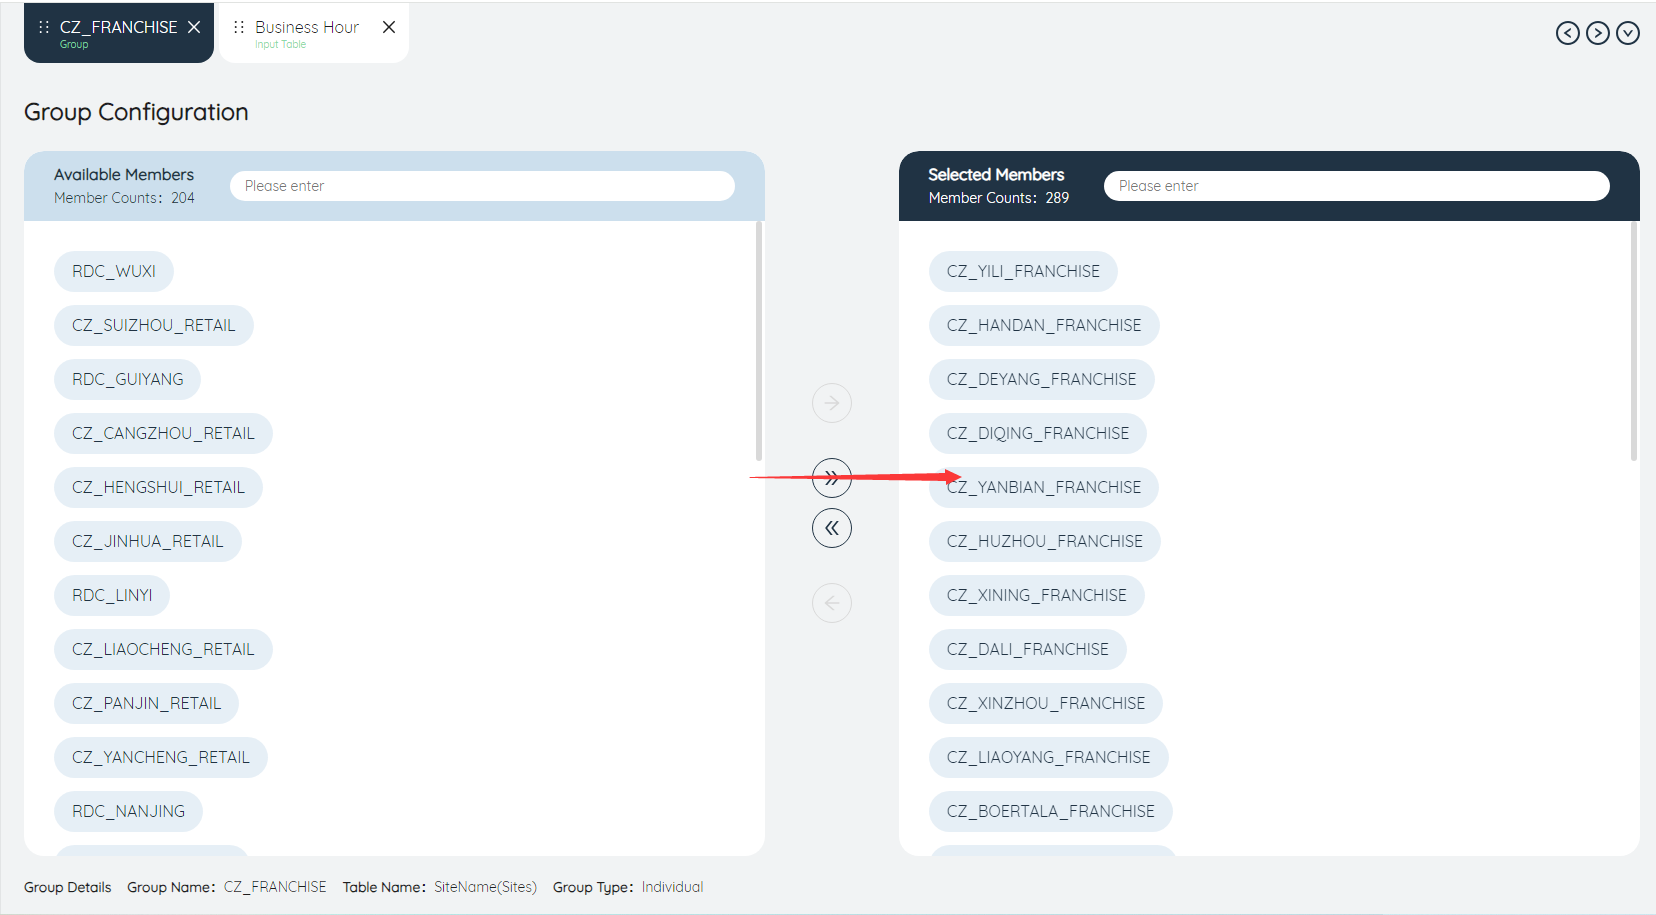
Entering a keyword in the search bar leaves the group members that contain that keyword.
Click  the button to select the search results into the group, and a group including CZ1 and CZ2 is established.
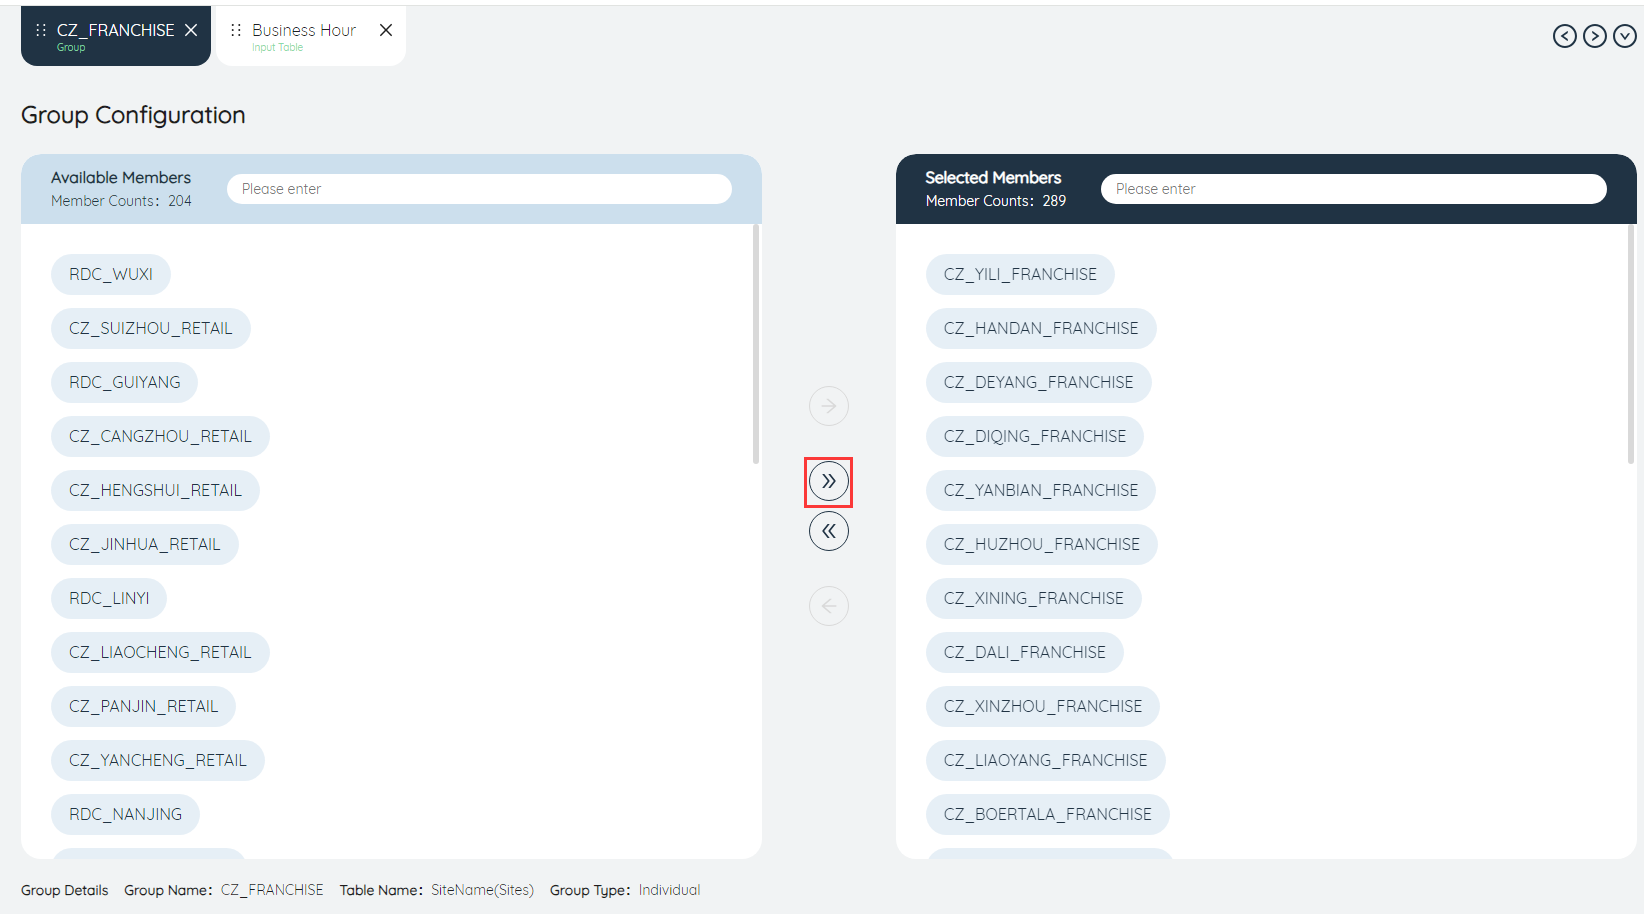
Manually select one or more group members, and then click  the button, you can also choose to join the group.
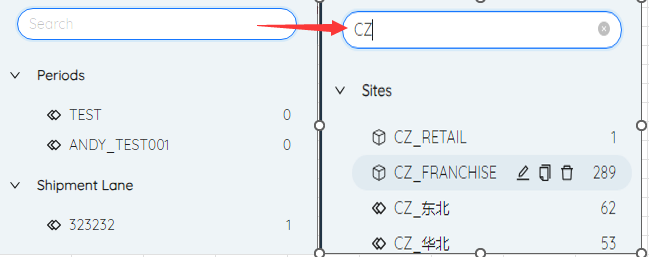
# Search group
Entering content in the search box will only display groups whose group name contains the content
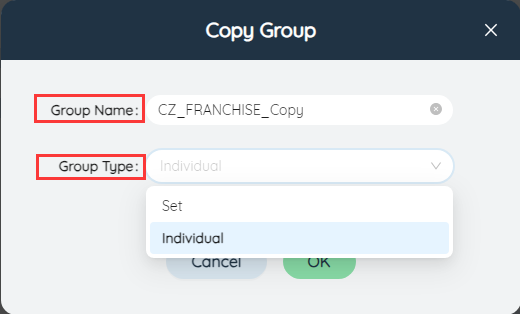
# Copy group
Click to select a group, one of the function buttons to the right of the group name is Copy, click to display the copy group menu.

In the copy group menu, you can customize the group name (the default is <original group name>_copy), and you can change the group type.
# Rename group
Click to select a group, one of the function buttons on the right side of the group name is rename, click to rename.

 : Confirm,
  : Cancel.

# Delete group
Click to select a group, one of the function buttons to the right of the group name is Delete.

# Model scenario
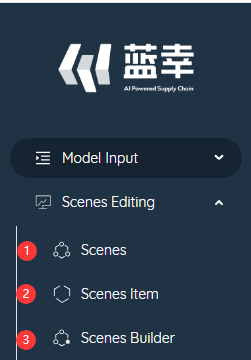
The model scenario function is the second module of the software function, and is divided into three sub-functions: ①Scenario, ②Scenario item, ③Scenario editor. The following descriptions are made separately.
# What are scenarios and scenario items
When we design supply chain optimization solutions, we often need to base on the same basic solution (or benchmark model) and consider assumptions in many different situations in order to select the optimal solution. At this time, the use of the scenario function is the most appropriate. Tool of.
For example, for the warehouse network planning model, seven regional central warehouses have been identified in Central China, East China, North China, Southwest China, and Northwest China, but for the central warehouse in Northeast China, there are still two address options: Harbin and Tongliao.
At this point, two new scenarios can be created, assuming the supply chain situation of opening warehouses in Harbin and Tongliao respectively.
- Scenario 1: Consider opening a warehouse in Harbin and closing a warehouse in Tongliao
- In the site table, change the warehouse status of Harbin to INCLUDE.
- In the site table, change the warehouse status of Tongliao to EXCLUDE.
- Scenario 2: Consider opening Tongliao warehouse and closing Harbin warehouse
- In the site table, change the warehouse status of Tongliao to INCLUDE.
- In the site table, change the warehouse status in Harbin to EXCLUDE.
Each adjustment in the above two scenarios is a scenario item, and multiple scenario items can be freely combined into any scenario, so as to facilitate the comparison of different assumptions.
# Scenarios
A scenario is a collection of modifications made to multiple input data tables. For example, in the site table, change the status of Harbin warehouse to INCLUDE, and change the status of Tongliao warehouse to EXCLUDE. Modifications made in the scenario will not directly overwrite the data in the input table, only temporary replacement is made when the scenario is selected in the model operation, so that a variety of different scenarios can be run at the same time based on one piece of data, so as to obtain a multi-to-many modeling results with different assumptions.
# New scenario
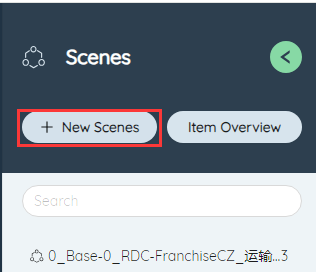
Click the New scenario button, the New scenario dialog box will pop up, and you can enter the name of the scenario. You need to be careful not to duplicate the name of the existing scenario. After the addition is successful, a prompt will pop up.

# Scenario editing
After creating a new scenario, it will automatically jump to the editing page of the new scenario. You can also double-click an item in the scenario list to enter the editing of a specific scenario.
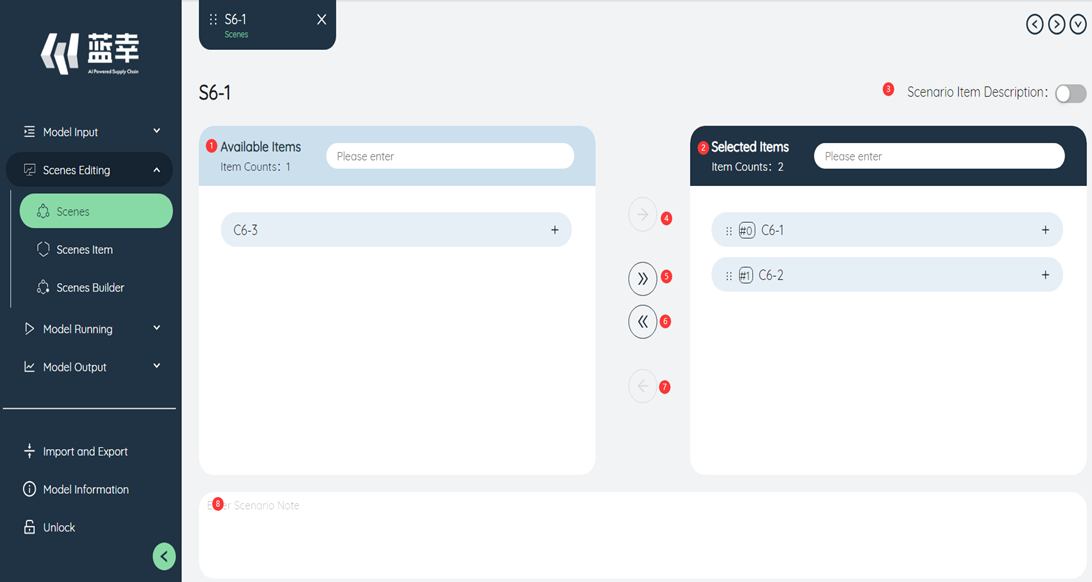
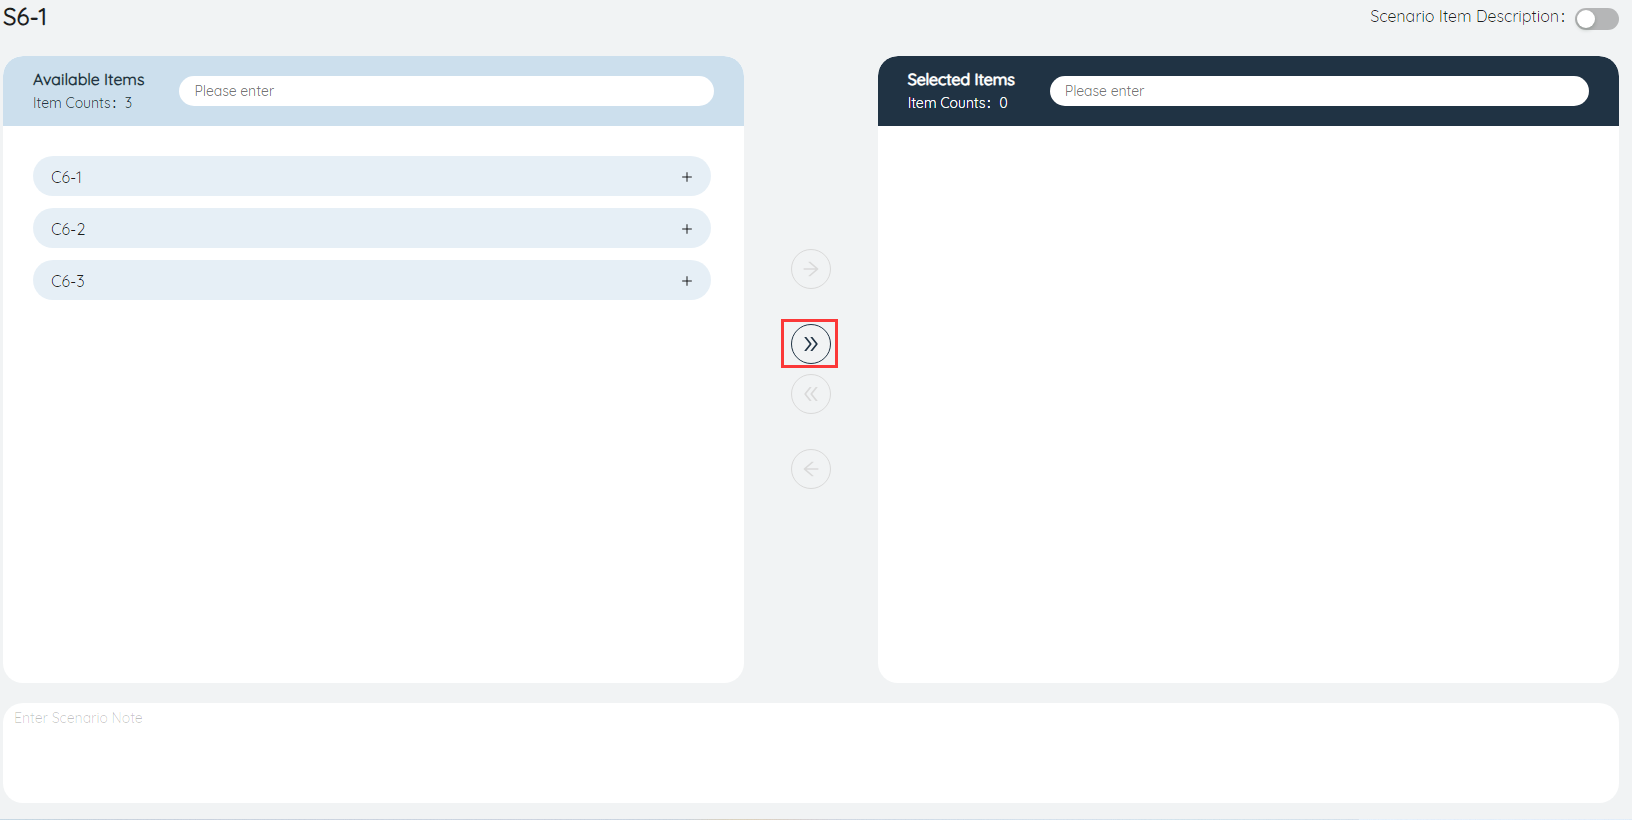
①Available items: All created scenario items in the current model. Scenario items can be filtered using the search box at the top of the list.
②Selected items: scenario items already included in the current scenario. Scenario items can be filtered using the search box at the top of the list.
③Scenario Desc: Text notes used to describe the function of the current scenario. It is recommended to add them when the scenario is complicated.
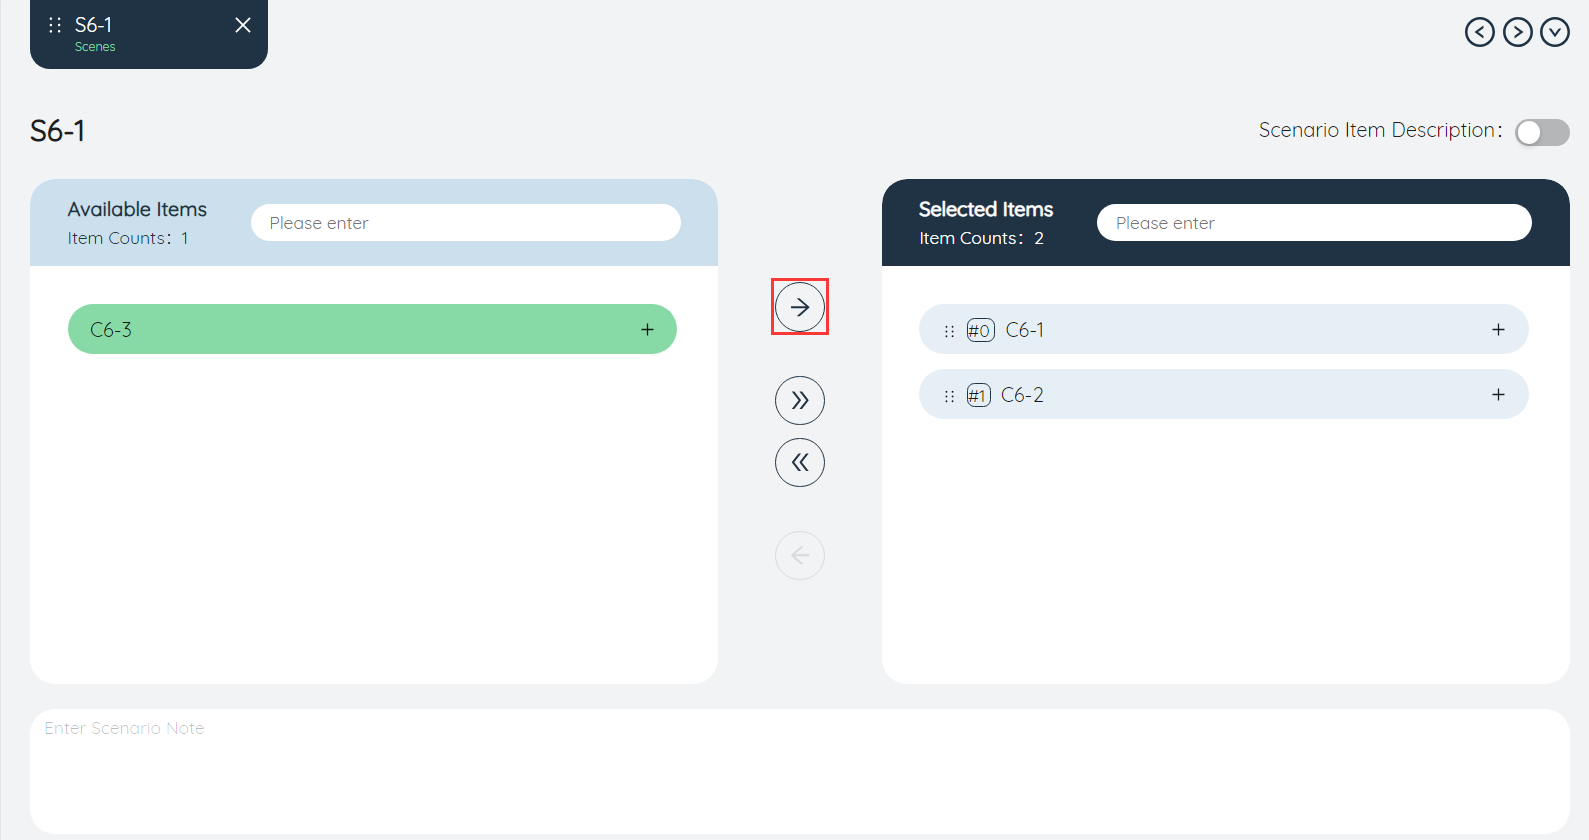
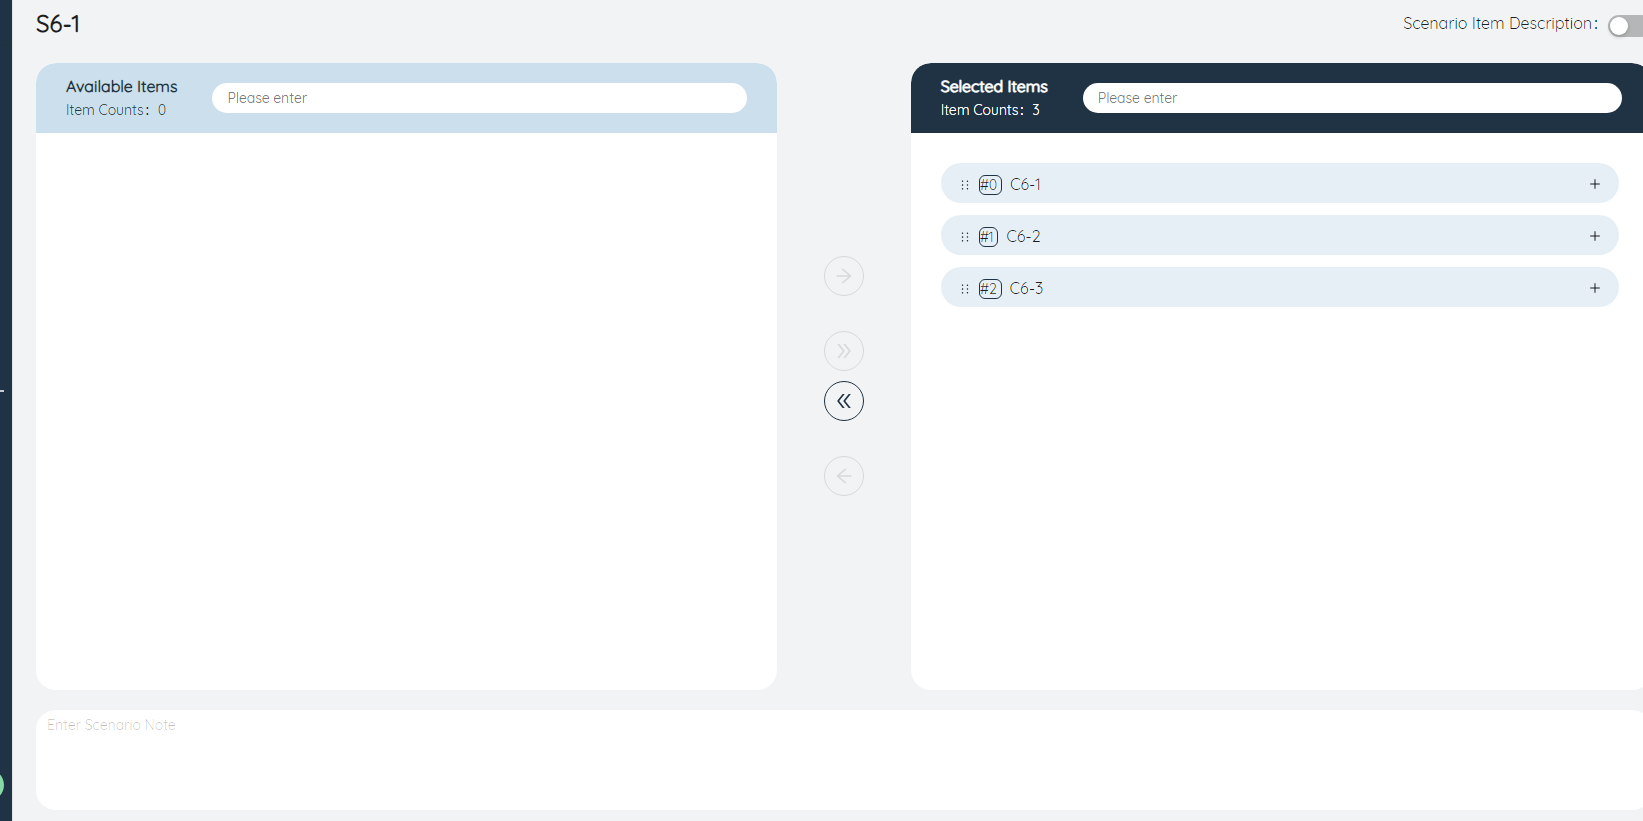
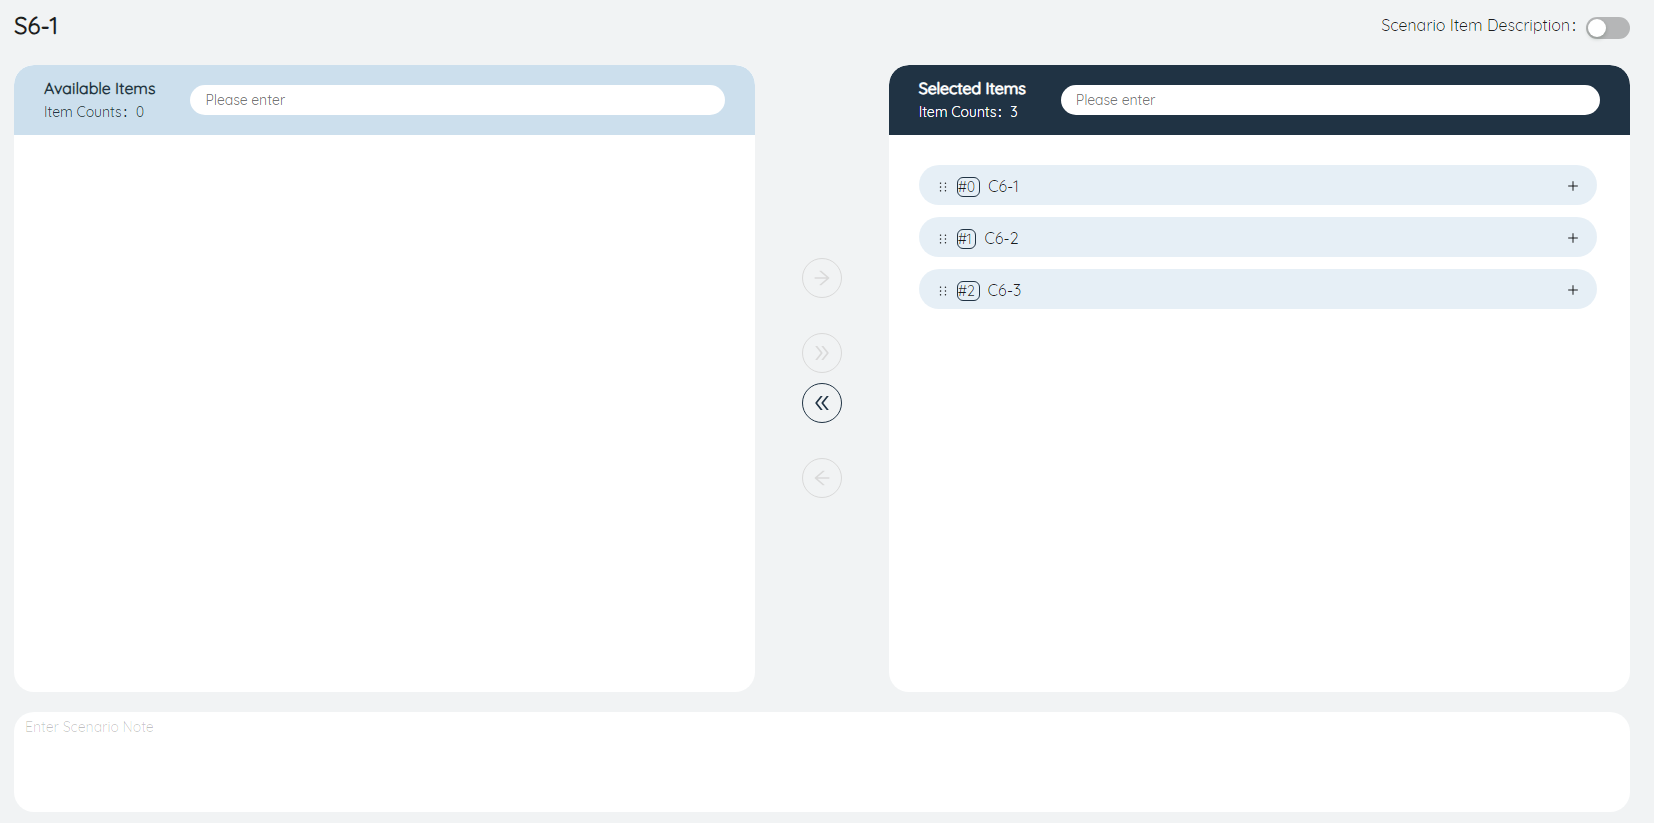
④Add selected scenario items: When one or more scenario items in the list of available items on the left are selected, click the button to add them to the selected items. As shown in the figure below, after clicking the button, the three selected scenario items are added to the selected options.
⑤Add scenario items in batches: Click this button to add all the items in the available scenario items, or all the items obtained after filtering to the selected options, as shown in the figure below, when we filter all scenario items containing 9-1 characters , click the button, they are all added to the selected options. Therefore, it is recommended to name a new scenario item regularly to facilitate screening.
⑥Delete scenario items in batches: Similar to function ⑤, you can delete all items in the selected scenario items in batches, or all items obtained after filtering.
⑦Delete selected scenario item: Similar to function ④, you can delete one or more scenario items selected in the list on the right.
⑧Scenario item description: Click to switch the on and off mode of the scenario item description. When it is turned on, each scenario item in the "Available Items" and "Options" list will display its specific function description, which is convenient for viewing details. .

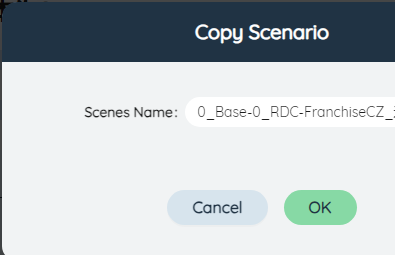
# Copy scenario item
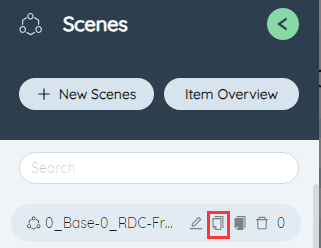
In the scenario item list, click a scenario name and select the second function in the pop-up function button on the right to copy the current scenario and all scenario items in it. In the pop-up dialog box, the copied scenario has been named "Original scenario Name_Copy" by default. Click Submit to generate a new copied scenario.
# Rename scenario item

Use the first function button on the right side of the scenario list to modify the name of the current scenario. After modification, press the check mark  to confirm, or use the wrong number to
  cancel.

# Delete scenario item

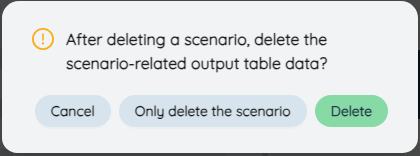
Use the third function button on the right side of the scenario list to delete the current scenario. If the current scenario already has the corresponding model output data, in the pop-up dialog box, you need to confirm "Delete scenario only" or "Delete data" at the same time , select "Delete scenario Only", only this scenario will be deleted, and the data related to this scenario in the output table will still be retained. If "Delete Data" is selected, this scenario and the data related to this scenario in the output table will be deleted. Click "Cancel" to cancel this deletion.
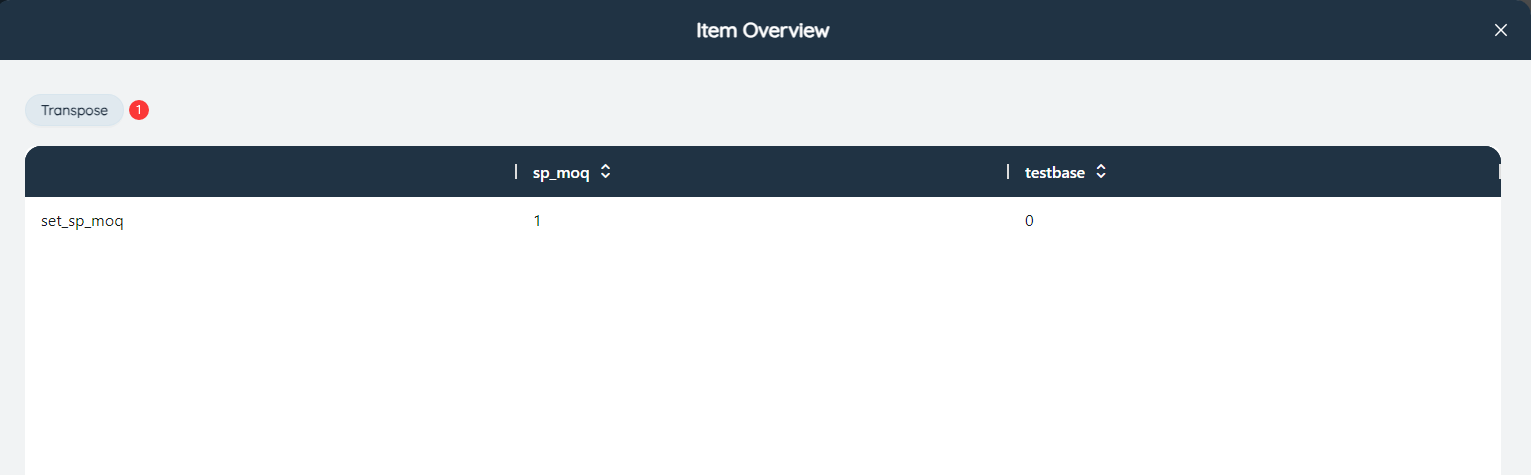
# Item overview
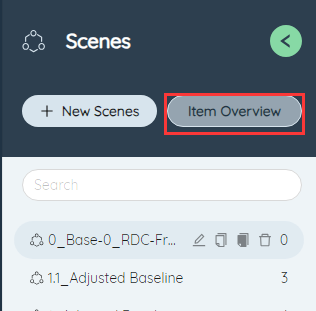
Using the object overview function, you can easily view the containment relationship between multiple scenarios and scenario items. In the pop-up object overview dialog box, each row is a scenario item, each column is a scenario, and the data at the intersection of the row and column is 1, which means that the scenario corresponding to the column contains the scenario item corresponding to the row, and 0 means not. You can also use the ①"invert" function to exchange row and column data for viewing.
# Scenario item
Scenario items are items that are included in a scenario to modify specific data in an input data table. For example, changing the status of the row of data in the Harbin warehouse in the site table to INCLUDE is the basic unit of the scenario.
# New scenario item
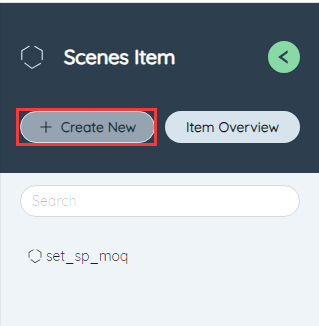
In the scenario item function module, click the New button, enter the name of the new scenario item in the pop-up window and submit it to create a new scenario item. Note that it cannot have the same name as an existing scenario item.
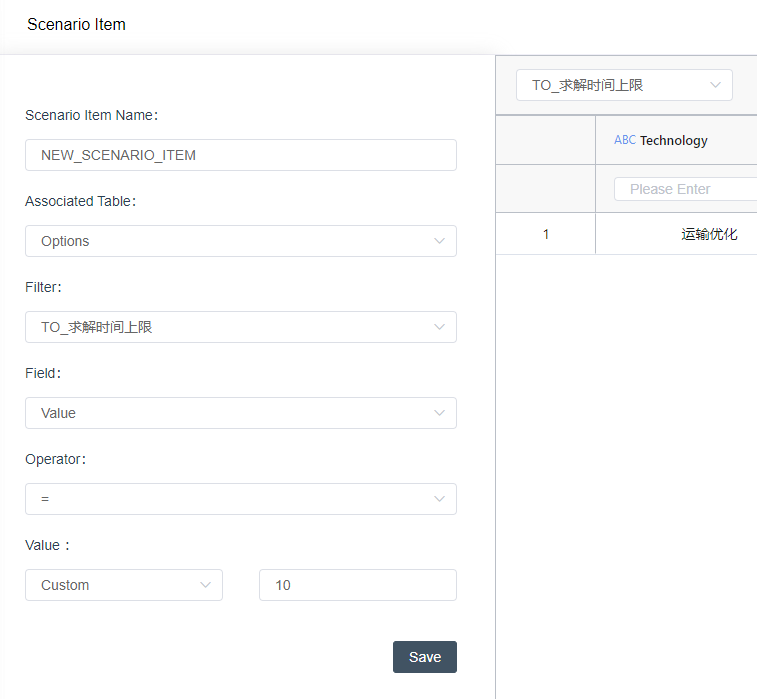
# Scenario item editing
After creating a new scenario item, its editing page will be opened automatically, or double-clicking the list of existing scenario items can also open the editing page. The following describes the editing functions respectively.
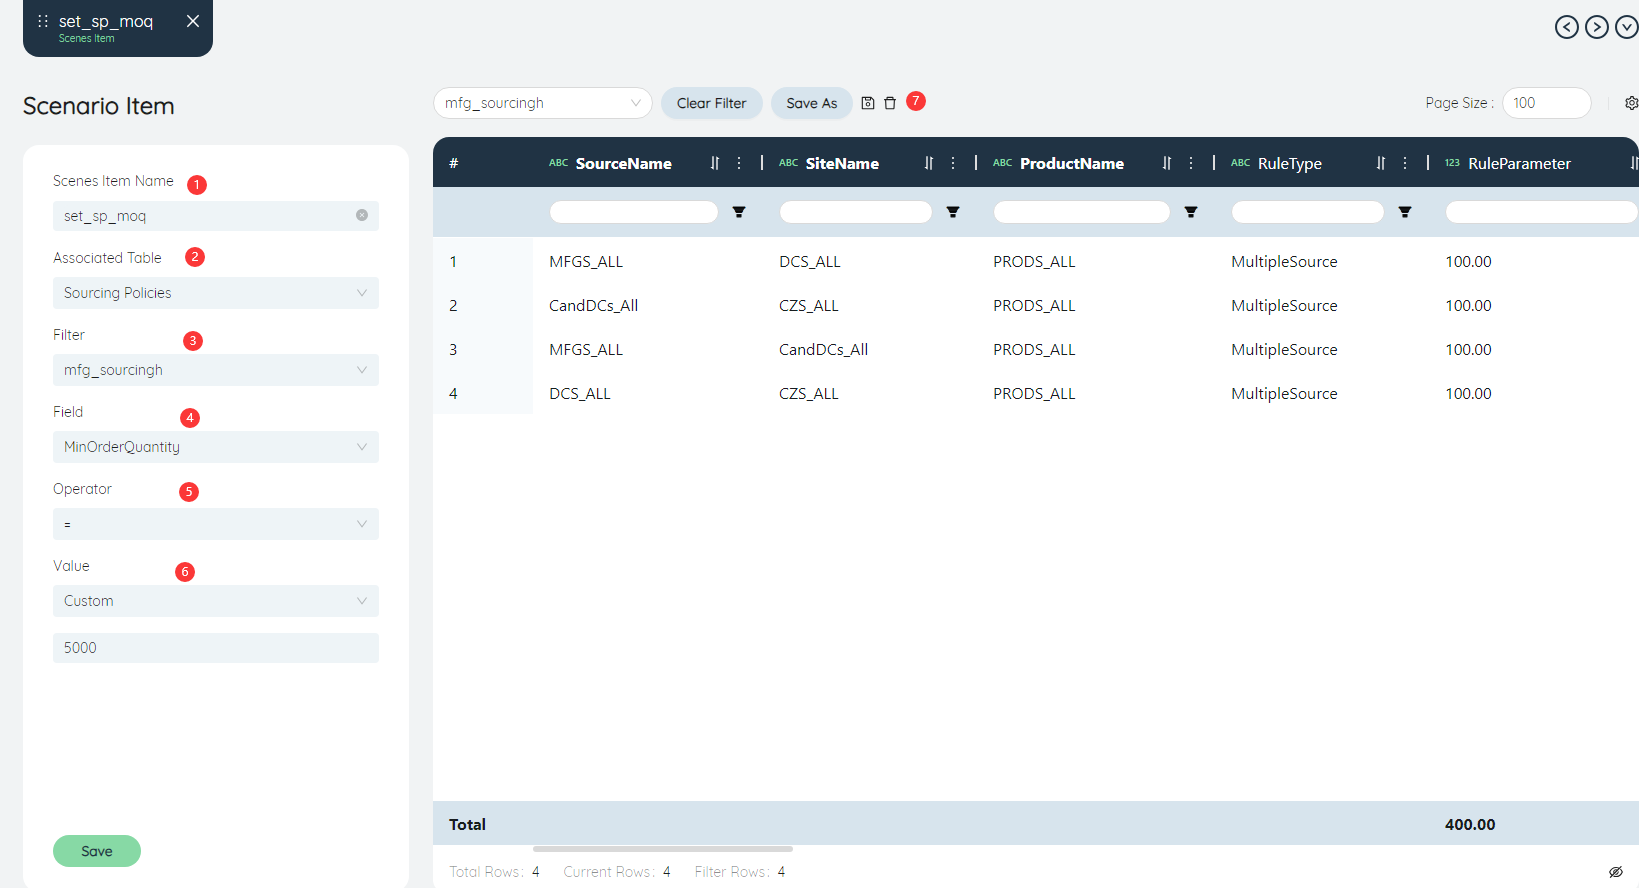
①Scenario item name: You can modify the name of the current scenario item again.
②Associated table: Each scenario item can only be associated with one table, and can only modify the data in one table. After selecting the associated table, the table interface on the right will also display the data of this table synchronously.
③Filter: It is used to locate the data row in the associated table. Only after the selected data is filtered, the value will be modified. After selecting different filters, the filters in the table on the right will also be transformed synchronously, and the filtered data will be displayed.
④Field: used to select the field in the table to be modified by this scenario item.
⑤Operator: Based on ②The selected Associated table, ③Select the filtered data row, ④Select the modified field, we have located the position of the specific value that needs to be modified. The operator is used to determine the modification method of the value.
- Character field, Boolean field: optional equals (=).
- Date field: optional =, +, -, where addition and subtraction can be used for date calculation
- Numeric fields: optional =, +, -, *, ÷, for mathematical operations.
⑥Value: optional default value, custom.
- Default value: resets the selected value to the default value, this option is only available for fields with default values.
- Custom: Enter a numerical value or character value of your choice.
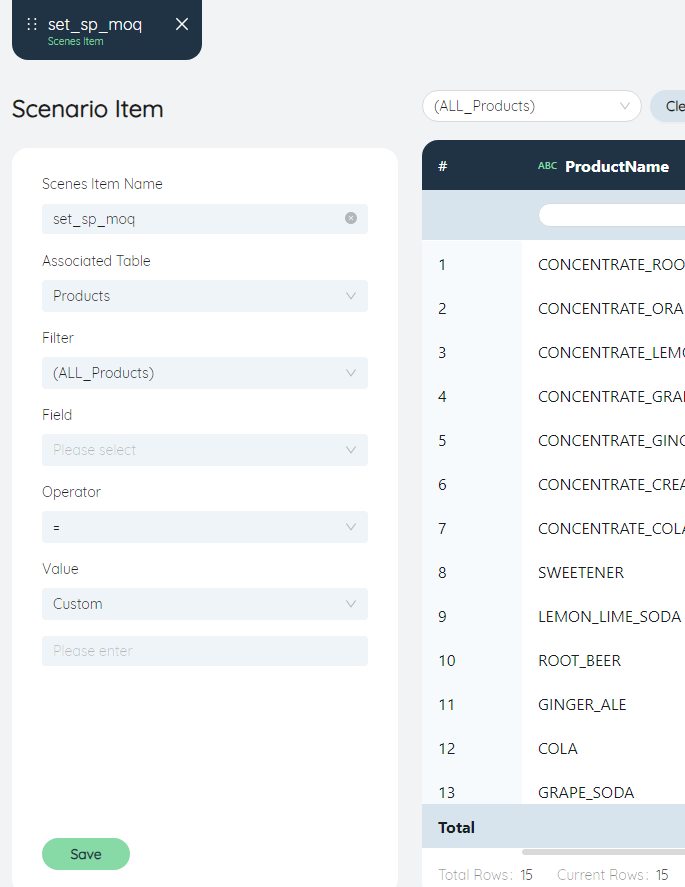
⑦Data table preview area
You can view the effects of different Associated tables and filter selections in real time, or you can create and use filters directly in the table area.
Using different combinations of options, scenario items can be used to create a variety of different modification effects. E.g
- In the station table, filter out the newly added stations and set them as INCLUDE in batches.
- Associated Table: Site
- Filter: ALL_NEWDCS
- Field: Status
- operator: =
- Value: INCLUDE (custom)
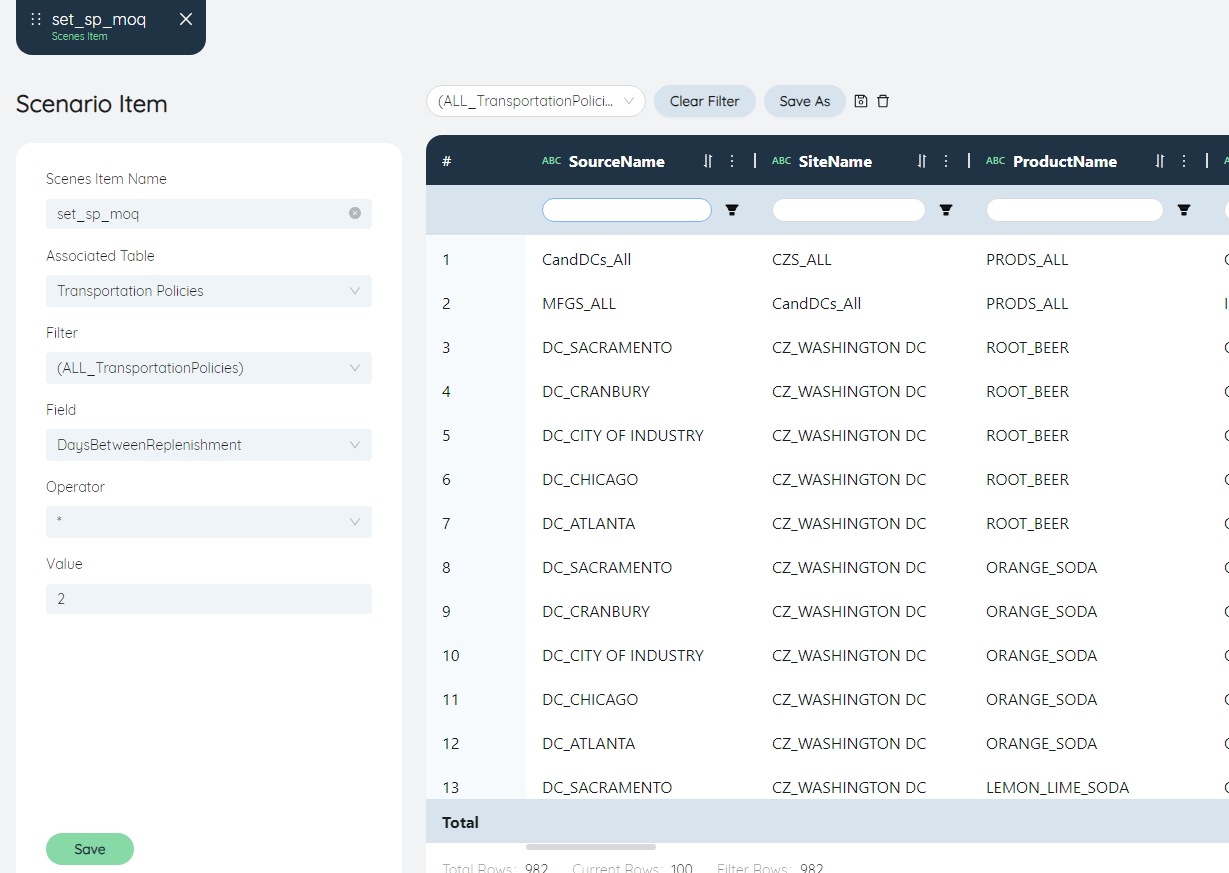
- In the shipping strategy table, multiply the number of days between replenishment in all shipping strategies by 2.
- Associated Table: TransportationPolicies
- Filter: (ALL_TransportationPolicies)
- Field: Days between replenishment
- operator: *
- Value: 2
In the Associated table, in addition to the input data table, three tables of group, group members, and model options can also be selected for editing. For example selecting the model option can
- Modified the solution time upper limit (minutes) for the transportation optimization algorithm in the model options to 10 minutes.
- Associated Tables: Options.
- Filter: TO_solve time upper bound
- field: value
- operator: =
- Value: 10 (custom)
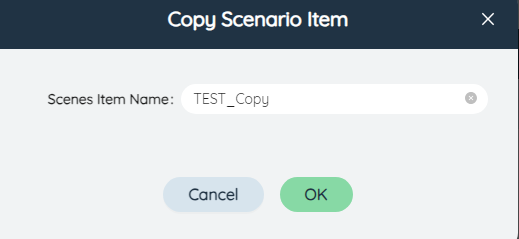
# Copy scenario item
In the scenario item list on the left, click a scenario item, three operation buttons will be displayed, the second one is the copy button, click copy, and confirm the copied name in the pop-up dialog box and submit it. Duplicate as new scenario item.
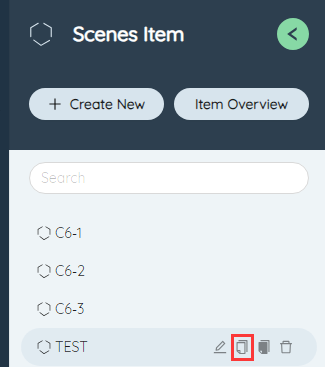
# Rename scenario item
The first one is the rename button, click to edit the scenario item name, click the check mark to confirm.

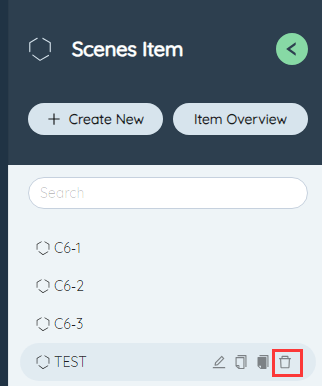
# Delete scenario item
The third button is the delete button. After clicking and confirming in the pop-up window, the current scenario can be deleted.
# Item overview
Same as the Object Overview feature in the scenario feature.
# Scenario editor
Through the scenario and scenario item functions, you can customize different values for each table and each field. However, when a scenario needs to be adjusted a lot, for example, for a new site, it is necessary to make changes simultaneously in the site table, production strategy table, procurement strategy table, transportation strategy table, etc., and a large number of scenario items need to be created.
The scenario editor can use a set of parameters and conditions at one time to generate multiple scenario items and put them into a scenario, which can speed up the editing of complex scenarios.
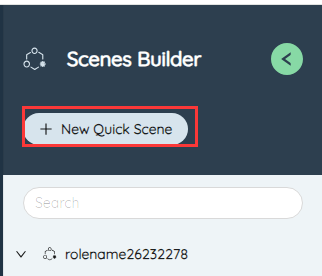
# New quick scenario
In the scenario editor function module, click New Quick Scenario, enter the name in the pop-up dialog box and submit it to create a new Quick Scenario. A quick scenario can contain multiple parameter combinations, and the names of quick scenarios cannot be repeated.
# Quick scenario list
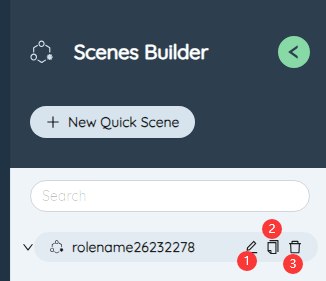
Below the title of the scenario editor is a list of quick scenarios. Each quick scenario and the right side of the parameter combination will have three function buttons: ①Edit, ②Copy, ③Delete.
- Edit: Edit the name of the current quick scenario and parameter combination.
- Copy: Copy the current quick scenario or parameter combination, and the names are not allowed to be repeated.
- Delete: Delete the current quick scenario or parameter combination.
After creating a new quick scenario, it will jump to its editing page by default, or you can double-click to select a quick scenario and edit it. There are three available functions: ①Create a new parameter combination, ②Save a quick scenario, ③Save as a normal scenario.

# New parameter combination
A parameter combination is a combination of conditions and parameters. Click the button to pop up the dialog box of creating a new parameter combination
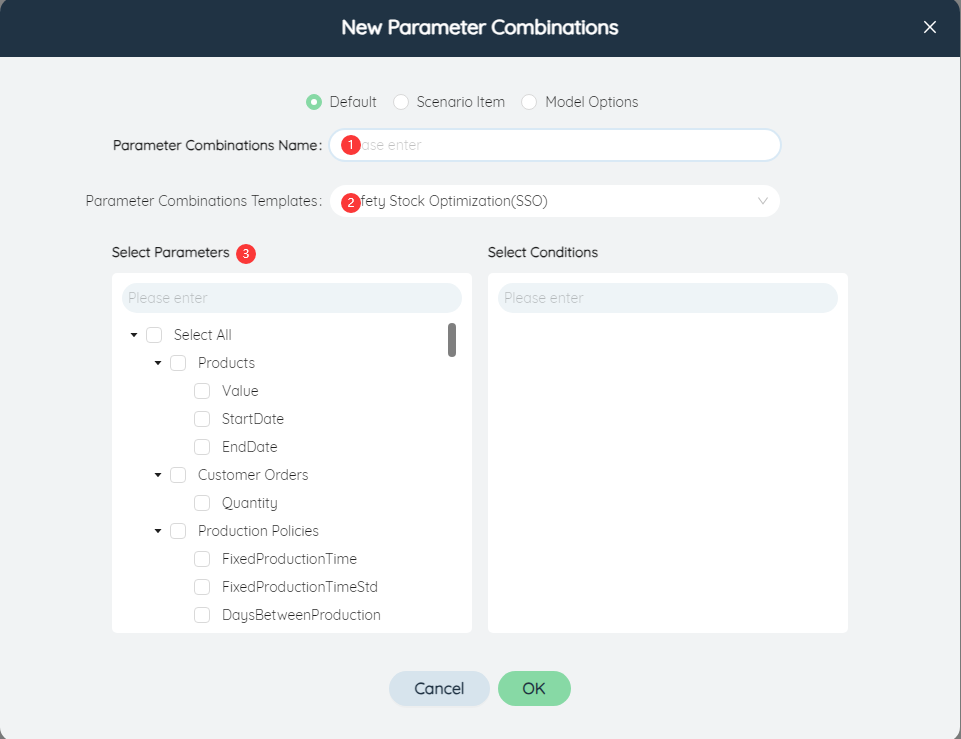
①Parameter combination name: Enter the name of the parameter combination, which cannot be the same as other parameter combination names.
②Parameter combination template: The template limits the range of parameters that can be selected. Currently, it supports the safety stock optimization template, including the model parameters commonly used in the inventory model, as well as customization (including all parameters).
③Select parameters: All fields that can be adjusted in the model input table can be used as parameters. In the selection parameter list, you can check one or more parameters. The list contains two levels of items, the first level is the name of the data table, and the second level is the fields (that is, parameters) in the data table. Check the table name to select all the parameters in batches. All parameters can also be selected or deselected through the Select All function.
④Choose condition: The list content of the selection condition is related to the selected parameter
- When selecting parameters in the same table: the condition is the parameters that are not checked in the same table.
- When selecting parameters in different tables: the condition is the intersection of unchecked parameters in different tables.
For example, select the end time and start time in the product table, and select the quantity in the customer order table. The optional conditions are product name, custom 1, custom 2, remarks, status. These 5 fields are parameters that exist in both data tables and are not selected.
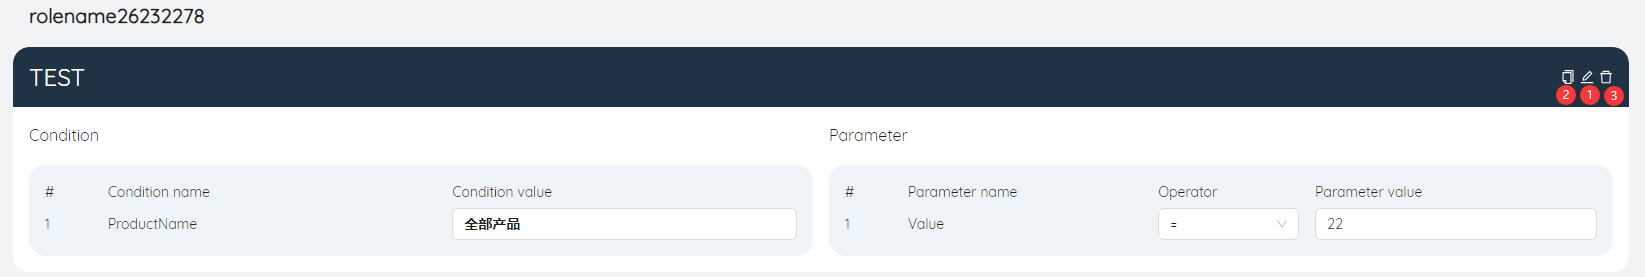
# Parameter combination definition
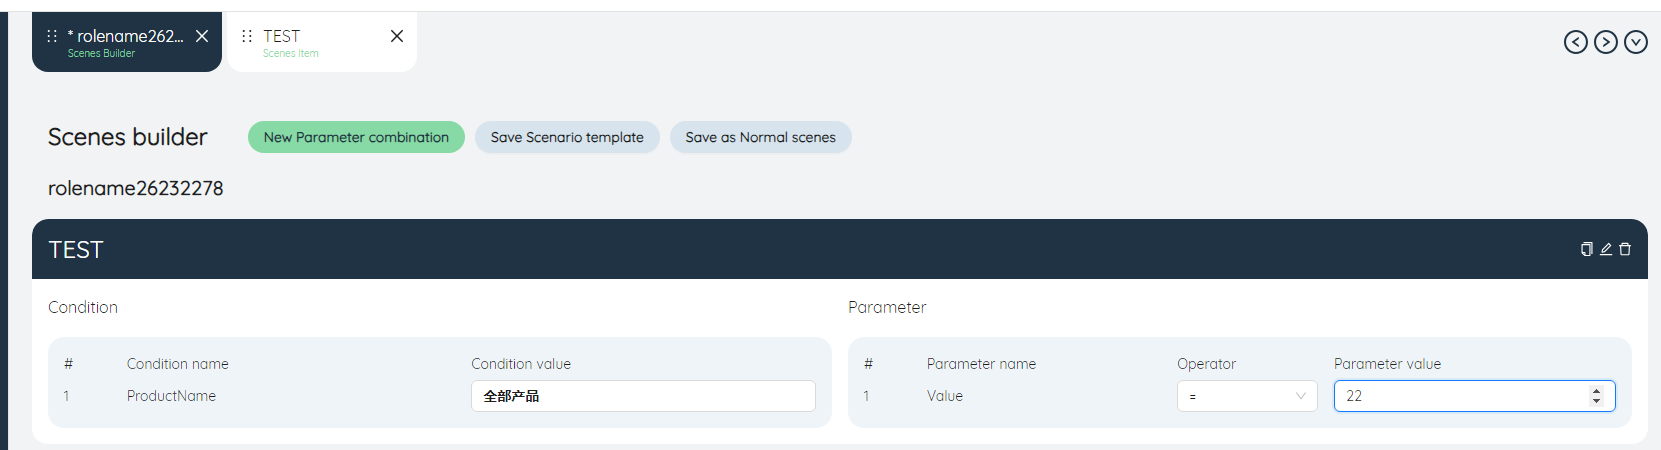
For each newly created parameter combination, conditions and parameters can be defined in the right panel
- Condition: Select the condition value for each condition, each condition value determines the filter scope for that condition. Conditional values can select a single value for the field, a related group, or a filter in its corresponding table. Because the condition is a common field in the table where multiple parameters are located, the single value that can be selected by the condition is also common in multiple tables.
- Parameters: select the operator and parameter value of each parameter, each parameter corresponds to a common scenario item, its Associated table is determined by the parameter itself, the filter is determined by the combination of multiple conditions, the field is the parameter itself, and the operator And parameter values can be set like scenario items.
Edit, copy and delete parameter combination: There are three function buttons on the right side of each parameter combination name, which can ①Edit, ②Copy, and ③Delete the current parameter combination.
Edit: Click to pop up the parameter combination editing dialog box, you can re-select each part of the parameter combination.
Copy and Delete have the same functions as the buttons in the Quick scenario List.
# Save a quick scenario
Saves the edit state of the current quick scenario, including the definition state of all parameter combinations in it. So that you can come back and continue editing after you log out, or switch to another tab.
If the current quick scenario is not saved, switching between different quick scenarios and switching tabs will pop up a save prompt.

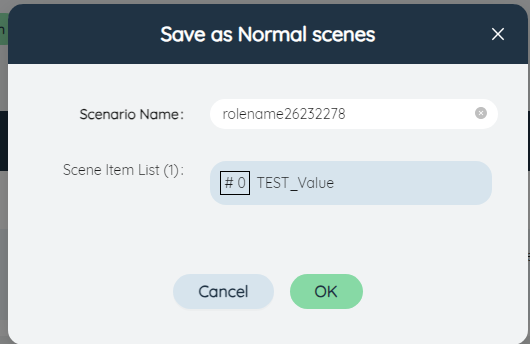
# Save as normal scenario
Save the current quick scenario and all the parameter combinations in it as a scenario composed of multiple scenario items, where the number of scenario items is equal to all parameters in the quick scenario.
Click the button, if the current quick scenario has not been saved, an error message will pop up first, and you need to save it first and then perform the save as operation.

In the pop-up dialog box, the name of the current quick scenario will be filled in by default, which can be modified as the scenario name. Among them, the name of the scenario item uses "parameter combination name_parameter name" as the scenario item name by default, and it is not allowed to modify.
If the current name is duplicated with an existing scenario, click Save to prompt whether to overwrite the current scenario, and click OK to overwrite.
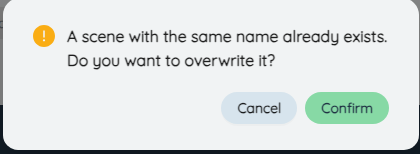
The scenario item will automatically overwrite the scenario item with the same name to ensure that the latest parameter combination editing can always be reflected.
# Model run
# Run Queue
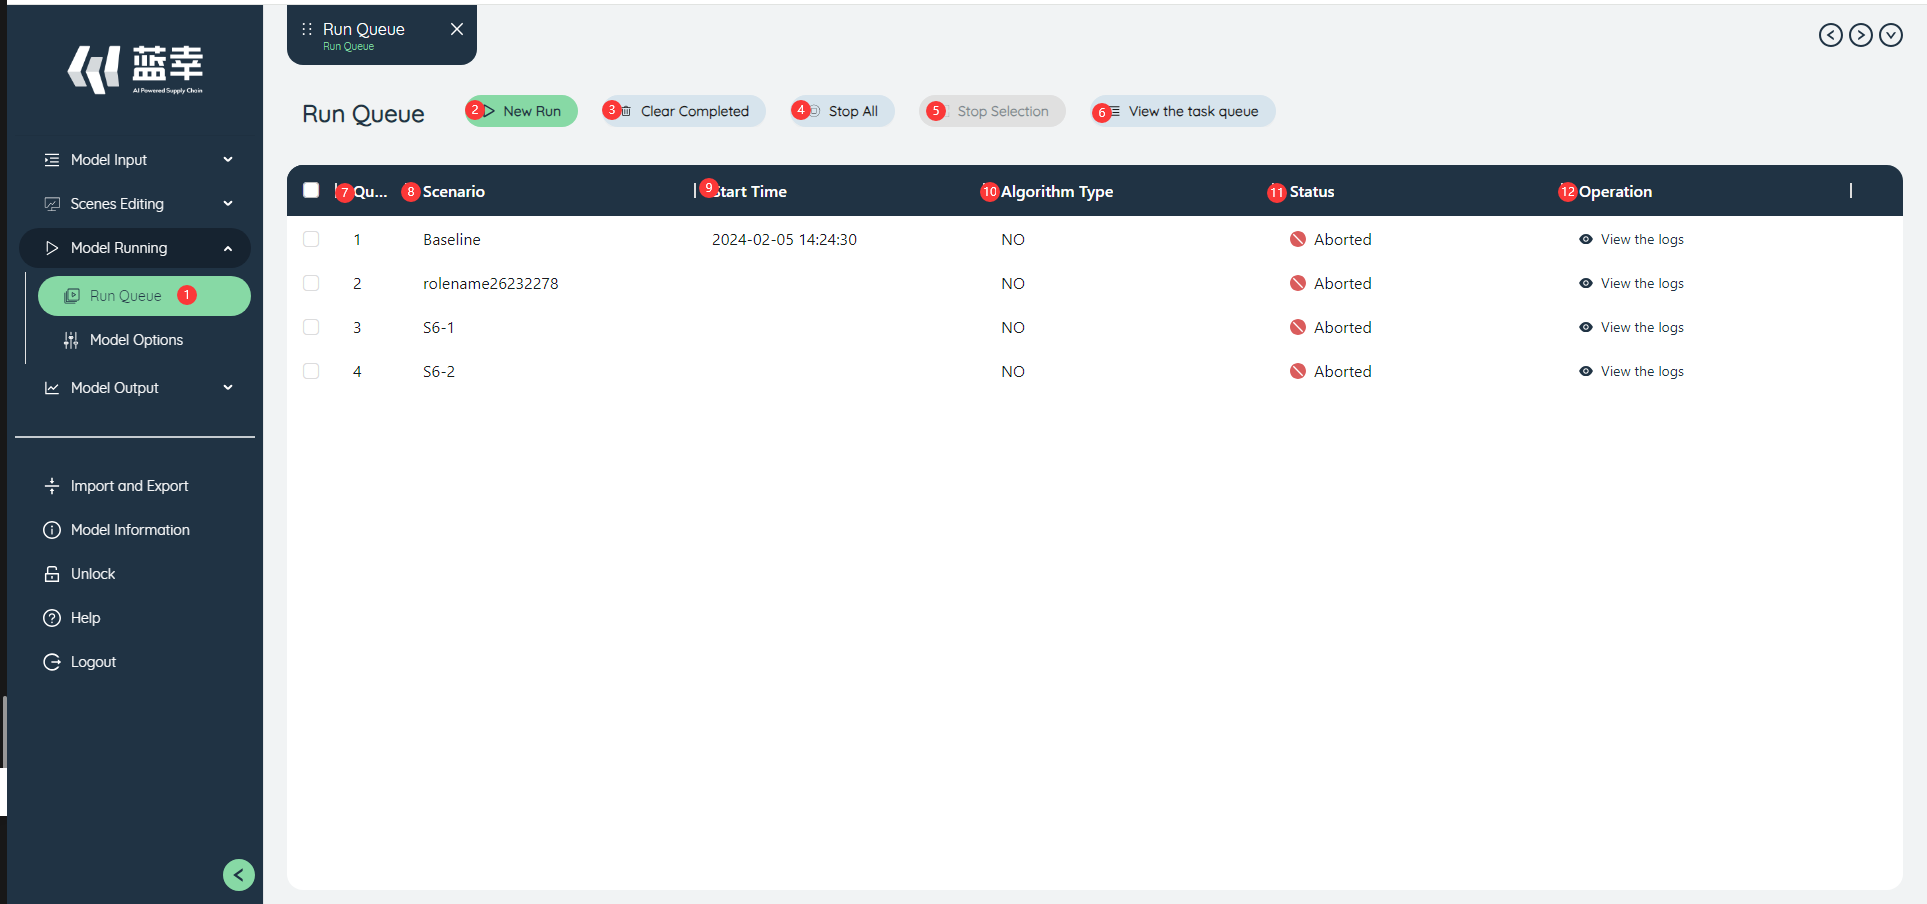
- In the SCATLAS software, find the corresponding Run Queue button on the left icon bar and left-click, and the Run Queue editing interface will appear.
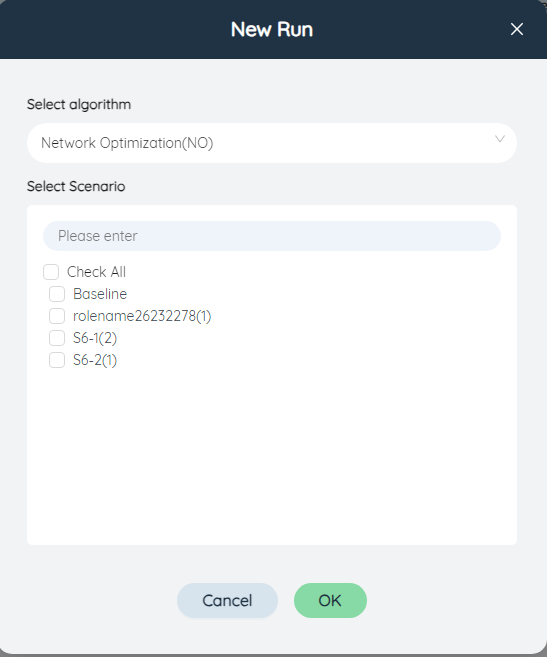
- New task button: Click the new task button to realize the new task function, and select the corresponding algorithm (NO/GF/SSO/SIM/NP/DA) and scenario (single selection or all selection) to run Add tasks.
- Clear Completed Button: Click the Clear Completed button to clear all completed tasks.
- Stop All Button: Click the Stop All button to Stop All ongoing tasks.
- Stop Selection button: When running multiple tasks, check an ongoing task and then click the Stop Selection button to realize the function of aborting the selected task.
- View the task queue: Click the View the task queue button to view the information of running/to-be-running tasks in a pop-up window.
- Index: Displays the task number.
- Scenarios: Displays the scenario name.
- Start time: Record the time when the task started running.
- Algorithm Type: Displays the algorithm type of the task, such as NO, SSO, SIM, GF, NP, etc.
- Status: Displays the running status such as success/failure/abort/warning, etc.
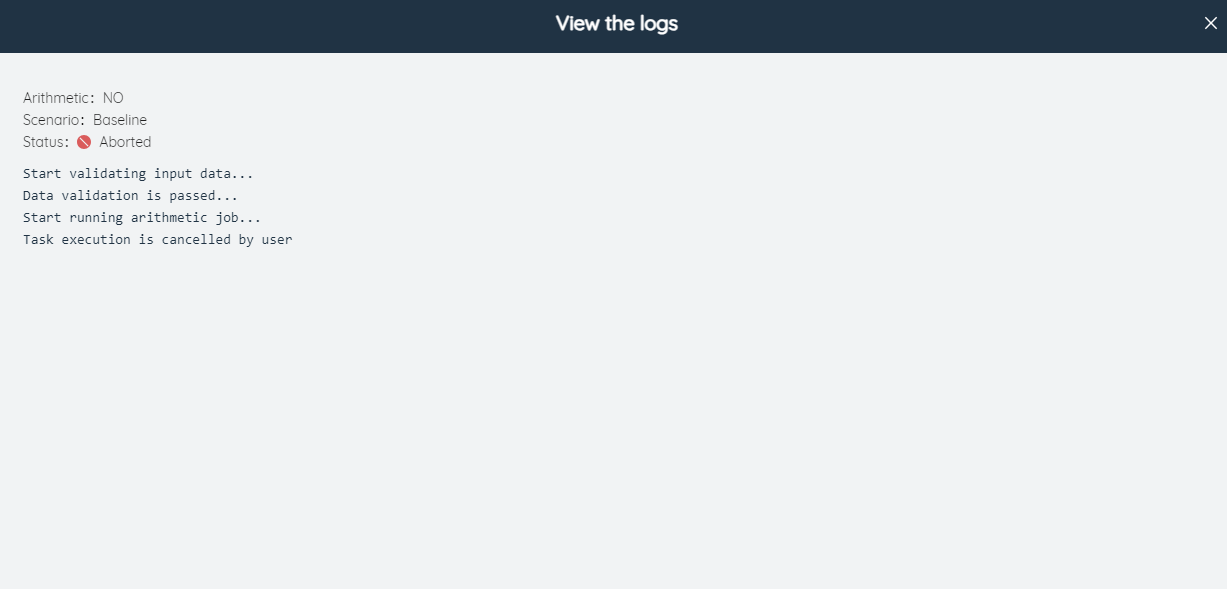
- Operation: Click the View Log button to view the task running log.
# Model options
# Overview
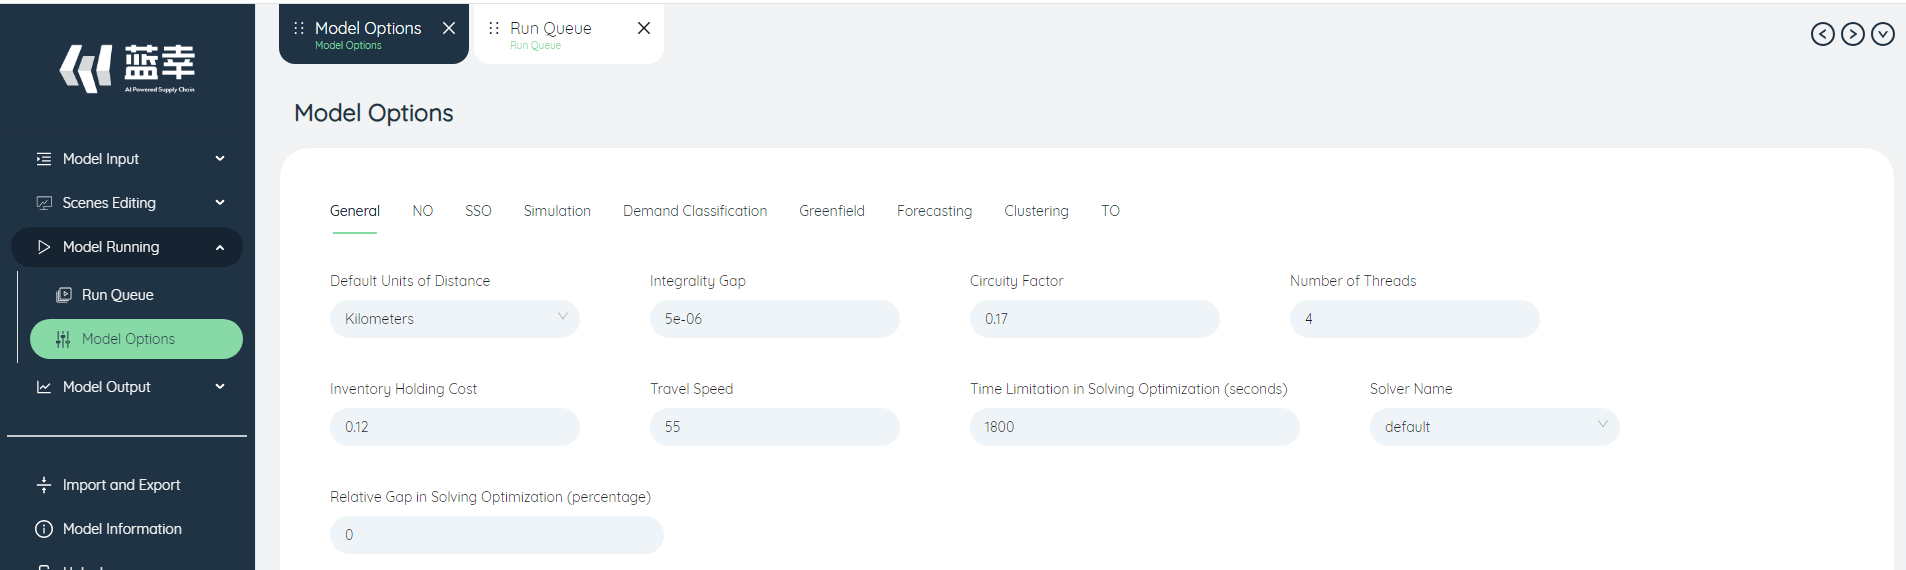
In the SCATLAS software, find the corresponding model option button on the left icon bar and left-click to display the model option overview interface. In this interface, model option parameter adjustment for various algorithms can be realized.
# General
This option allows you to adjust parameter settings common to all models.
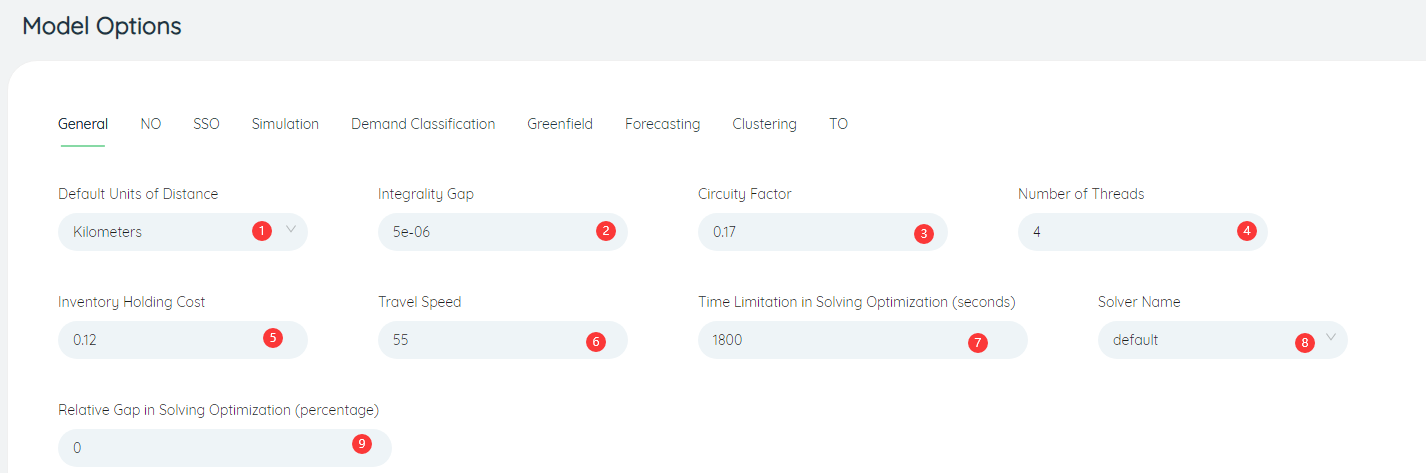
- Solver Name: The choice of solver type, default is default.
- Relative Gap in Solving Optimization(percentage): The parameter setting of the solve optimization Gap limit, the default is 0.1.
- Time Limitation in Solving Optimization(seconds): The longest calculation time of the model algorithm, the default is 1800s.
- Integrality gap: The precision parameter setting for integer numeric types in all models.
- Inventory Holding Cost: The parameter to calculate the inventory holding cost, the default is 0.12.
- Circuity Factor: There are road detours when calculating the actual transportation distance. On this basis, the transportation distance of detour roads needs to be calculated through parameters, and the default value is 0.17.
- Number of Threads: The maximum number of threads to be calculated at the same time is set, the default is 4.
- Travel Speed: The average travel speed used by the model when calculating the transit time, the default is 55km/h.
# Network Optimization(NO)
This option allows you to adjust the parameter settings common to the network optimization models.
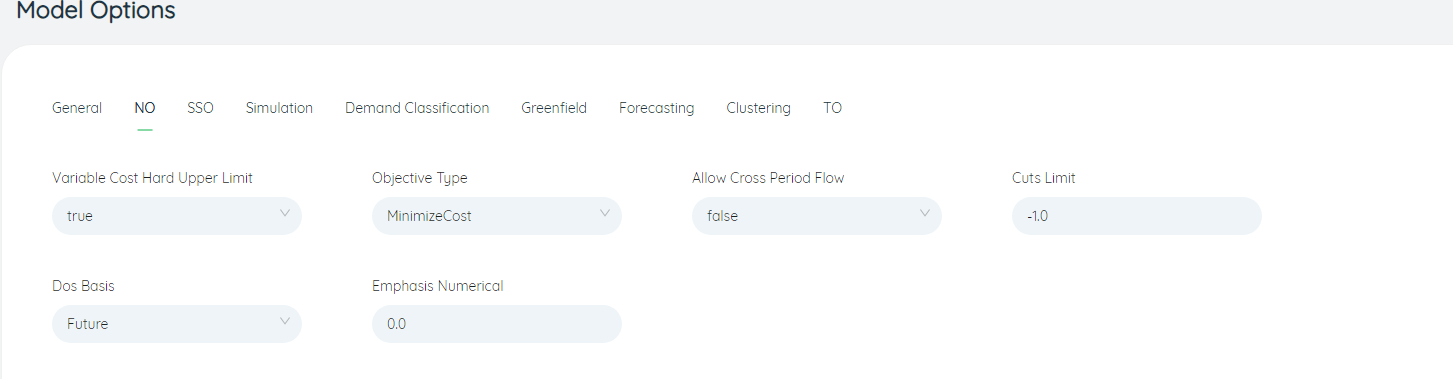
- Objective Type: The optimization objective when running the network optimization model task, the default is cost minimization, and can be adjusted to profit maximization or revenue maximization.
- Allow Cross Period Flow: Whether to allow the existence of inter-period transport lines and traffic when running the network optimization model, the default is False, not allowed.
# Safety stock optimization(SSO)
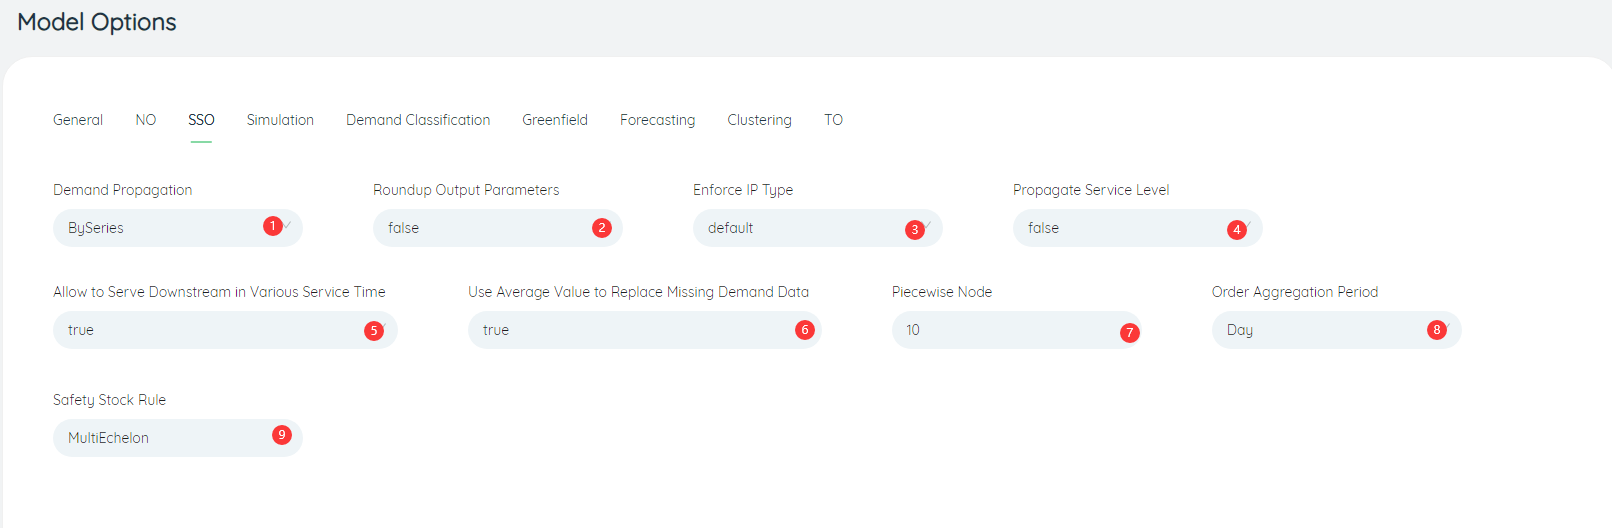
- Enforce ip type: When running the safety stock algorithm, whether to enforce the safety stock policy is s_S/R_Q, the default is Default, not mandatory.
- Propagate service level: the parameter setting that needs to be used when calculating the customer service level, the default is False, and the service level is not transmitted.
- Safety Stock Rule: The type of inventory optimization level that is running the safety stock algorithm, the default is multi-level.
- Demand Propagation: The demand transmission mode when running the safety stock algorithm, by customer order (By Series)/by forecast demand (By Formula). Defaults to By Series.
- Allow to server downstream in various service time: Whether to allow downstreams to be served with different service times when running the safety stock algorithm, the default is True, which is allowed.
- Use Average Value to Replace Missing Demand Data: Whether to replace incomplete periodic demand with mean value when running the safety stock optimization task, the default value is True, and mean value can be used instead.
- Order Aggregation Period: the cycle length when order integration is performed, the default is Day, and it can be adjusted to week or month.
- Piecewise Node: Displays the number of line segments for inventory curve fitting when running the safety stock algorithm, the default is 10.
# Simulation
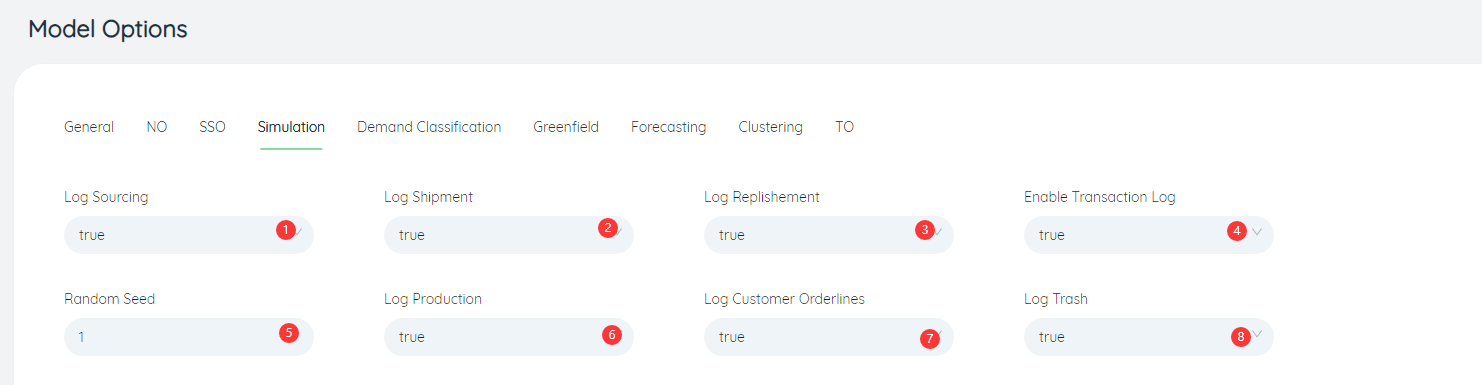
- Log Replishment: Whether to record the replenishment order log when running the simulation algorithm, the default is true, and it needs to be recorded.
- Log Production: whether to record the production order log when running the simulation algorithm, the default is true, and it needs to be recorded.
- Log Customer Orderlines: Whether to record the customer demand log when running the simulation algorithm, the default is true, it needs to be recorded.
- Enable Transaction Log: Whether to record purchase order log when running the simulation algorithm, the default is true, it needs to be recorded.
- Random Seed: The random number seed number when running the simulation algorithm, the default is 1.
- Log Trash: Whether to record trash log when running the simulation algorithm, the default is true, which needs to be recorded.
- Log Sourcing: Whether to record the sourcing log when running the simulation algorithm, the default is true, and it needs to be recorded.
- Log Shipment: Whether to record the shipment log when running the simulation algorithm, the default is true, and it needs to be recorded.
# Demand Classification
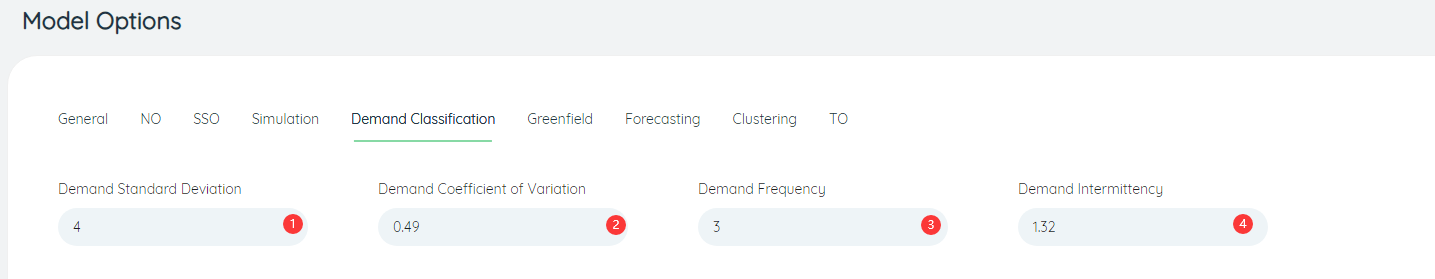
- Demand Intermittency: When calculating the demand classification, the setting of the demand intermittent parameter, the default is 1.32.
- Demand Standard Deviation: When calculating demand classification, the setting of the demand standard deviation parameter, the default is 4.
- Demand Variation Coefficient: When calculating the demand classification, the setting of the demand variation coefficient, the default is 0.48.
- Demand Frequency: When calculating demand classification, the setting of demand frequency coefficient, the default is 3.
# Greenfield
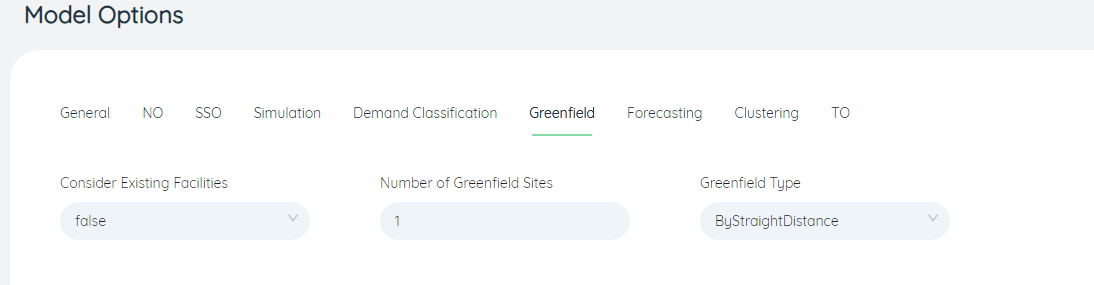
- Greenfield Type: When running the site selection optimization algorithm task, the site selection algorithm can perform site selection analysis according to the straight-line distance (ByStraightDistance) or the road distance (ByRoadDistance) between the stations. The default is to perform a siting analysis based on straight-line distances. (ByStraightDistance)
- Consider Existing Facilites: Whether to consider existing sites when running the location optimization algorithm, the default is false, and existing sites are not considered.
- Number of Greenfield Sites: When performing location optimization algorithm tasks, the number of location selection results is set, the default is 1.
# Transportation Optimization(TO)
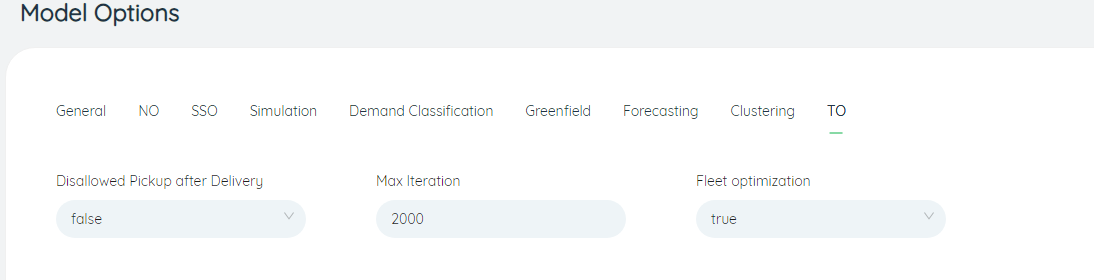
- Max Iteration: The number of iterations of the algorithm is limited, and the default is 2000. Transportation optimization uses a heuristic algorithm, and a new solution is generated every iteration. Usually, the more iterations, the higher the quality of the final output solution (that is, the best solution in the set of solutions generated by all iterations). . But an increase in the number of iterations also means a longer solution time, so there is a trade-off between solution quality and speed. This option can be used to control the solution process together with the "Solution Optimization Time Limit" (the default is 1800 seconds) in all options. Note that the algorithm will terminate after reaching the maximum number of iterations or reaching the optimization time limit, so there may be cases where the algorithm does not reach the iteration limit or the optimization time limit after the algorithm terminates. Another option, Number of Iterations (or Optimization Time), can be set to a larger value if you want to control the solution process only with Optimization Time (or Number of Iterations).
- Do not pick up after delivery: If you fill in true, it means that the same vehicle is not allowed to pick up the goods after completing any delivery. This option is false by default. It is usually used for: in the "cross-point delivery" or "cross-point pick-up" scenario, the vehicle is limited to only one trip (the vehicle departs from the parking lot and returns to the parking lot is one trip); or in the "delivery while picking up" In the scenario, it is restricted that the vehicle must deliver the goods after the pickup is completed, and the vehicle can only run once; of course, this option can only be selected as false in the "delivery first, then pick up" scenario.
- Fleet Optimization: Indicates whether to consider the limit of fleet size, the default is true. In some scenarios, the resources of the vehicle can be regarded as unlimited (or unknown). At this time, the allocation quantity field in the model quantity allocation table can be filled with empty values, and then this option is selected as false, then the algorithm will Treat all car models as having an infinite number. However, there are other ways to achieve the same effect. Assuming that the number of orders in a certain scene does not exceed 100, which means that each model will not use more than 100 vehicles, you can fill in the allocation quantity field in the model quantity allocation table. Enter 100, and then select this option as true, which is equivalent to "unlimited" number of models.
# Model output and analysis
# Output table

Click the model output table on the left to review the output table. When reviewing the model output table, due to the large number of output tables, you can select the table type/table function/sort, hide the empty table, or filter the output table according to the solution type. The search box above the table supports entering key fields to search the output table.
# Map
# New map
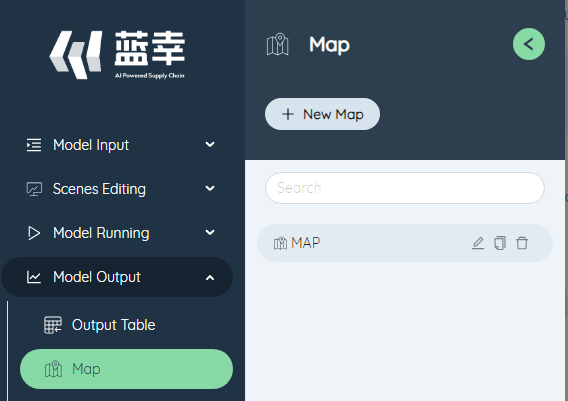
Click New Map and enter a map name to create a new map. The newly created map can display the map name in the map list on the left. The search box in the map also supports entering key fields to search the map.
# Map editor
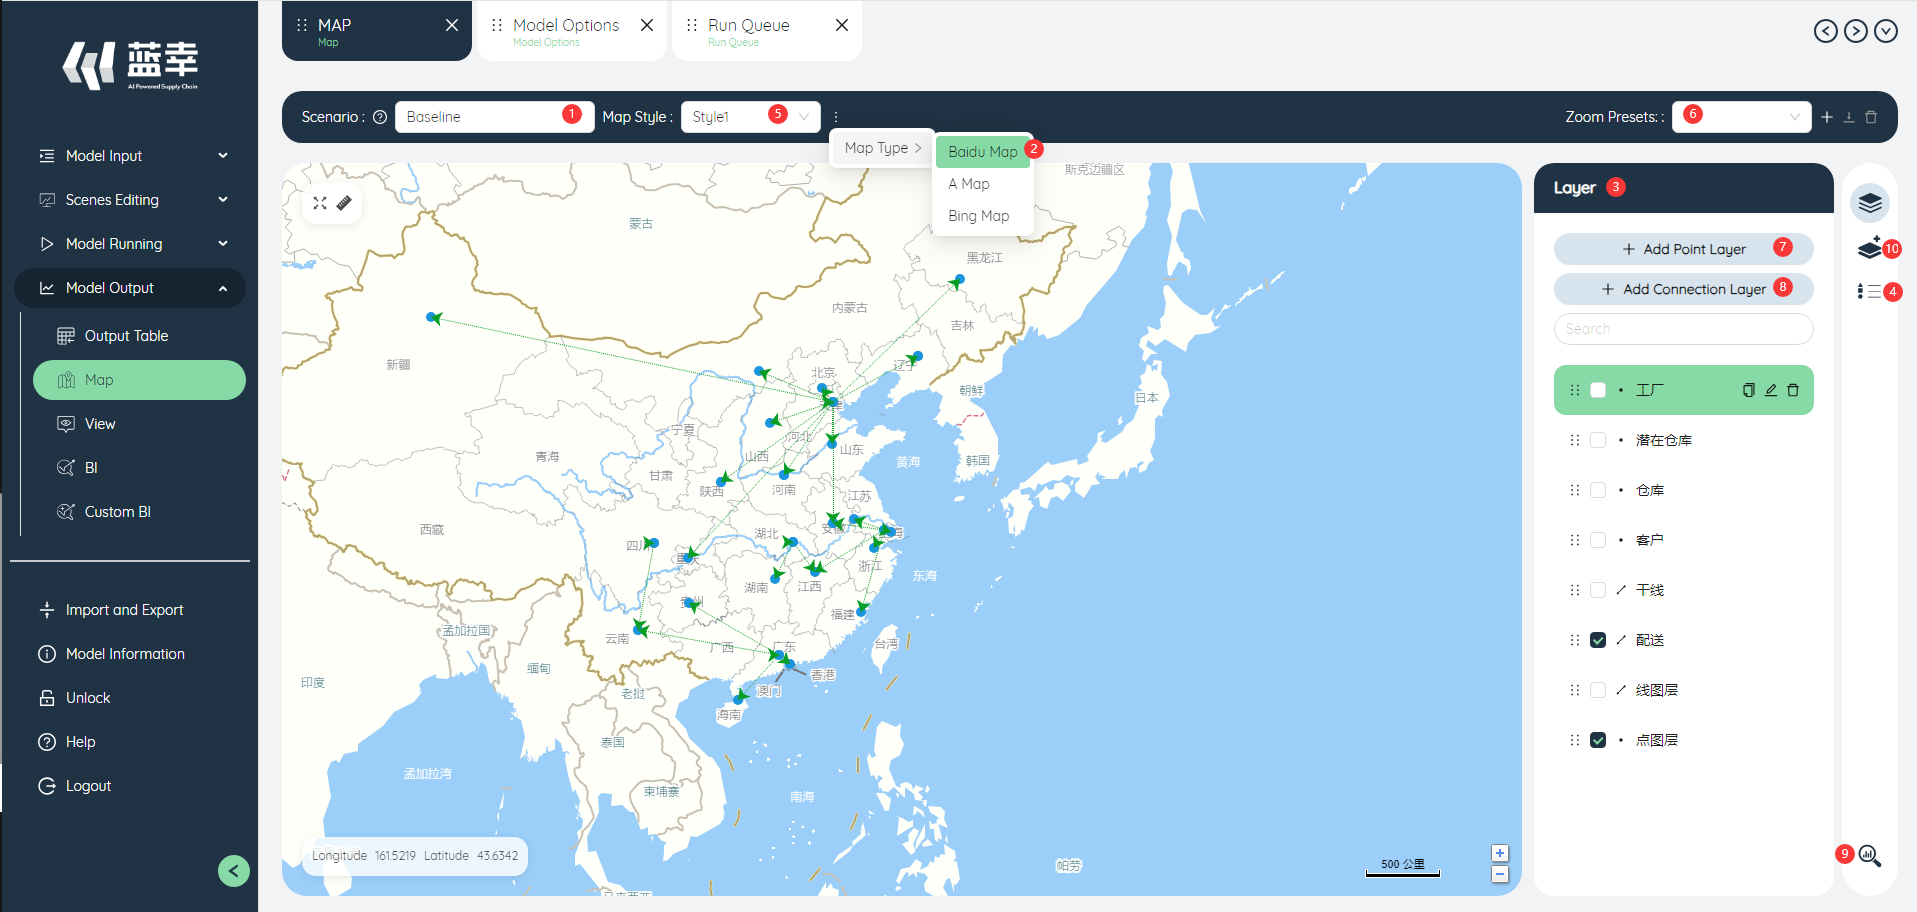
- Scenarios: Maps can be displayed for data from different scenarios. Baseline/Scenario.
- Maps: You can choose different map formats, Baidu Maps/Bing Maps.
- Layer: The layer switch determines whether the map editing area on the left is displayed.
- Legend: The legend switch determines whether the map legend on the right is displayed.
- Map Style: This button determines the display style of the map.
- Zoom Preset: Saves how the map is displayed.
- Add Point layer: Add a point layer in the map based on latitude and longitude.
- Add Connection Layer: Adds a layer of lines in the map based on start and end points.
- Display data: Click this button to view the data table.
- Layer Editor: In the layer editor, you can edit the point layer/line layer data in the map.
# Layer editor
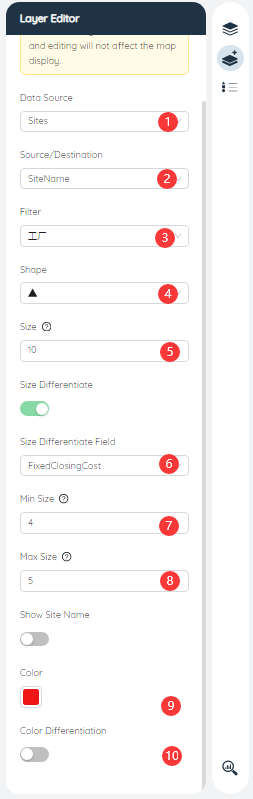
- Data source: Click the drop-down box on the right to select different data tables, including input data and output data.
- Source/Destination: Select the station name column in the data source that corresponds to the start/end point.
- Filter: Select the corresponding data filter, the global filter is displayed by default.
- Shape: Select the shape of the corresponding point layer, including the display of circle, triangle, square, and diamond.
- Size: The icon size of the corresponding point layer.
- Size Diff: Whether the icon size of the corresponding point layer is displayed differently according to the data size of different dimensions, select the indicator column for measuring the icon size from the drop-down box.
- Min Size: Select the minimum size of the icon after size differentiation.
- Max Size: Select the maximum size of the icon after size differentiation.
- Color: The icon color of the corresponding point layer, click the color block to select different point layer colors.
- Color Diff: Choose whether to display color differentiation based on data of different dimensions.
# BI
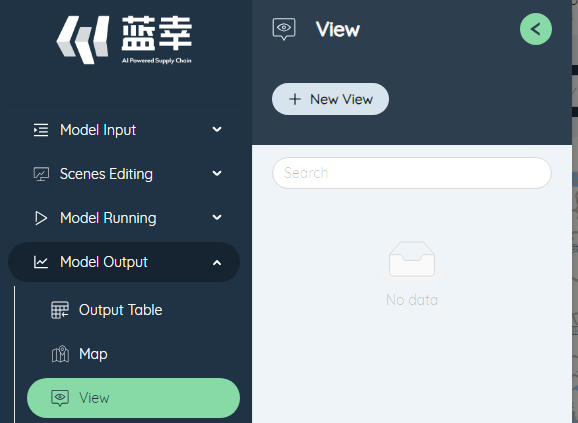
BI can perform multi-dimensional analysis on different models and tasks. The BI in the SCATLAS has completed the basic construction and settings. Users only need to select the corresponding data visualization template and adjust the parameters according to different needs. BI list colleagues can also perform table filtering and search functions.
# Production, sales and inventory
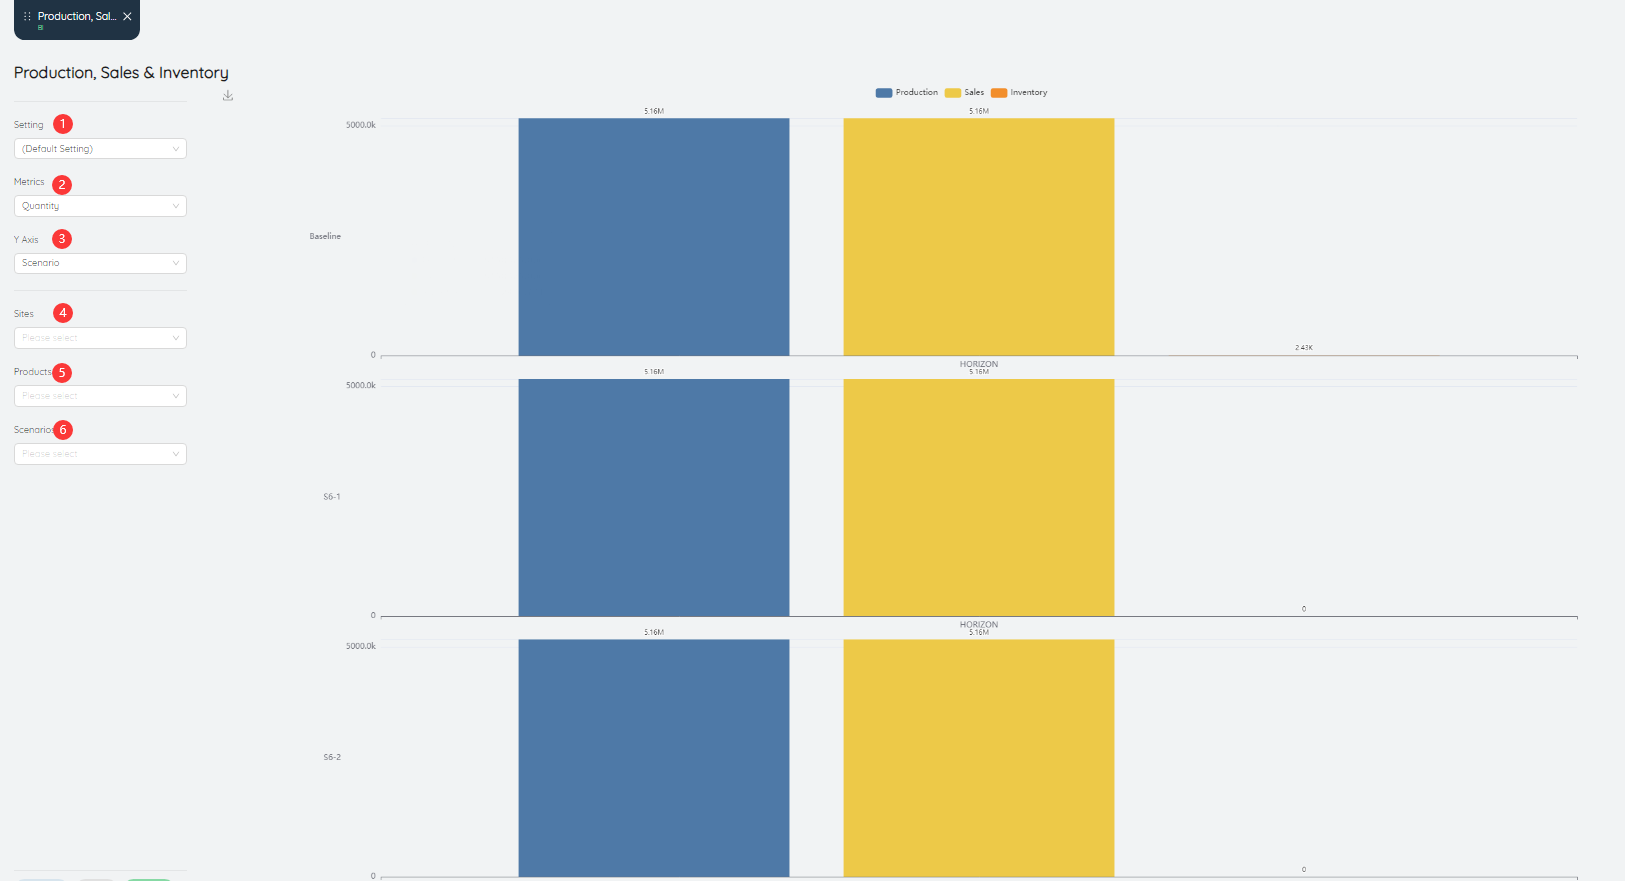
Production, sales, and inventory display the comparison of production, sales, and inventory in each scenario item.
- Setting: can be saved as settings after inputting various parameters.
- Metrics: The value of the data metric displayed in the bar chart, the default is the number of products.
- Y-Axis: The value displayed on the Y-axis in the bar chart, the default is different scenarios.
- Site: The production, sales and inventory data can be queried for a site or multiple sites individually.
- Product: You can query the production, sales and inventory data of a product or multiple products individually.
- Scenarios: You can query production, sales and inventory data for a certain scenario or multiple scenarios individually.
# Cost comparison
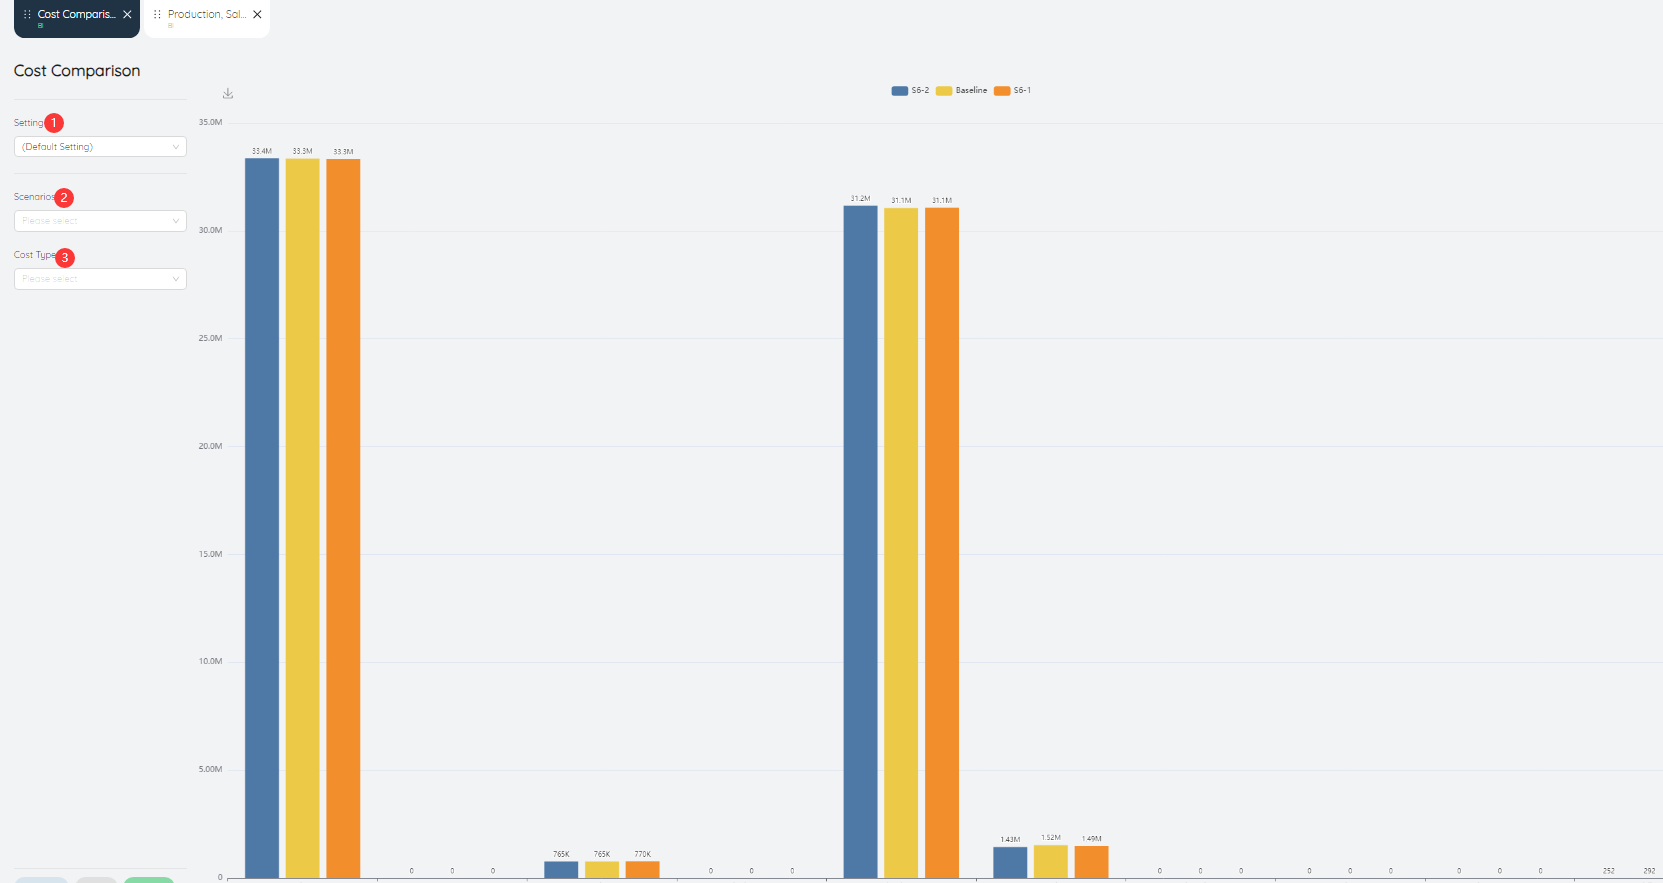
The cost comparison bar chart shows a comparison of different costs in different scenarios.
- Setting: can be saved as settings after inputting various parameters.
- Scenarios: A query that can perform cost comparison on a scenario or multiple scenarios alone.
- Cost Type: One or more costs can be queried individually.
# Demand Chart and Pareto Analysis Line
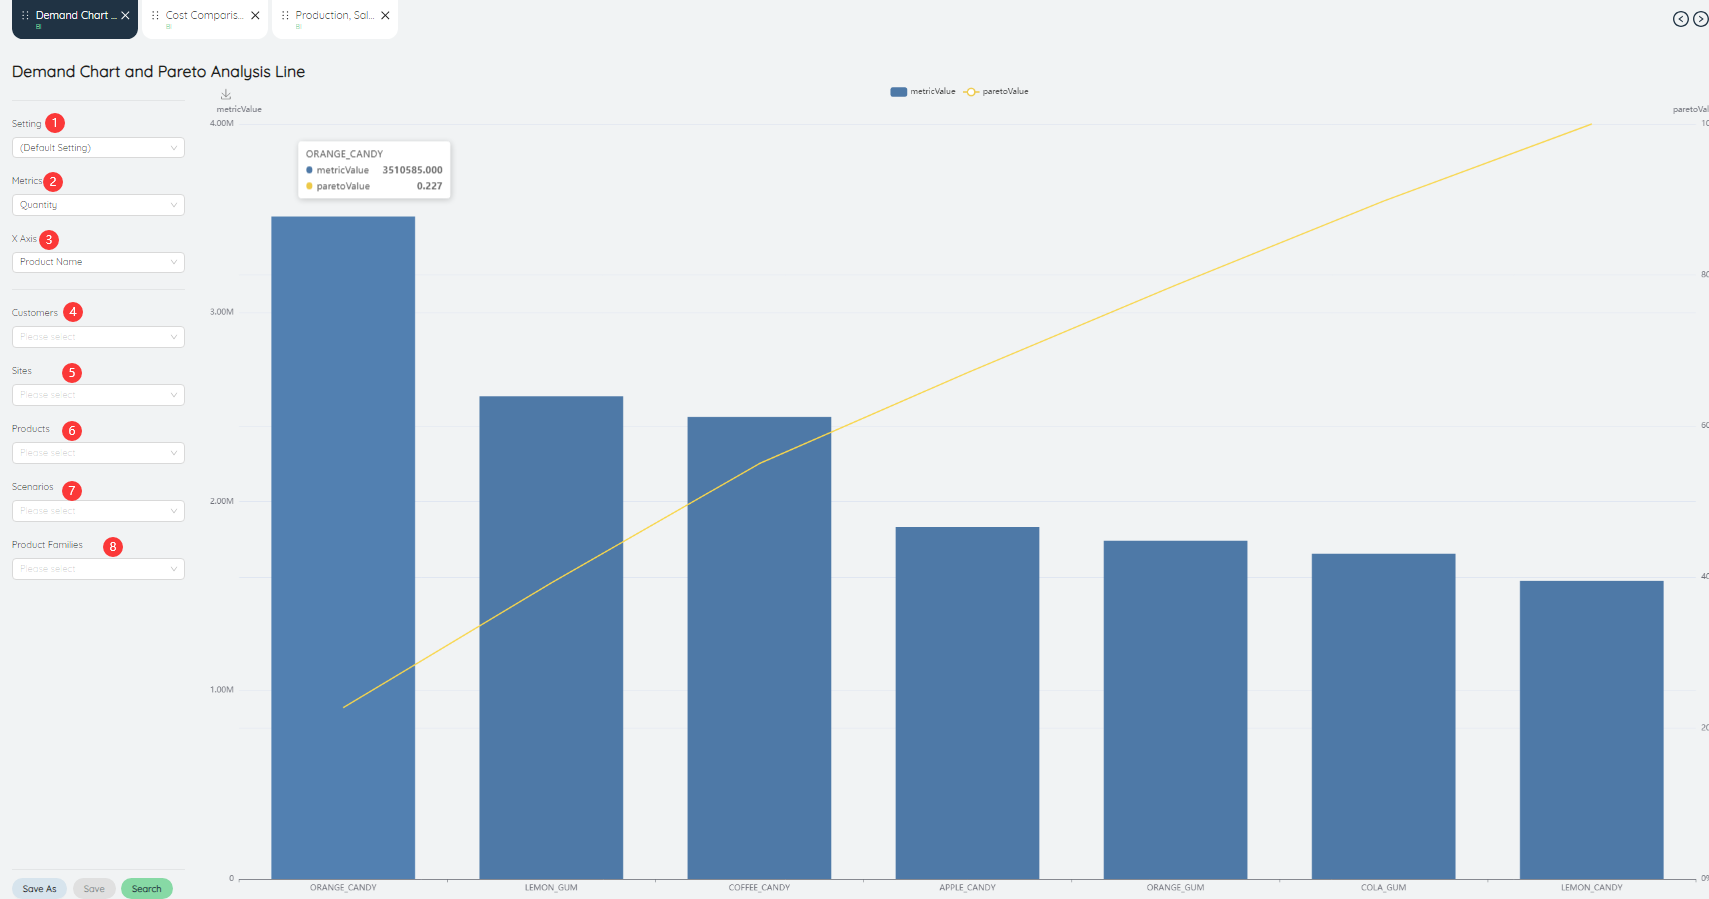
Demand Chart and Pareto analysis line show the quantity of demand for different products as a histogram, and the line graph shows the cumulative percentage of demand as a percentage.
- Setting: can be saved as settings after inputting various parameters.
- Metrics: The value of the data metric displayed in the bar chart, the default is the number of products.
- X-axis: The data dimension of the X-axis in column and line charts.
- Customer: You can query the demand data for a customer or multiple customers individually.
- Site: The demand data can be queried for a site or multiple sites individually.
- Product: You can query the demand data for a product or multiple products individually.
- Scenarios: You can query the demand data for a scenario or multiple scenarios individually.
- Product family: You can query the demand data for a product family or multiple product families individually.
# Customer SLA

The average level of customer service is expressed in the form of a pie chart + a line graph, the bar graph is the proportion of different customer needs, and the line graph is the calculated value of the weighted average of the average customer service level.
- Setting: can be saved as settings after inputting various parameters.
- Metrics: The value of the data metric displayed in the bar chart, the default is the number of products.
- X-axis: The data dimension of the X-axis in column and line charts.
- Y-axis: The data dimension of the Y-axis in column and line charts.
- Customer: Data can be queried for a customer or multiple customers individually.
- Site: Data can be queried for a site or multiple sites individually.
- Product: Data can be queried for a product or multiple products individually.
- Scenarios: You can query data for a scenario or multiple scenarios individually.
- Product family: Data can be queried for a product family or multiple product families individually.
# Facility Throughput Utilization
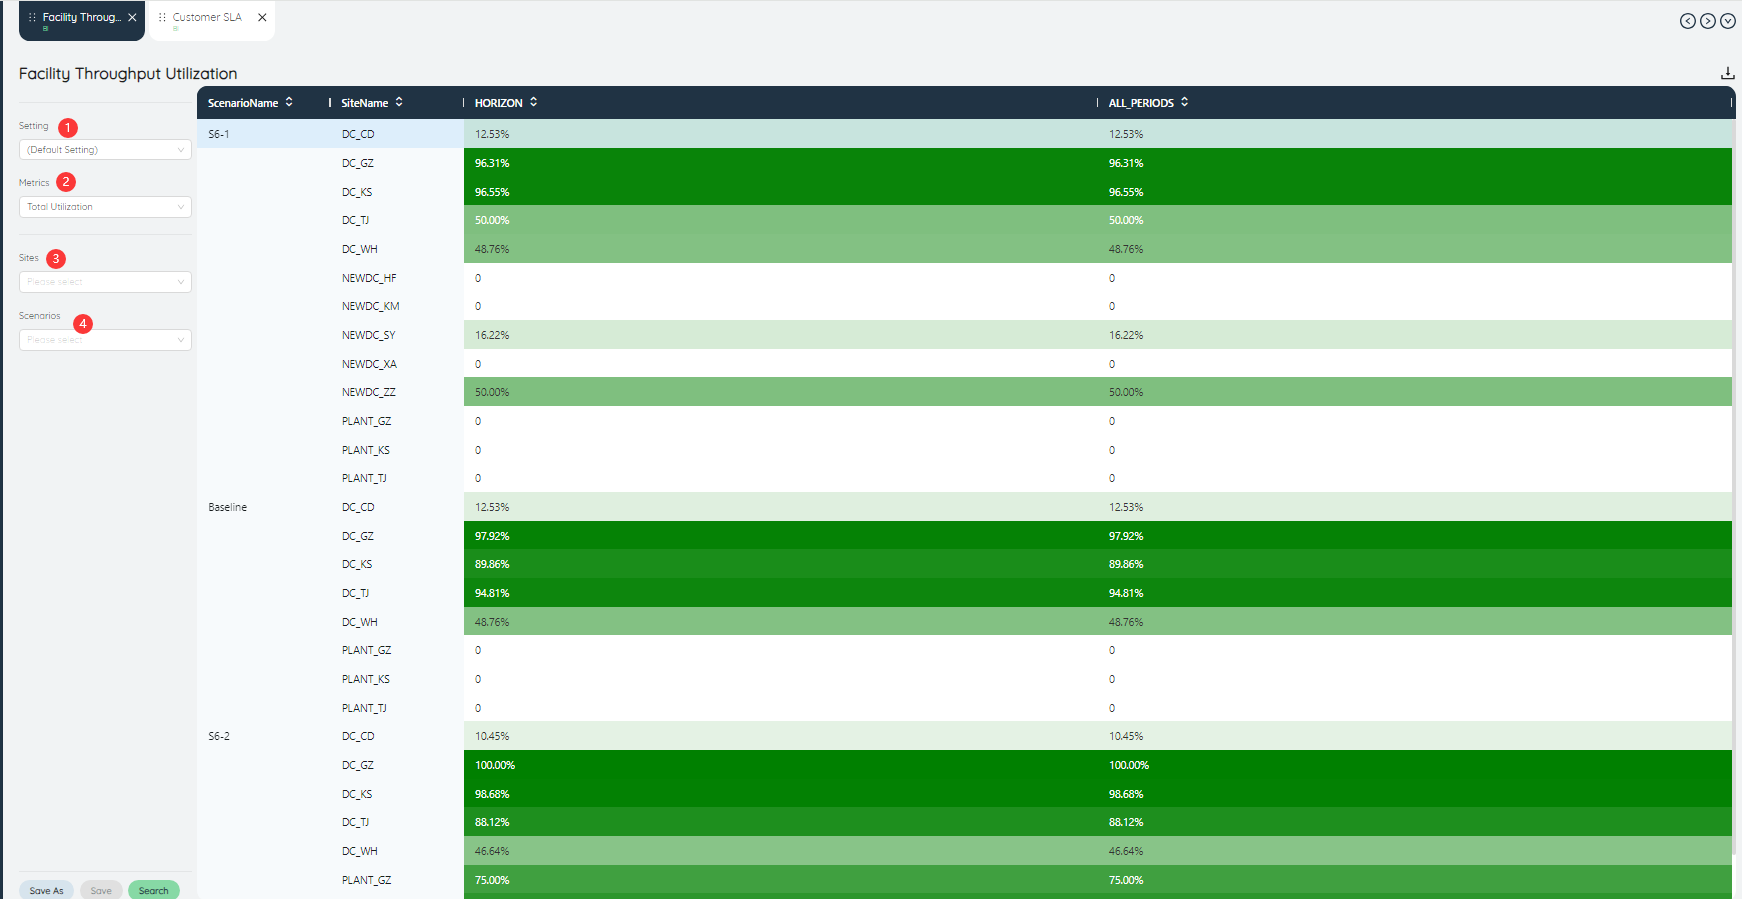
The Facility Throughput Utilization Chart will show the total utilization of different facility throughputs according to the shade of color.
- Setting: can be saved as settings after inputting various parameters.
- Metrics: The value of the data metric displayed in the bar chart, the default is the number of products.
- Site: Data can be queried for a site or multiple sites individually.
- Scenarios: You can query data for a scenario or multiple scenarios individually.
# Site Capacity Utilization
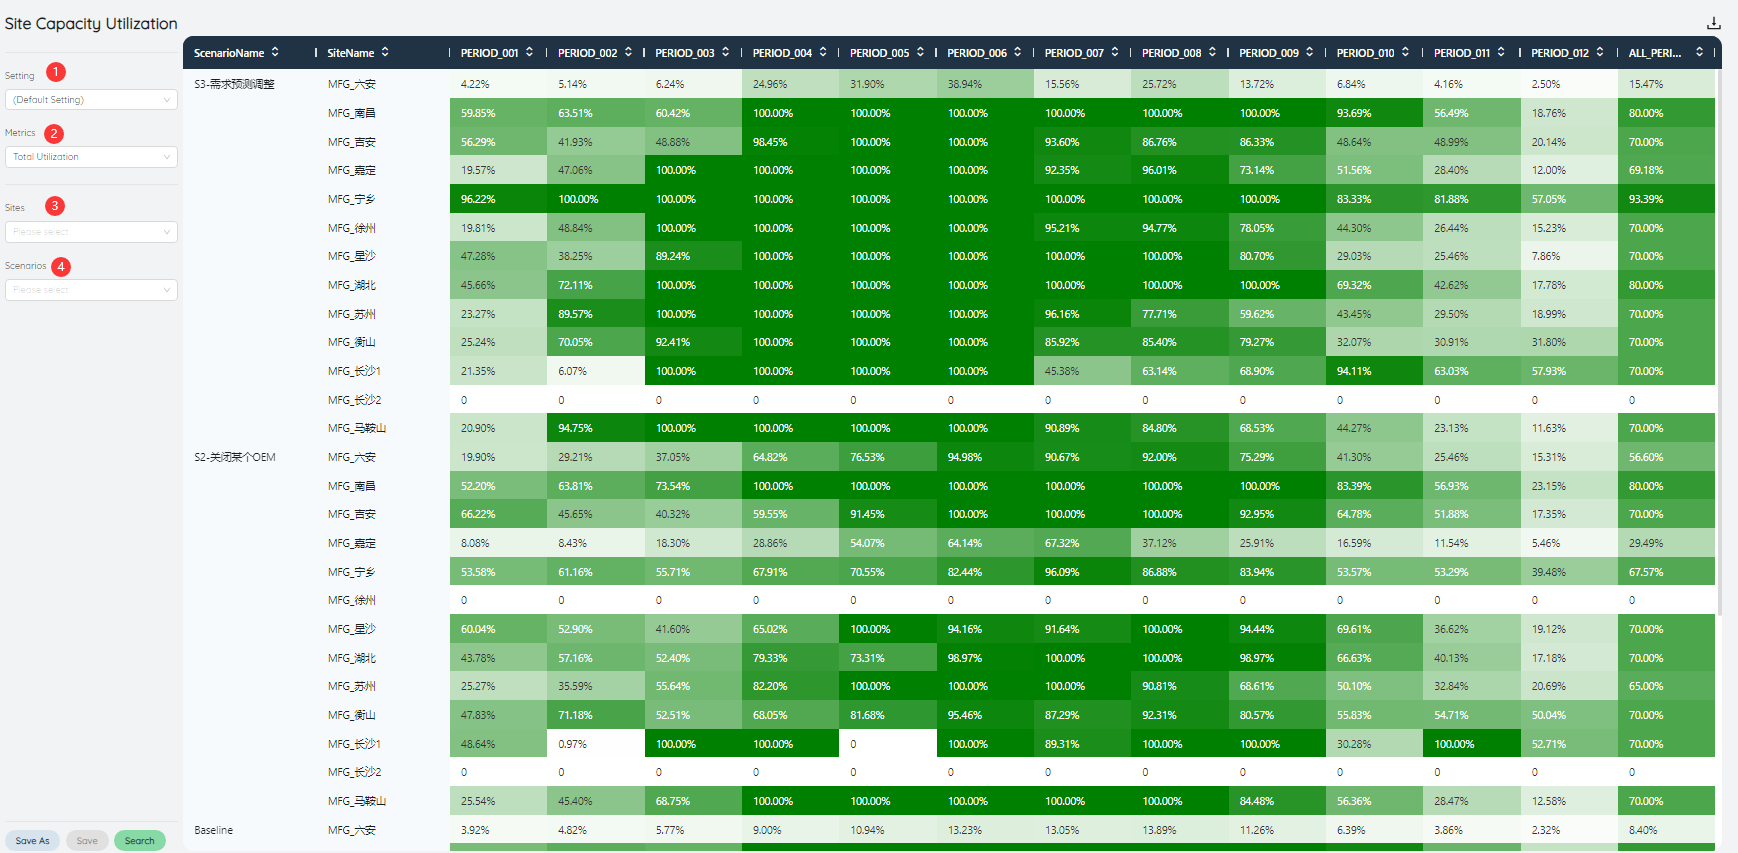
The capacity utilization rate of the site will show the capacity utilization rate of different sites according to the depth of the color.
- Setting: can be saved as settings after inputting various parameters.
- Metrics: The value of the data metric displayed in the bar chart, the default is the number of products.
# Work Center Capacity Utilization
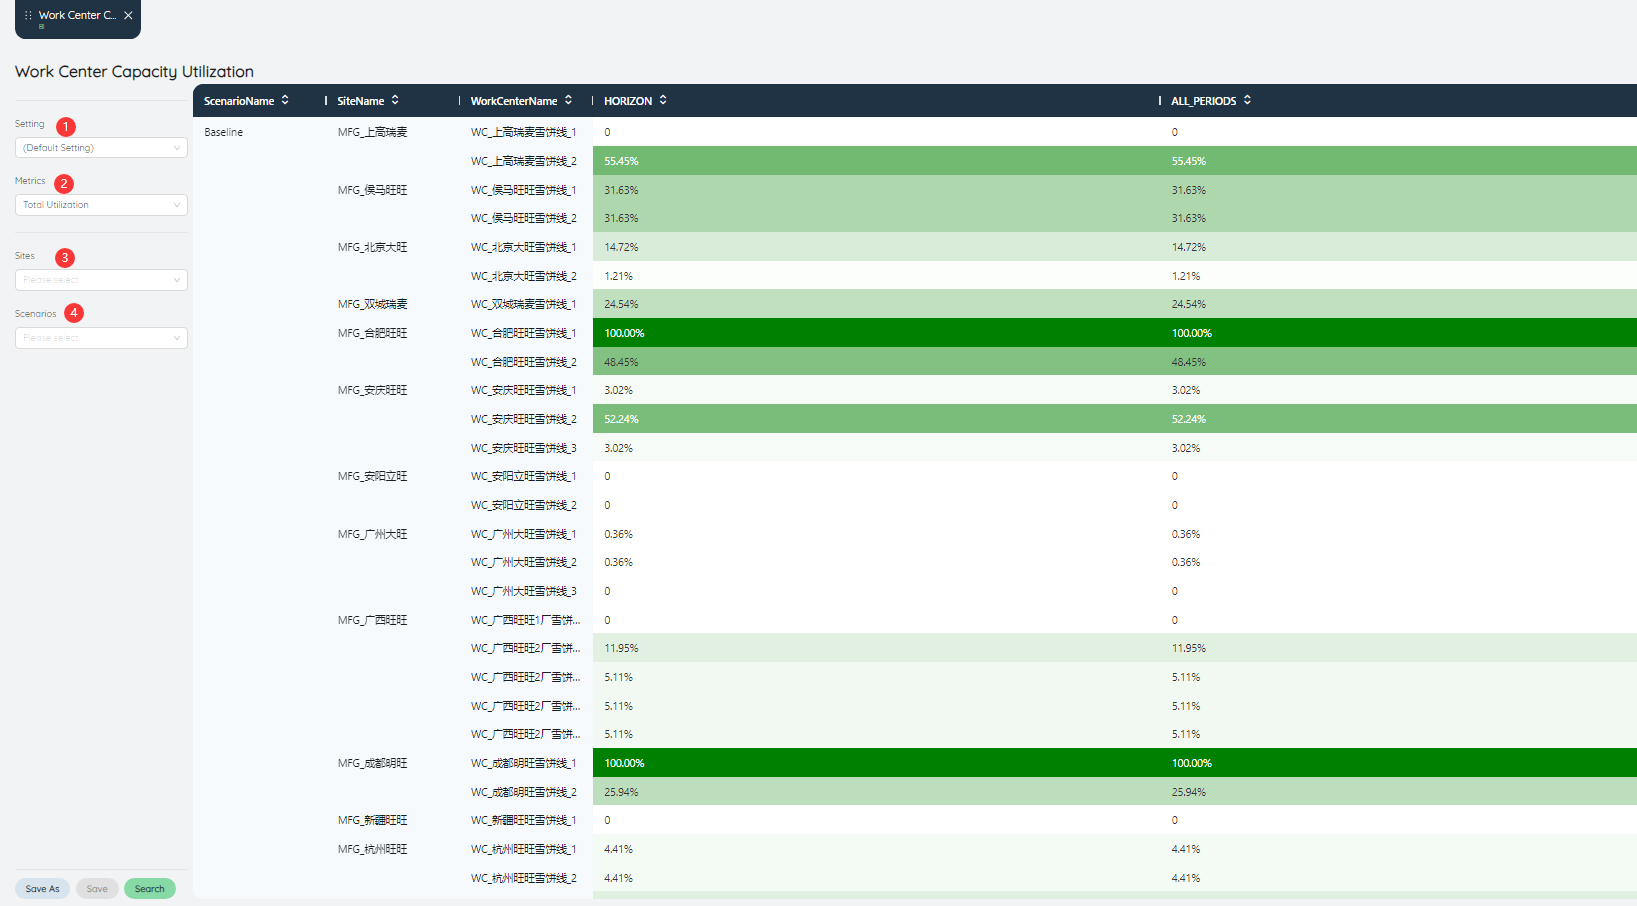
The work center capacity utilization rate will show the capacity utilization rate of different work centers according to the shade of color.
- Setting: can be saved as settings after inputting various parameters.
- Metrics: The value of the data metric displayed in the bar chart, the default is the number of products.
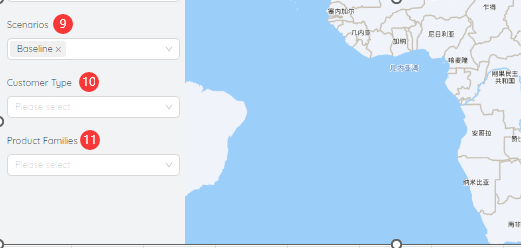
# Demand Map
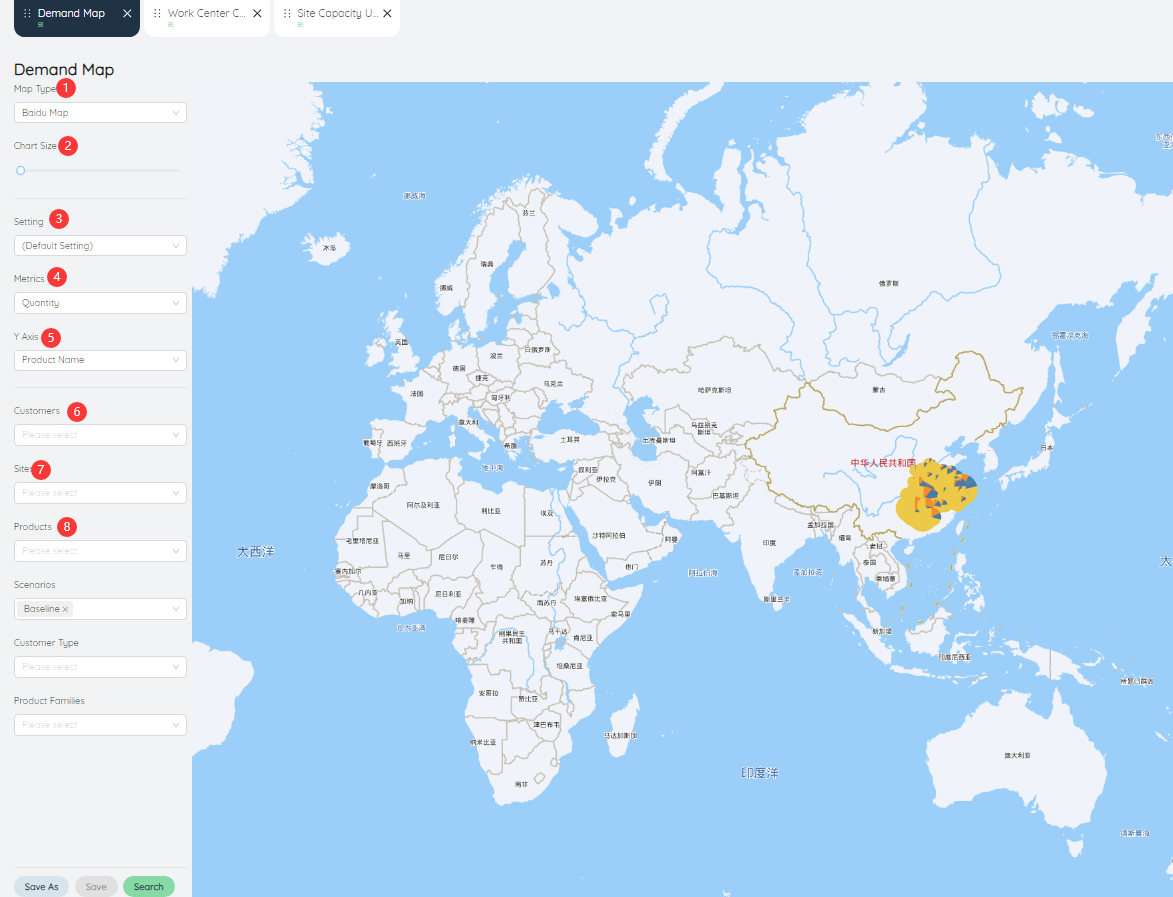
The requirements map allows users to view the distribution of different customer requirements in the map.
- Map Type: The adjustable map type is Baidu Map or Bing Map.
- Chart Size: The size of the chart in the map can be controlled by the scroll wheel.
- Setting: can be saved as settings after inputting various parameters.
- Metrics: The value of the data metric displayed in the bar chart, the default is the number of products.
- Y-Axis: The value displayed on the Y-axis in the bar chart, the default is different scenarios.
- Customer: Data can be queried for a customer or multiple customers individually.
- Site: Data can be queried for a site or multiple sites individually.
- Product: Data can be queried for a product or multiple products individually.
- Scenarios: You can query data for a scenario or multiple scenarios individually.
- Customer Type: Data query can be performed for a certain type of customer or for multiple types of customers.
- Product family: Data can be queried for a product family or multiple product families individually.
# Inventory Simulation
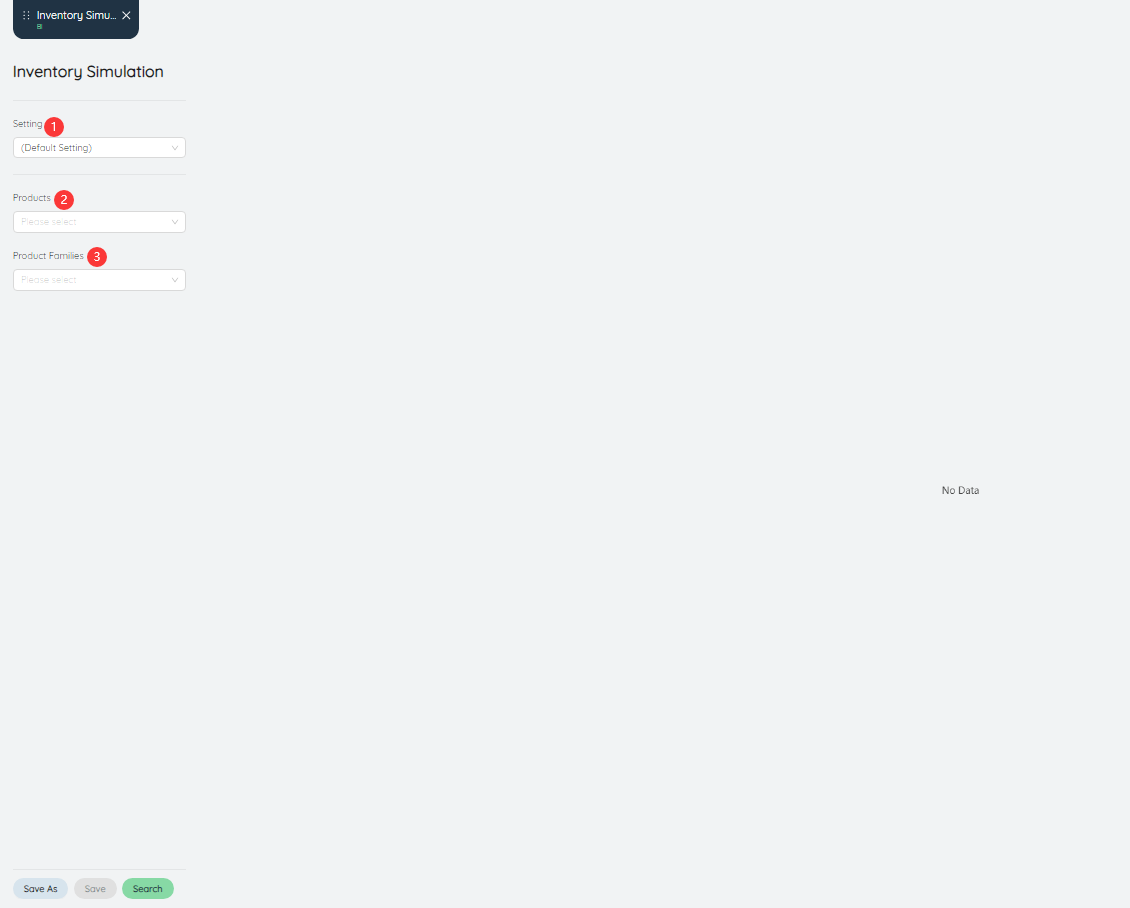
Inventory simulation simulation map can display warehouse network inventory through simulation and simulation.
- Setting: can be saved as settings after inputting various parameters.
- Product: Data can be queried for a product or multiple products individually.
- Product family: Data can be queried for a product family or multiple product families individually.
# Inventory data
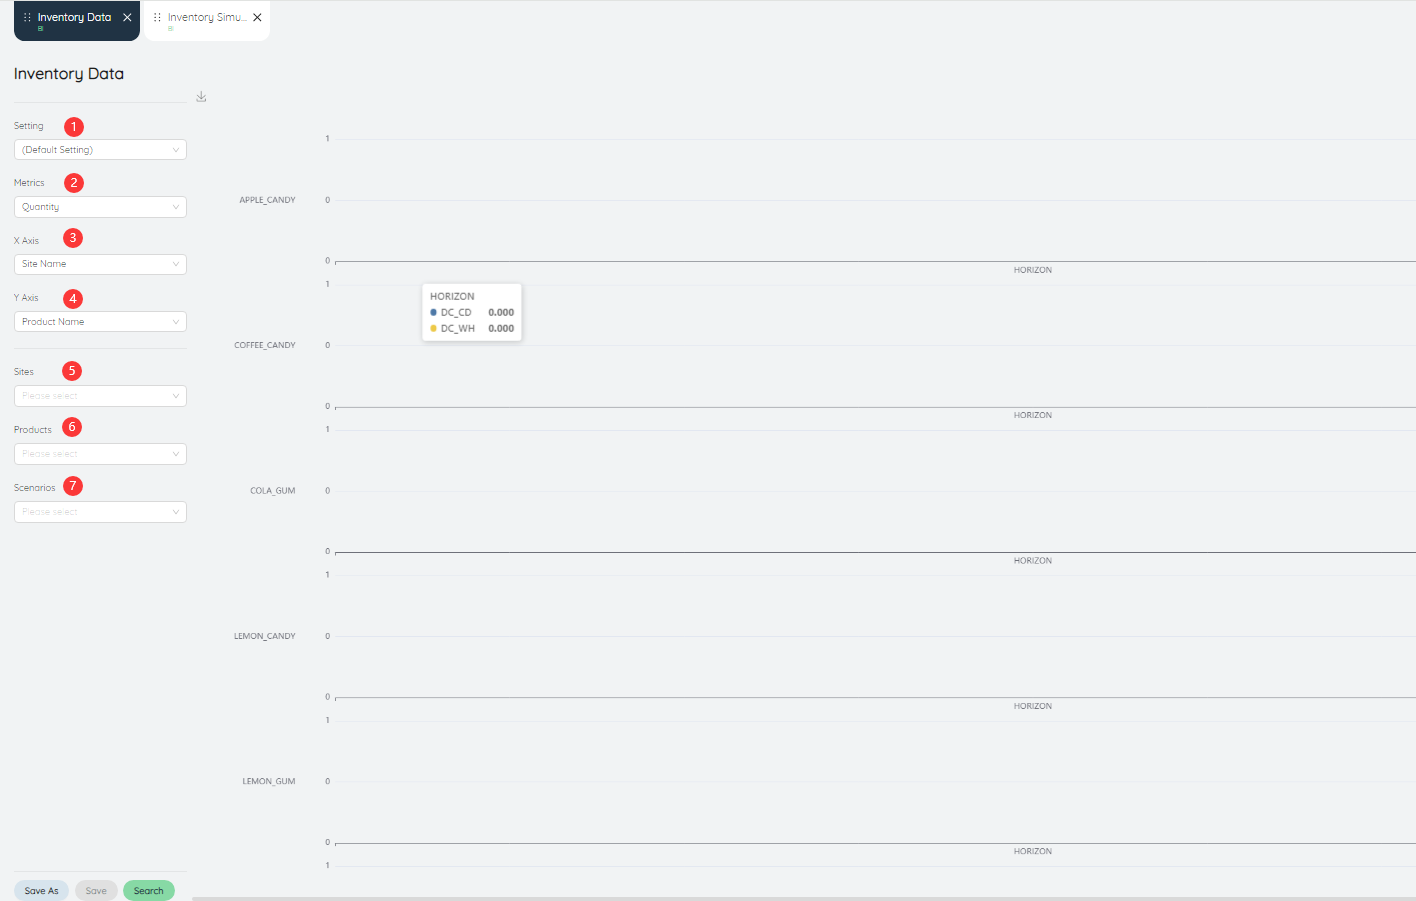
Inventory data displays the inventory status of different products in various warehouses in the form of stacked bar charts.
- Setting: can be saved as settings after inputting various parameters.
- Metric: The value of the data metric displayed in the bar chart, the default is the number of products
- X-axis: The value displayed on the X-axis in the bar chart, the default is different scenarios.
- Y-Axis: The value displayed on the Y-axis in the bar chart, the default is different scenarios.
- Site: Data can be queried for a site or multiple sites individually.
- Product: Data can be queried for a product or multiple products individually.
- Scenarios: You can query data for a scenario or multiple scenarios individually.
# Warehouse cycle throughput
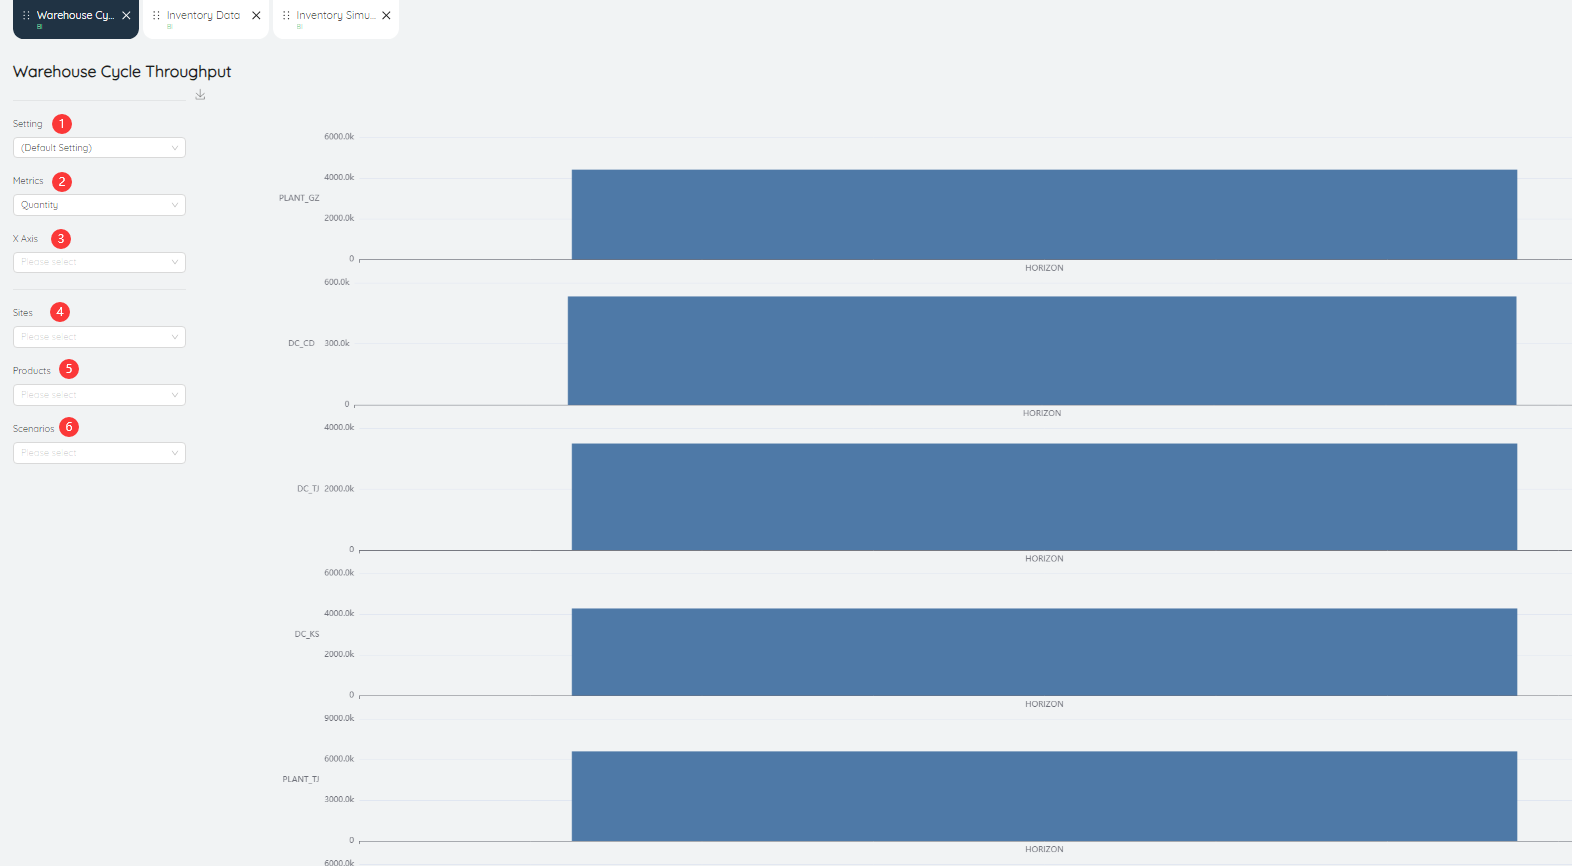
Warehouse cycle throughput is displayed in the form of a bar chart showing the throughput of different and warehouses.
- Setting: can be saved as settings after inputting various parameters.
- Metric: The value of the data metric displayed in the bar chart, the default is the number of products
- X-axis: The value displayed on the X-axis in the bar chart, the default is different scenarios.
- Site: Data can be queried for a site or multiple sites individually.
- Product: Data can be queried for a product or multiple products individually.
- Scenarios: You can query data for a scenario or multiple scenarios individually.
# Permission management and administrator settings
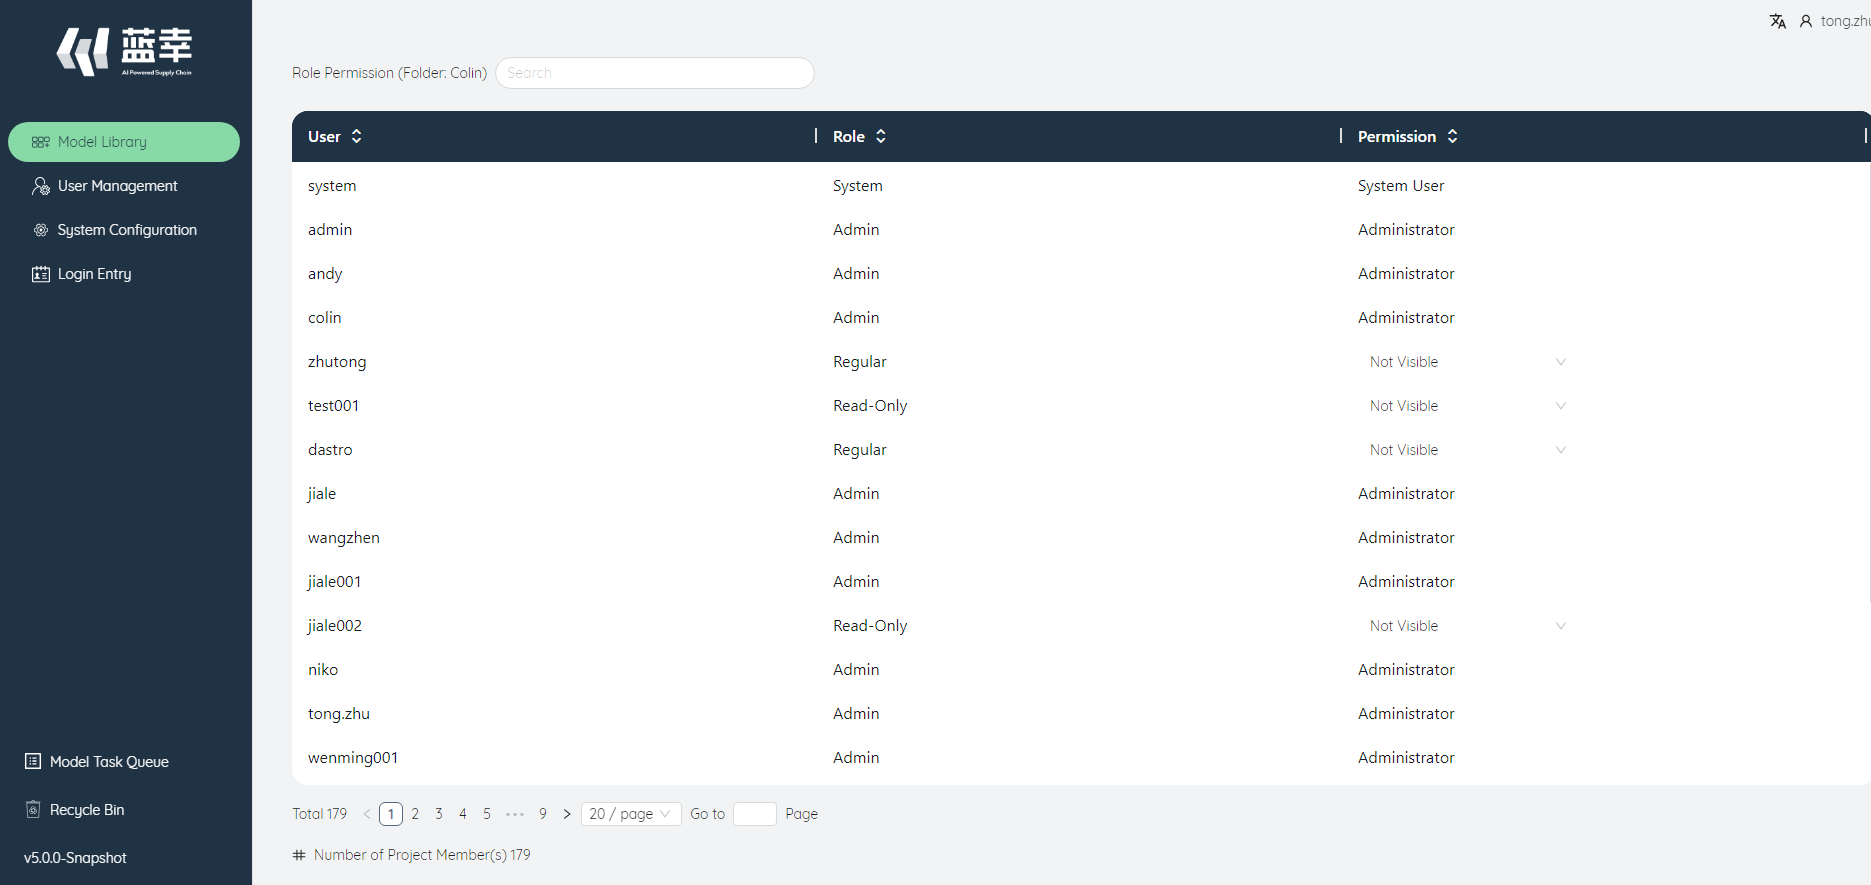
# Permission management
# Folder permissions
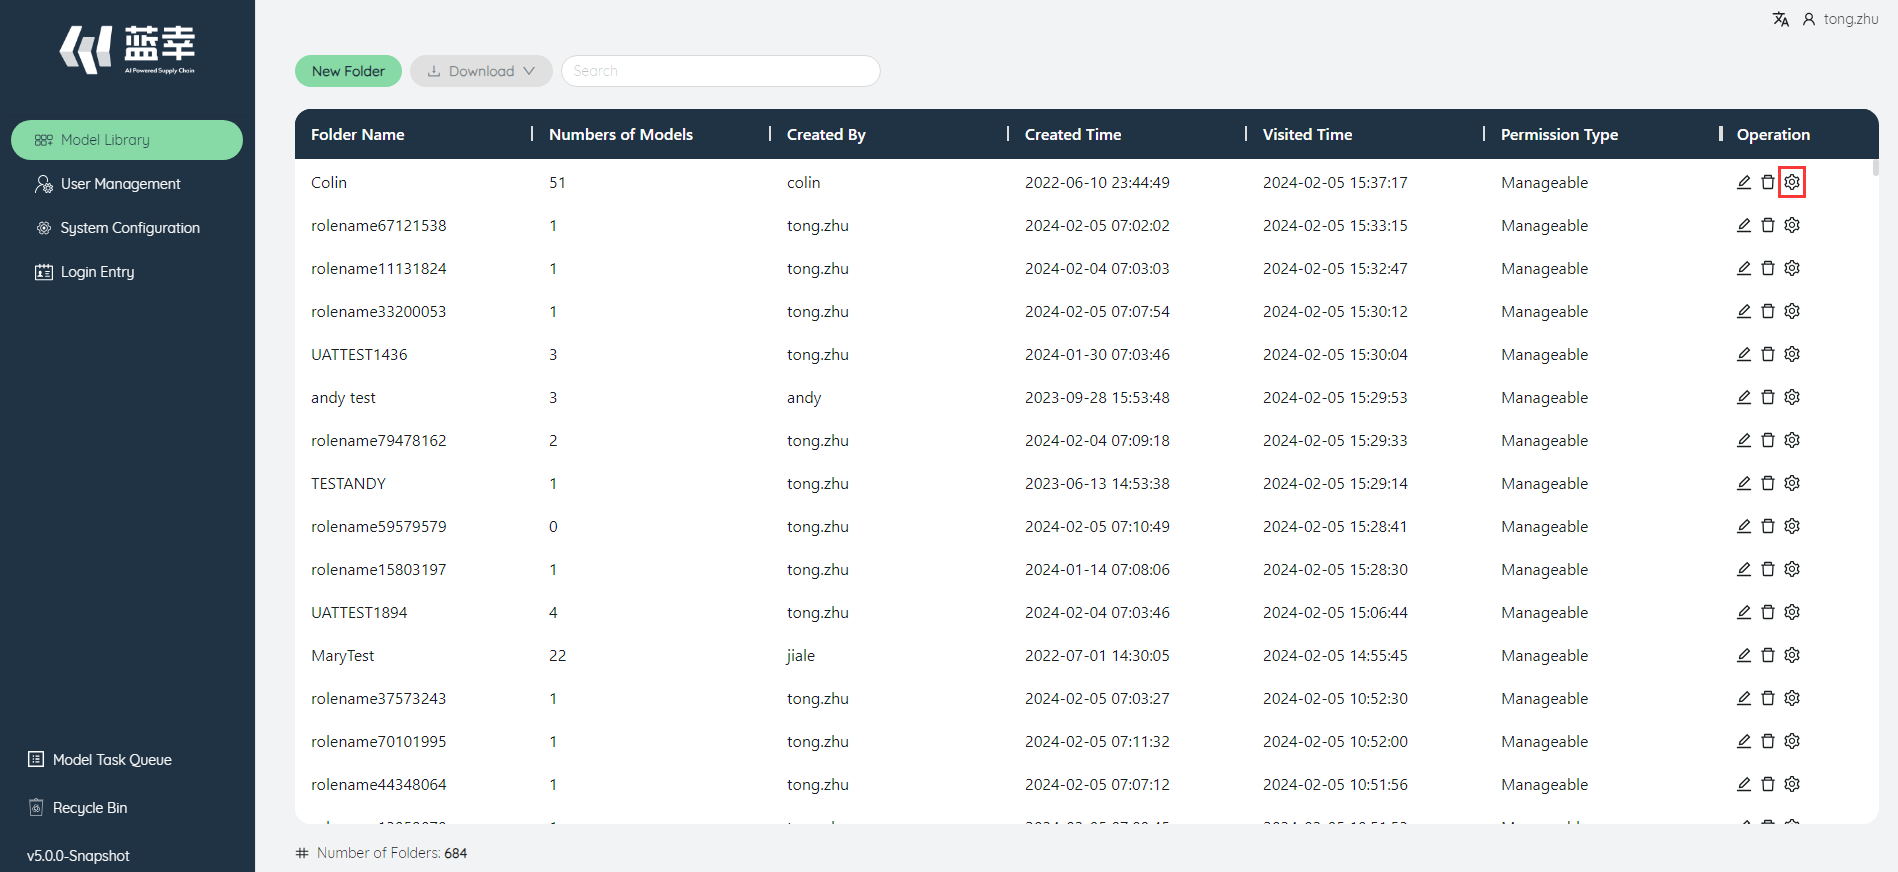
In the folder list, click the Manage button on the right side of each folder to set the permissions of other members in the system for the folder. Administrators can set permissions for all folders. There are three types of permissions:
- Invisible: The account will not show this folder
- Read only: The account can access this folder, but cannot edit or download models in it.
- Editable: The account can access this folder, and can edit and download models in it.
A read-only folder in which models cannot be edited, run, downloaded, and their folder permissions cannot be modified.
# Model permissions
The permissions of the current model follow the permissions of the folder and cannot be set individually.
# Administrator settings
# User Management
After the administrator logs in to the system, the second function button on the left is user management, click to enter the user management interface.
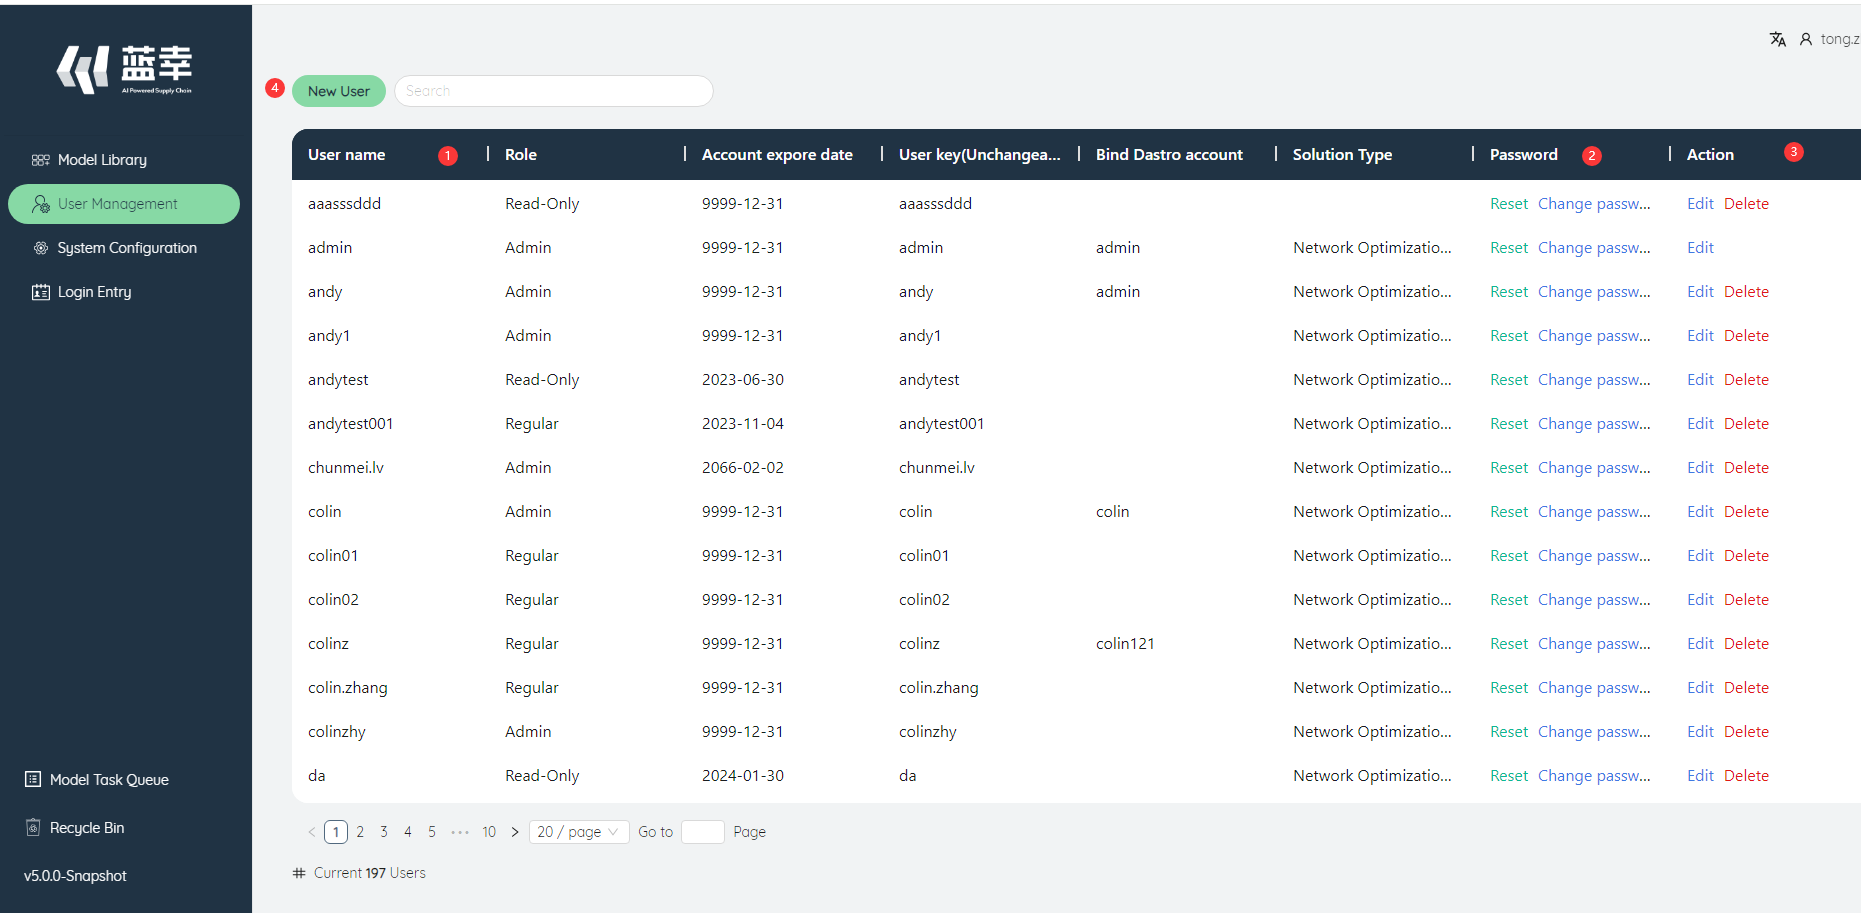
①User list: Display the user name, role, account validity period and other information.
②Password: The password includes two operations, reset and change the password. Click Reset to reset the current user's password, click Modify Password, enter the current administrator's password and the user's new password in the pop-up window and confirm, then the password can be changed.

③Operation: Operation includes two operations: edit and delete.
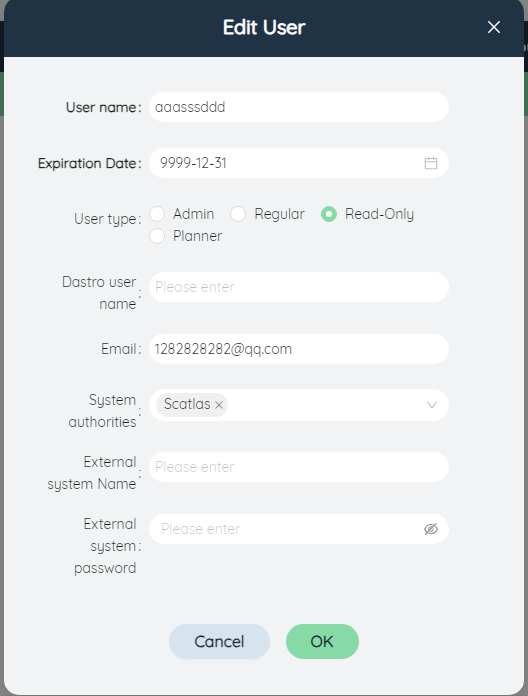
Edit: Click to pop up the dialog box of modifying the user, you can modify the user name, account validity period, user type, and DASTRO user name.
Delete: Click to pop up a confirmation deletion dialog box, and delete the user after confirmation.
# System Configuration
After the administrator logs in, the third function on the left is the system configuration, which includes five settings: ①Baidu Map AK, ②Bing Map AK, ③User password complexity, ④User login maximum time limit (minutes), ⑤DASTRO access address
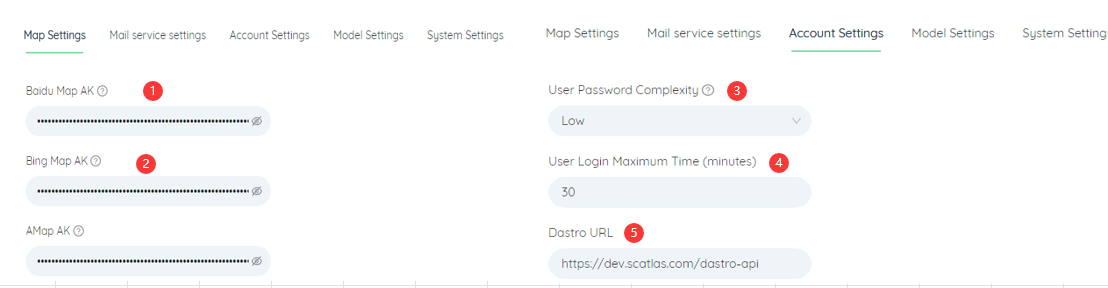
# Baidu map AK
Set Baidu Map AK to access Baidu Map API
# Bing Maps AK
Set up Bing Maps AK for accessing the Bing Maps API
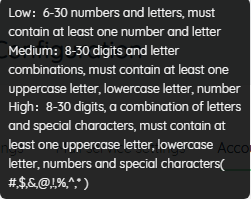
# User password complexity
Contains high, medium and low options. Its definition is as follows
# User login maximum time (minutes)
The default is 120 minutes, that is, after the user logs in for 120 minutes and misuses the account, the account will be automatically logged out.
# DASTRO access address
Fill in the access address of DASTRO
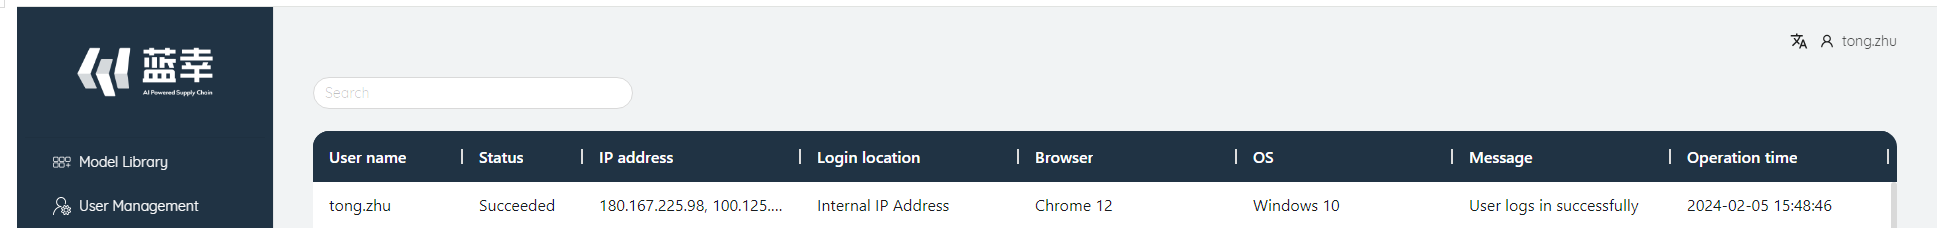
# Login Entry
After the administrator logs in, the fourth function on the left is the login log. Click to pop up the login log of the current system user. Contains the following information: username, status, IP address, login address, browser, operating system, messages, operating time. and can search.