# Help Documentation
# Getting Started
# Install and Log In
# Software Installation
The current version of Dastro is not open for download. If you need to obtain the client installation program, please contact Lanxing customer service ( Support@lanxingai.com ). The current Dastro client is the Windows version, please look forward to subsequent updates for more versions.

Save the client installer anywhere on your computer, such as the desktop, and double-click to run the installer.
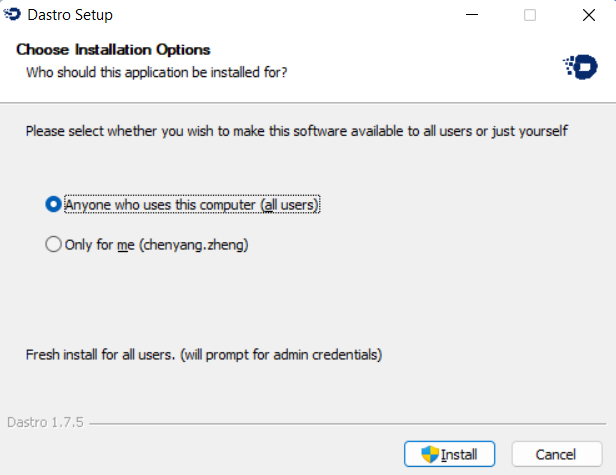
The first step, select the installation user, you can choose to install only for yourself or for all users, and click Install after selecting.
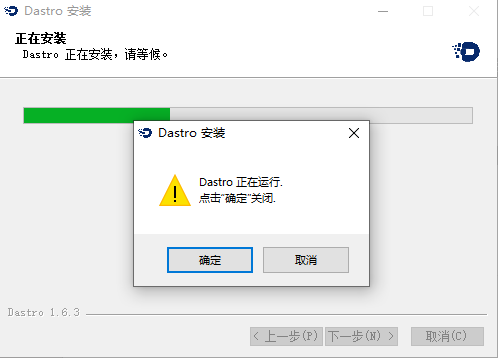
The second step is to wait for the installation process to end. If the Dastro client is currently open, you will be prompted whether to close it. Click OK to close the current client.
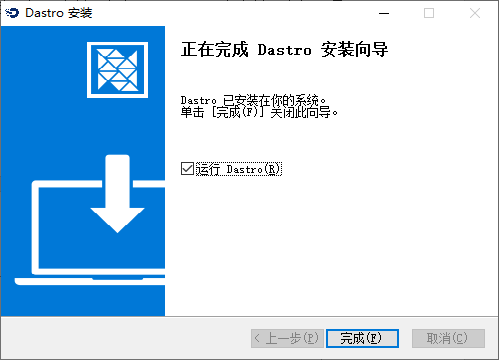
The third step, click Finish to close the installation window, check Run Dastro to start running the client immediately.
# User Login
The current version of Dastro is not open for registration. If you need to obtain the user account and password, please contact Lanxingai customer service ( Support@lanxingai.com ).
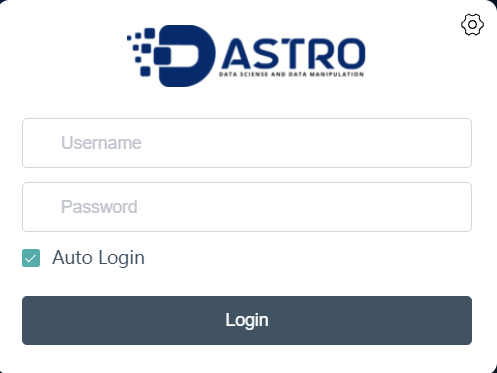
Fill in the user account and password in the following dialog boxes, and click Login.
If you want to see the password in plain text, you can click the password visible icon  in the password box to view the password in plain text.
To avoid entering your username and password again, you can tick the "Automatically log in" checkbox to automatically log in the next time you open Dastro.
# Server Address
To change the server settings for login, you can click the "Apply Settings" icon  in the upper right corner of the login dialog box, and the following dialog box will pop up.
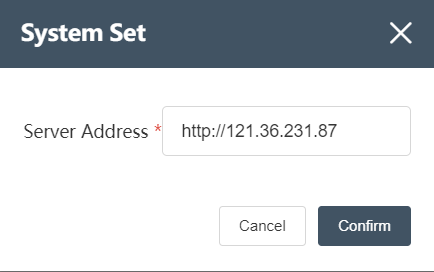
In the dialog box, set the server address to the following format: http://xxx.xxx.xxx.xxx (opens new window) . For specific server settings, please consult the software service deployment engineer, or contact Lanxingai customer service ( Support@lanxingai.com ).
# Software Interface
# Navigation Bar
# Workflow
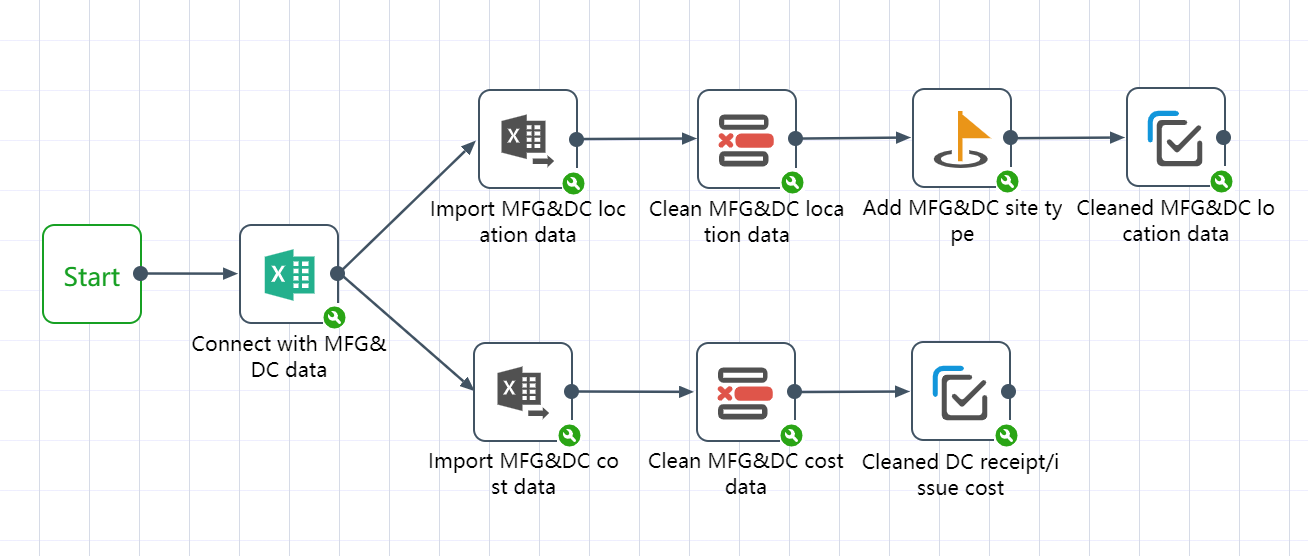
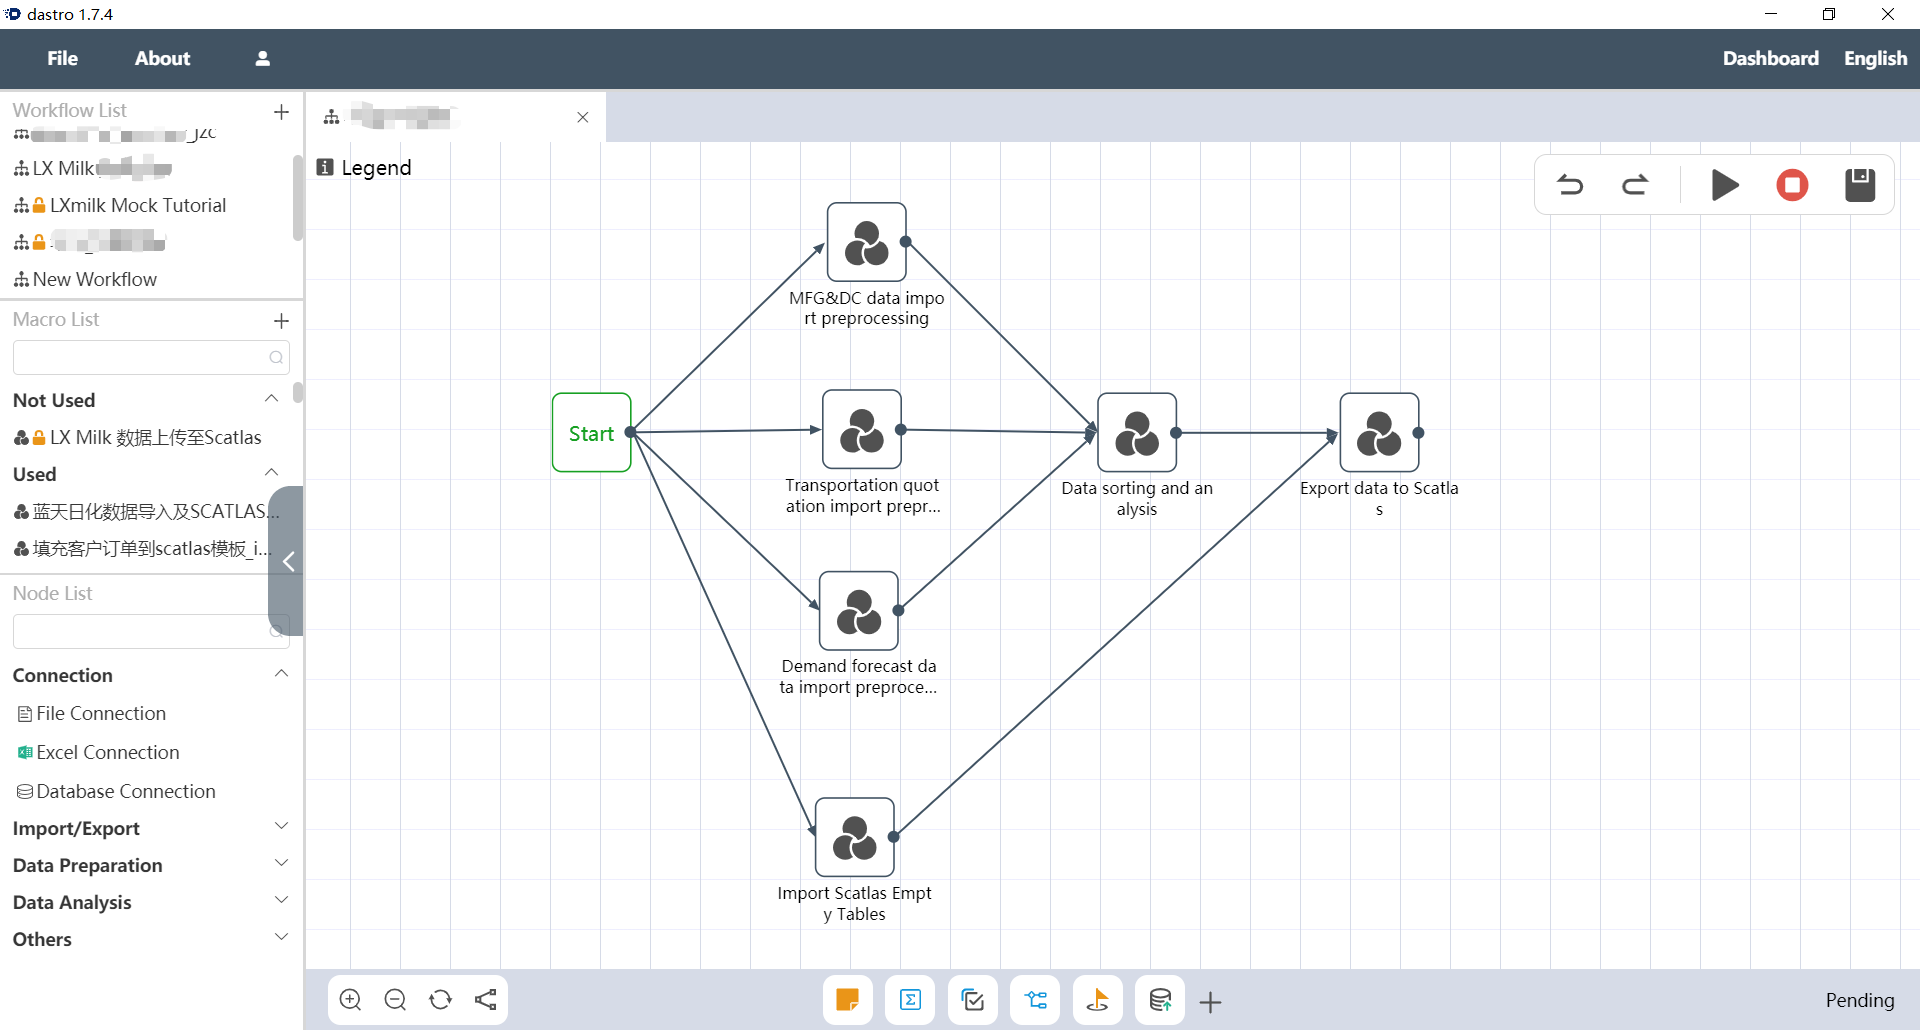
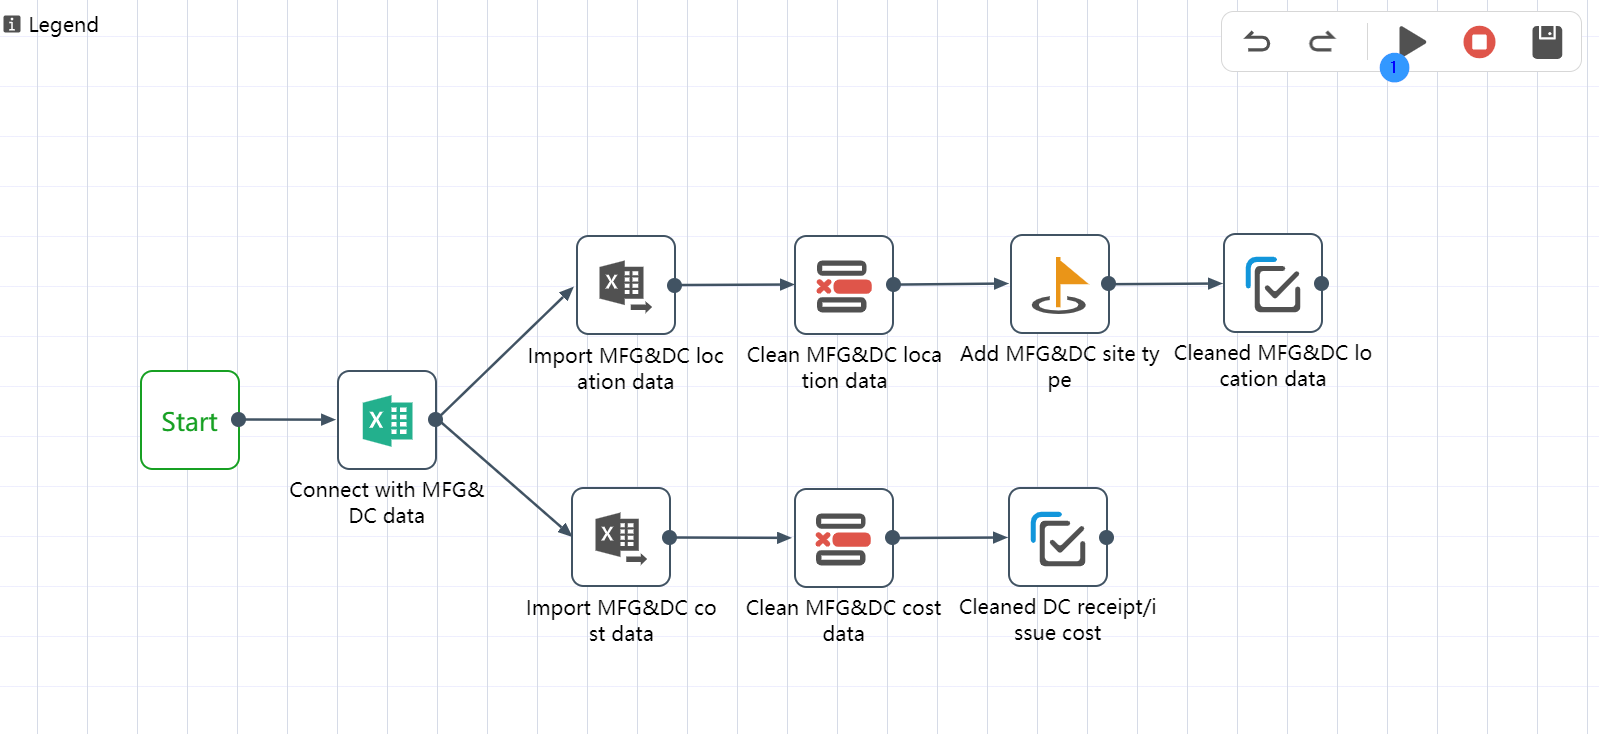
A workflow is a sequence of repeatable, sequential node groups. As shown in the figure below, the canvas is a visual display of the workflow execution process. The workflow always starts with a "start" node, where the order of the node groups is indicated by the arrows connecting them. When the workflow runs as a whole, this also specifies The order in which the node groups are run. Individual nodes cannot be added directly to a workflow, they must be grouped first.
As shown in the figure, in a workflow, it is a good practice to use notepads to group several nodes with similar functions, or nodes in the same process, so that the workflow becomes easier to read and manage.
New workflow
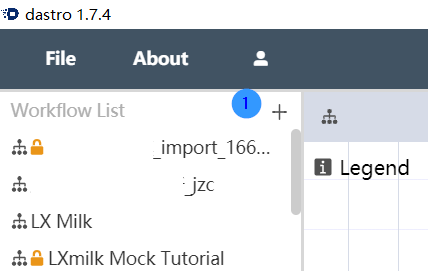
①Click the plus sign in the upper right corner of the workflow editing area on the left to create a new workflow.
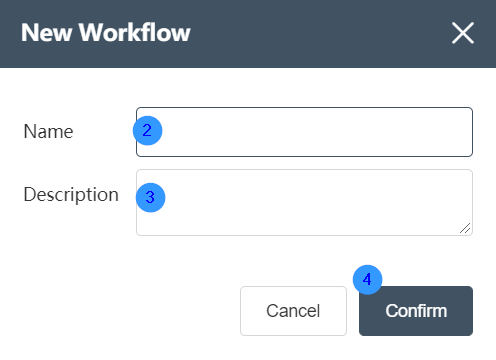
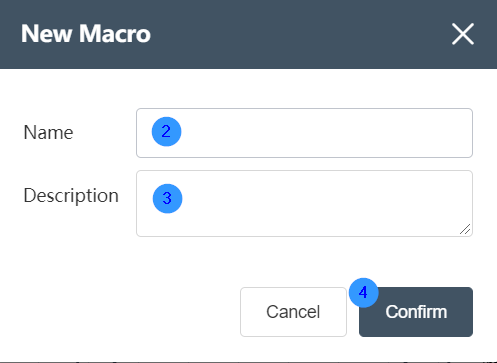
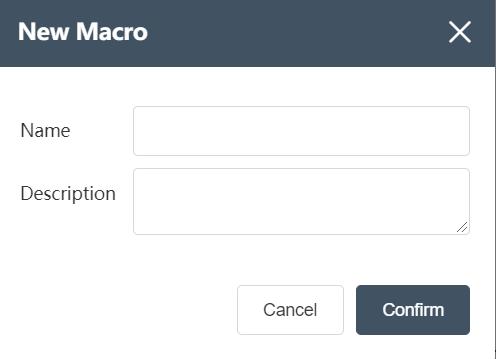
②You can enter the name of the workflow (required) in the new workflow pop-up window that pops up later. When filling in the workflow name, it is recommended to put a special mark, such as the name as a suffix, to prevent the inconvenience caused by repeated names.
③The description of the workflow can be optional
④ Click the OK button in the lower right corner to create a new workflow.
Execute workflow
Double-click the workflow to open it, you can see the entire workflow composed of node groups, and then click the triangle execution button in the upper right corner to execute the entire workflow.
Duplicate workflow
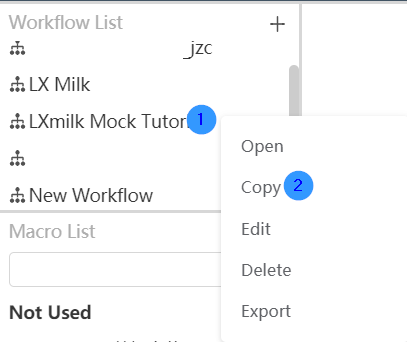

Right-click the workflow you want to copy and select the "Copy" function in the options box. Fill in the custom name suffix in the pop-up window, and then click the "OK" button to successfully copy the workflow.
Edit workflow
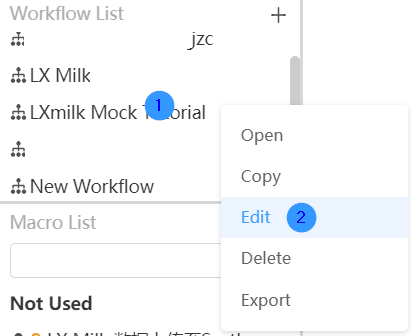
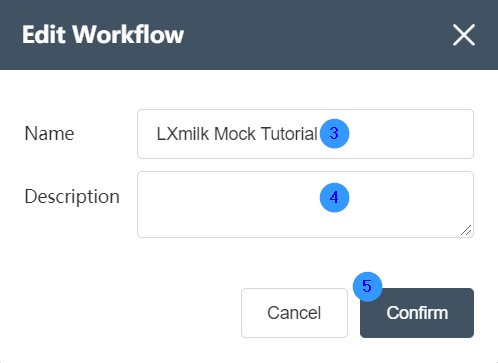
Right-click on the workflow you want to edit and select the "Edit" function in the options box. In the pop-up window, change the name and description of the workflow according to personal needs, and then click the OK button in the lower right corner to successfully modify the workflow.
Delete workflow
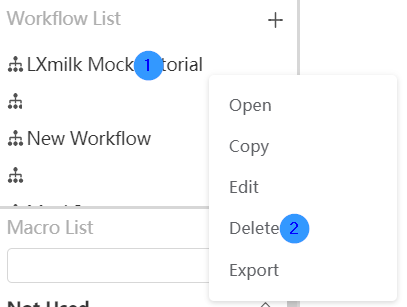

Right-click on the workflow you want to edit and select the "Delete" function in the options box. Select the Confirm button in the pop-up window to delete the workflow successfully.
Export workflow
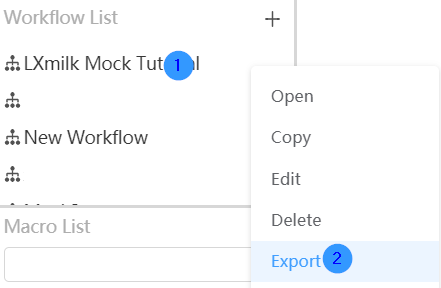
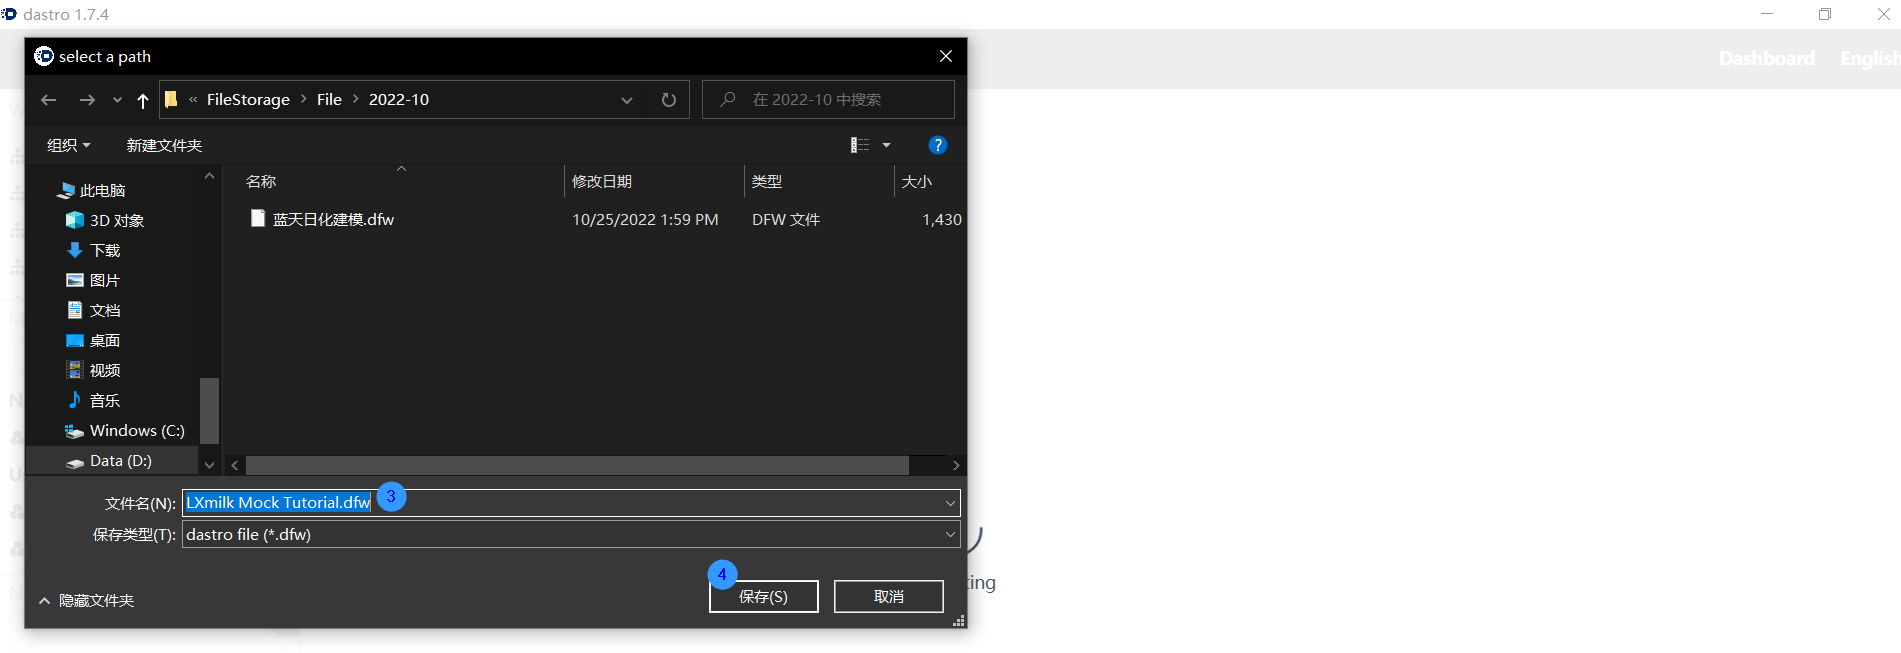
Right-click on the workflow you want to edit and select the "Export" function in the options box. Determine the save path in the pop-up window and click the save button to successfully export the workflow to this path.
lock and unlock
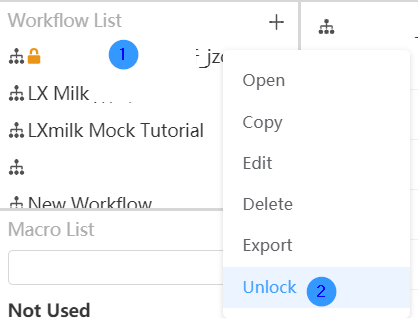
Double-click the workflow name to lock the workflow. The locked workflow name will have a small orange lock in front of it. Right-click the locked workflow to select the unlock function, and click "Unlock" to unlock the workflow. After the workflow is locked, the user cannot modify and delete the workflow.
# Node Group
Create a new node group
Click the plus sign in the upper right corner of the node group editing area on the left to create a new node group. In the new node group pop-up window that pops up, you can enter the name and description of the node group, and then click the OK button to create a new node group. .
execute node group
There are two ways to execute a node group, the first is to click the execute button above the node group icon in the workflow; the second method is to double-click the node group to view the nodes contained in the node group, and then click the upper right Click the execute button in the corner to successfully execute the node group.
Search Node Groups
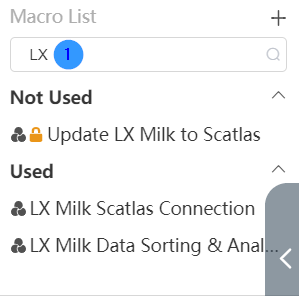
In the node group area on the left, you can see a search box. Enter the name of the node group you want to search for, or the characters contained in the name of the node group, in the search box, and you can successfully search for the node group.
Copy node group
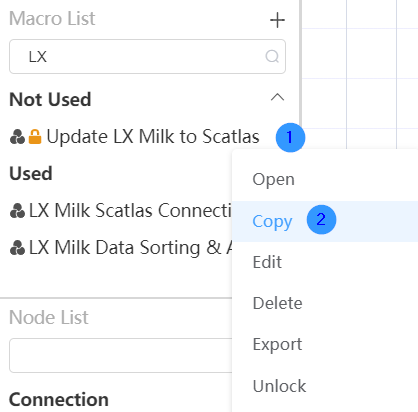

Right-click the node group you want to copy, and select the "Copy" function in the options box. Fill in the custom name suffix in the pop-up window, and then click the "OK" button to successfully copy the node group.
Edit node group

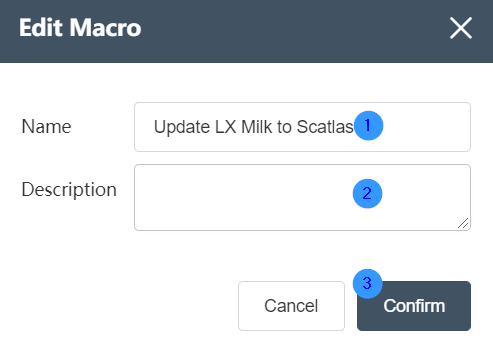
Right-click the node group you want to edit, and select the "Edit" function in the options box. In the pop-up window, change the name and description of the node group according to your personal needs, and then click the OK button in the lower right corner to successfully modify the node group.
delete node group
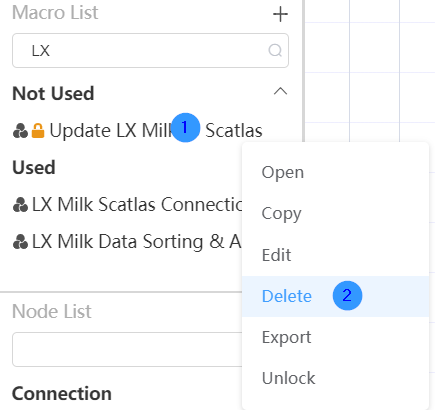

Right-click the node group you want to edit and select the "Delete" function in the options box. Select the OK button in the pop-up window to successfully delete the node group. The node group cannot be deleted if it is already in use or if the node group is locked.
export node group

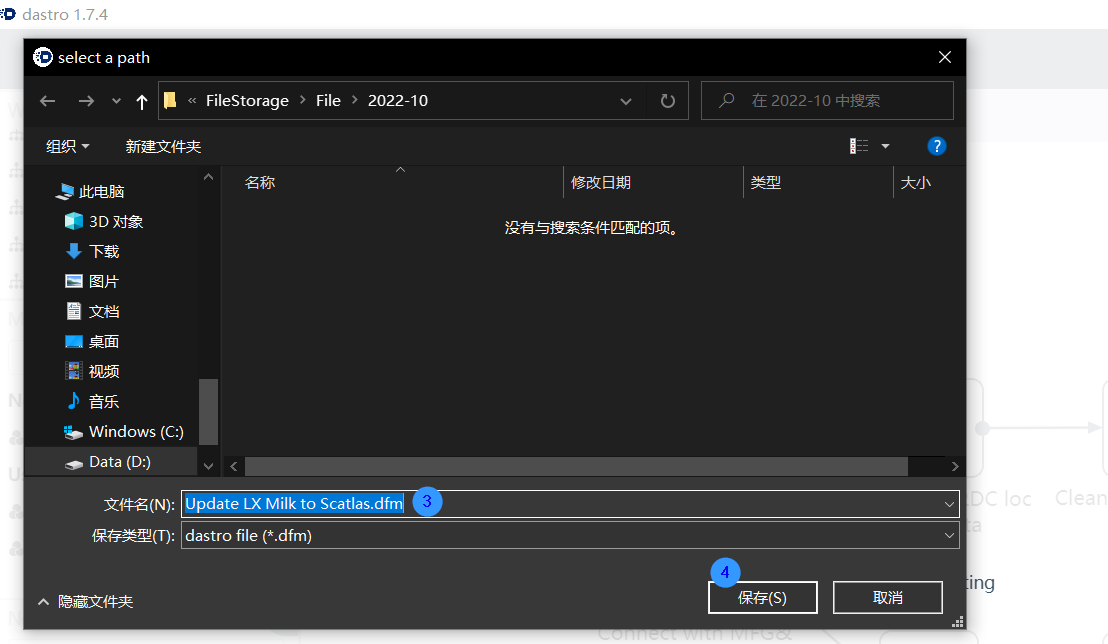
Right-click the node group you want to edit and select the "Export" function in the options box. Determine the save path in the pop-up window and click the save button to successfully export the node group to this path.
lock and unlock
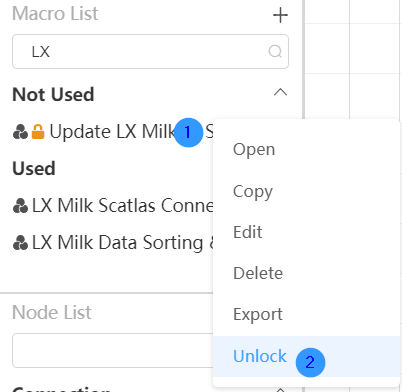
Double-click the node group name to lock the node group. The locked node group name will be marked with an orange lock. Right-click the locked node group to select the unlock function, and click "Unlock" to realize the unlock function of the node group. After the node group is locked, the user cannot modify and delete the node group
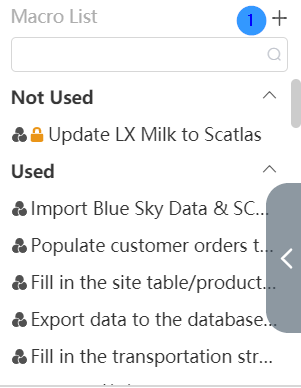
Node group not used
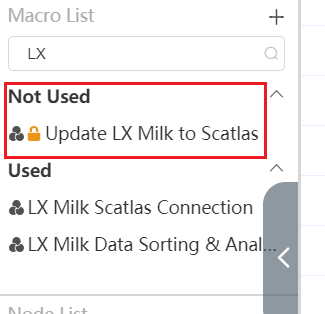
Node groups that have been used by the workflow will be classified into the "Used" node group, and the node groups displayed under the Unused tab will show the node groups that have never been used by any node group.
# Node
new node

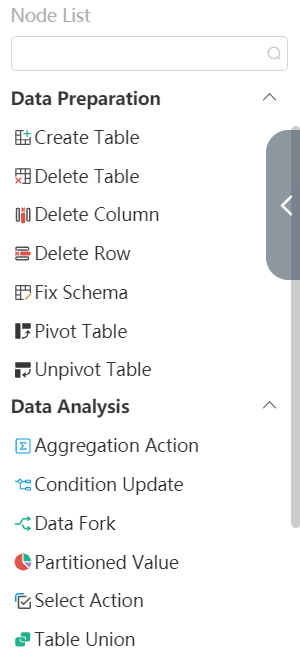
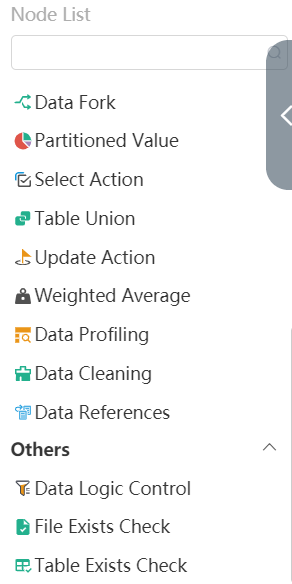
The editing area of the node on the left is divided into five drop-down options according to the node function, namely data connection (including three nodes); import and export (including eight nodes); data preparation (including seven nodes); data analysis (including ten nodes) one node); the other (contains three nodes).
execution node
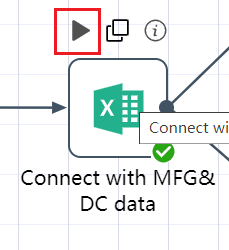
There is an execution button on the icon of each node, and the operation of the node can be implemented by clicking the execution button with the left mouse button.
①Copy node
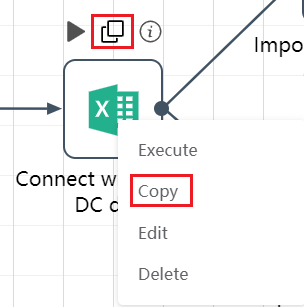
②The copy operation can be realized through the copy icon above the node. The copied node cannot have the same name as the previous node, otherwise an error will be reported;
③Right-click the node, you can also choose to copy, the same function as the copy icon above the node.
Node parameters
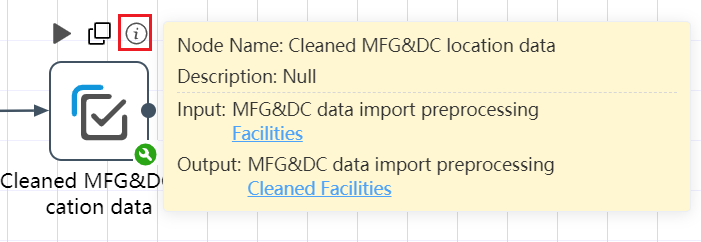
Click the icon ⓘ on the far right above the view node to view the parameters of the node such as node name, node description, last execution time and result. If it is a data processing node, you can also see a list of input and output data. Click the table name of the input and output data, you can view the details of the data in the new interface or check the processing result of the node.
# Other Functions
Collapse the navigation bar
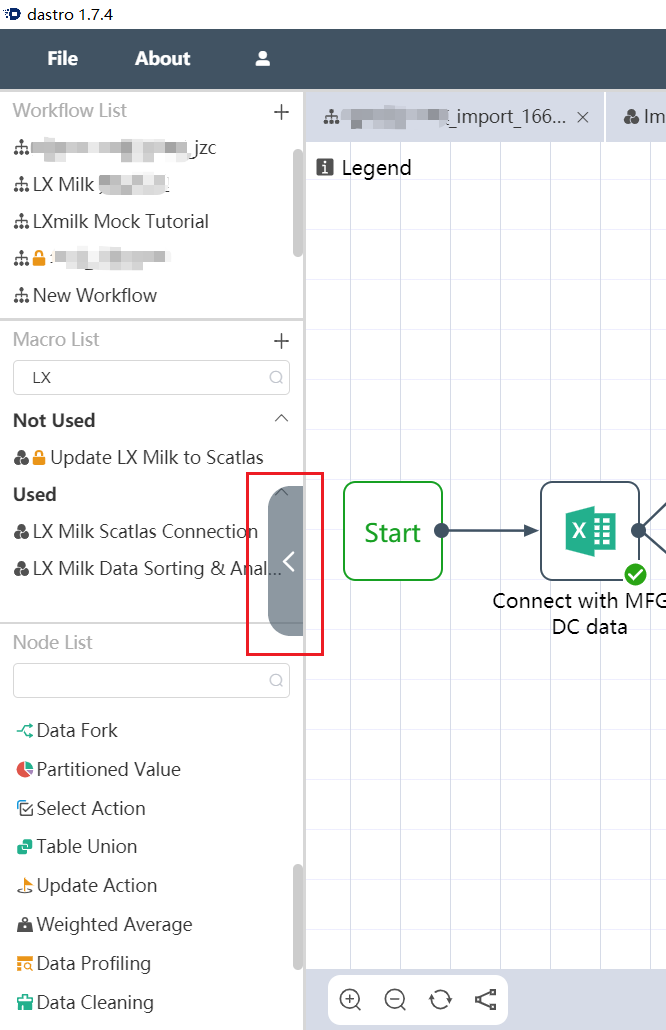
If you want to retract the navigation bar, you can click the retract button in the figure to retract the navigation bar.
Adjust the size of the navigation bar area
The left navigation bar is divided into three parts: Workflow, Node Group and Node Area. If you can customize the size of each area of the navigation bar through the mouse. Place the mouse on the dividing line between the two editing areas until the mouse becomes a combination of double horizontal lines and up and down arrows. You can adjust the size of the navigation bar area by dragging and pressing the mouse with the left button.
# Workflow Canvas
# Tab Management

The opened tabs will be displayed above the canvas. Different tabs can be distinguished by the names of nodes or workflows. Above the canvas, you can click the close button on the far right of each tab to close the tab.
# Run Canvas
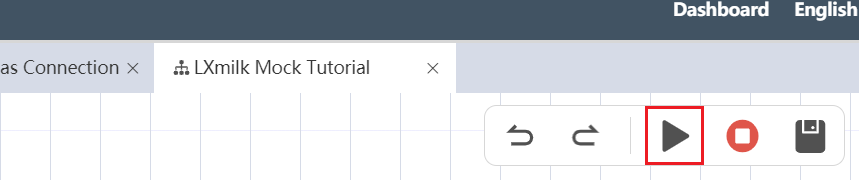
The operation of the entire canvas can be achieved through the execution button in the upper left corner of the canvas to run the content of the entire canvas: a workflow or a node group. In the canvas, the node or node group that is connected to the "start" at the front end will run with the execution button, but if a node or node group is not connected to the "start" without the front end, even if the entire canvas is executed, it will not run.
# Node and Node Group Connections

The connection of a node to a node group is represented by a black line with a single arrow, in a node or node group icon, the connection line on the left connects to the upstream node or node group, the end point is represented by an arrow, and the connection line on the right connects to the downstream A node or group of nodes, the starting point is indicated by a black dot.
To add a new connection, you can click the black dot in the right center of the upstream node group, click and drag it to the left connection of the downstream node group, and a black connection line appears between the two node groups to indicate that the connection is successful; if you want to delete the connection line, Simply click the X mark in the middle of the connection line to delete the connection line.
# Node and Node Group Operations
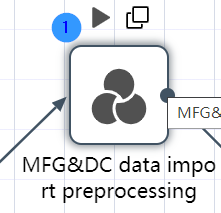
In addition to the start node, when the mouse hovers over each node group in the canvas, two node group action buttons are displayed: Run and Copy.

Run: Click to run only the current node group.
Copy: Click to pop up the custom name suffix dialog box, the input suffix will be connected with an underscore, and added to the end of the current node group and its nodes as the new name of the copied node group and node. For example, if the current node group name is "Data Collation and Analysis Example", which contains the node "Factory Warehouse Location Table Import", and the suffix input is 2, the node group name after copying is "Data Collation Analysis Example 2", "Factory Warehouse Location Table" Import 2"

When the mouse hovers over each node in the canvas, three node action buttons are displayed: Run, Copy and Node Info

Run: Click to run only the current node
Copy: Click to pop up a copy dialog box, and the word "_copy" has been automatically added after the name. After correct setting and confirmation, a copy node can be added to the current canvas.
Node information: Click to display the basic information of the node, including node name, node description, last execution result, and node-related operation information, including input, output, target table, reference table, etc.
# Status Description


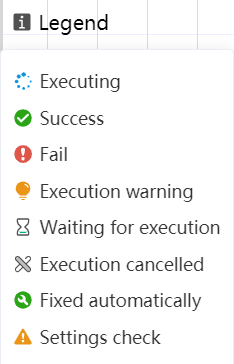
There will be various status displays in the lower right corner of the node group, prompting the user about the current status of the node, and nodes that are not connected to the start line will not have any prompts.
- Running: The current node is running.
- Executed successfully: The status of the node executing successfully.
- Execution failed: The status of the node's execution failure.
- Execution early warning: refers to the state of early warning after the front node modifies the table field, and the post node cannot judge whether the modified table field can be processed or not.
- Waiting for execution: After running the full node group, this node waits for the status of the execution of the previous session to complete.
- Cancel execution: Refers to the status of waiting to cancel or abort the running of a node after running a node or node group.
- Auto-repair: Refers to the state in which the post-node is automatically repaired according to the output content after the pre-node is re-run.
- Early warning error: refers to the state that after the front node modifies the table field, the post node cannot process the modified table field, and the early warning error state.
# Scaling and Typesetting

①Zoom: You can zoom and enlarge the entire canvas through the ⊕ ㊀ symbol in the lower left corner of the canvas; or you can control the size of the canvas through Ctrl+mouse wheel, for example, hold down Ctrl and slide the mouse wheel up to zoom in on the canvas , hold down Ctrl and slide the mouse wheel down to zoom out the canvas.
②Typesetting: The automatic typesetting of nodes or workflows can be realized through the icon on the far right in the lower left corner of the canvas, or it can be adjusted manually.
# Quick Node Bar

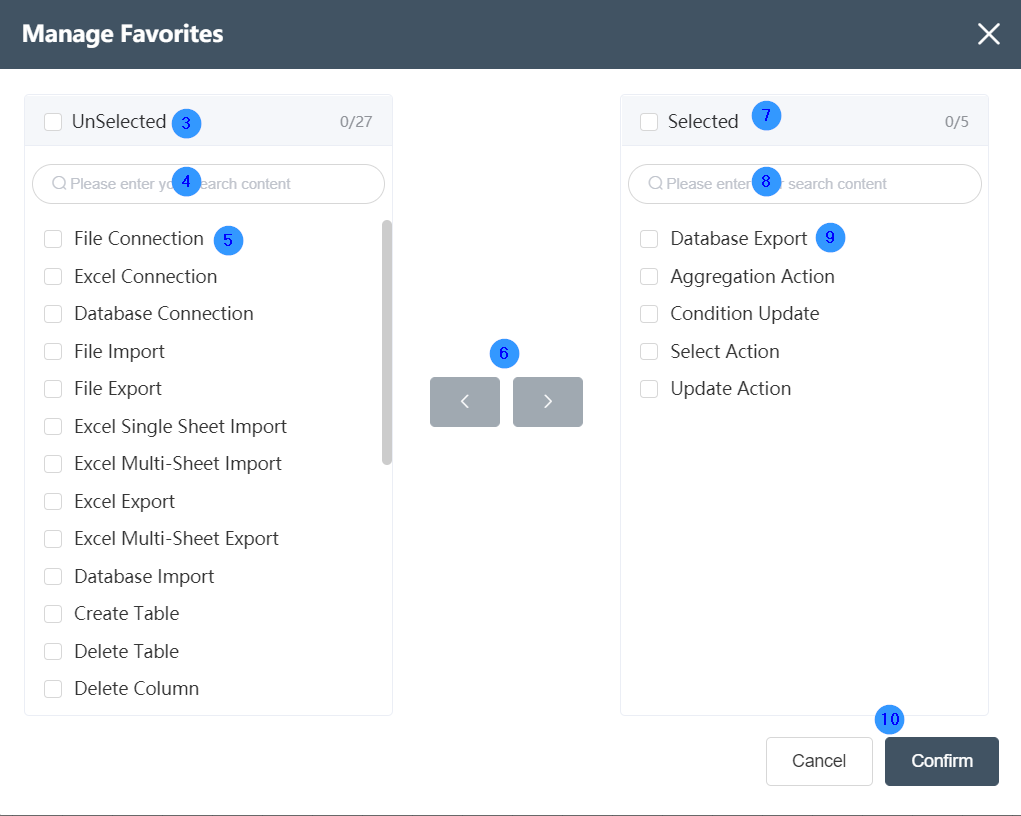
①Some commonly used nodes will be displayed just below the canvas. You can add any type of nodes in the quick node bar, and add up to nine commonly used nodes.
②The plus sign on the right side of the quick node bar can be used to edit the nodes contained in the quick node bar, and the content in the quick node bar can be edited in the pop-up edit box.
③The optional node area will display all the nodes that are not included in the quick node bar. Check the optional nodes to select all optional nodes with one click. The numbers on the right have two meanings, the numbers to the left of the "/" represent any optional nodes that have been checked, and the numbers to the right of the "/" represent the total number of all optional nodes.
④The search box in the optional node area can support fuzzy matching query in all optional nodes, just enter the query content.
⑤The area below the optional node is to display the specific node name, which can be added to the common node column by checking it.
⑥Click the left and right buttons in the middle to add optional nodes to common nodes, or to remove common nodes from the common node bar.
⑦The common node area will display all the nodes contained in the quick node bar. Check the common nodes to select all common nodes with one click. The numbers on the right have two meanings, the numbers to the left of the "/" represent any common nodes that have been checked, and the numbers to the right of the "/" represent the total number of all common nodes.
⑧ The search box in the common node area can support fuzzy matching query in all common nodes, just enter the query content.
⑨ The area below the common node is to display the common node bar including all the node names, and the common node bar can be eliminated by checking it.
# Datasheet Overview
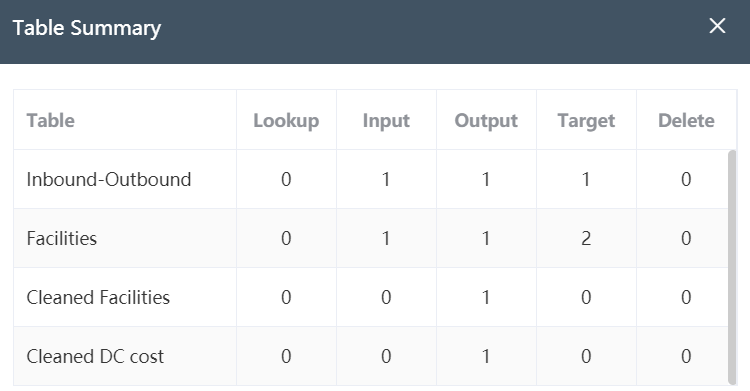
The data table overview is in the lower right corner of the canvas. It only appears in the canvas of the node group, that is, only when all nodes are displayed on the canvas, the data table overview button can be seen. Click the Data Table Overview button in the lower right corner,
# Error Message

When a node group or workflow fails to run successfully, an error message will be displayed in the lower left corner of the canvas. Users can check the cause of the error according to the error message, or check the cause of the error through the parameters of the node (the upper right corner of each node)
# Menu Bar
# Document
New workflow
Create a new node group
Click the file in the upper left corner of the Dastro menu bar, select New Node Group in the menu, you can also realize the new function of the node group, as long as you edit the node group name, description and other information in the new node group editing interface that pops up, and then click the OK button The new node group is completed.
save
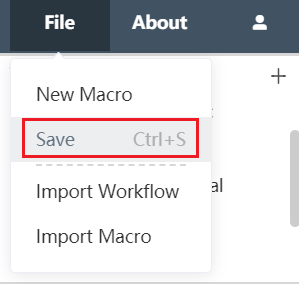
Click the file in the upper left corner of the Dastro menu bar, select Save in the menu, or directly press Ctrl and S simultaneously on the keyboard to save the current workflow or node group.
Import workflow
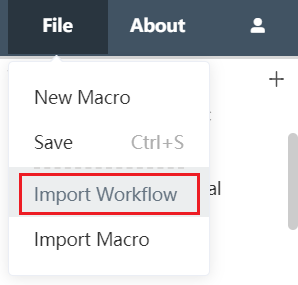
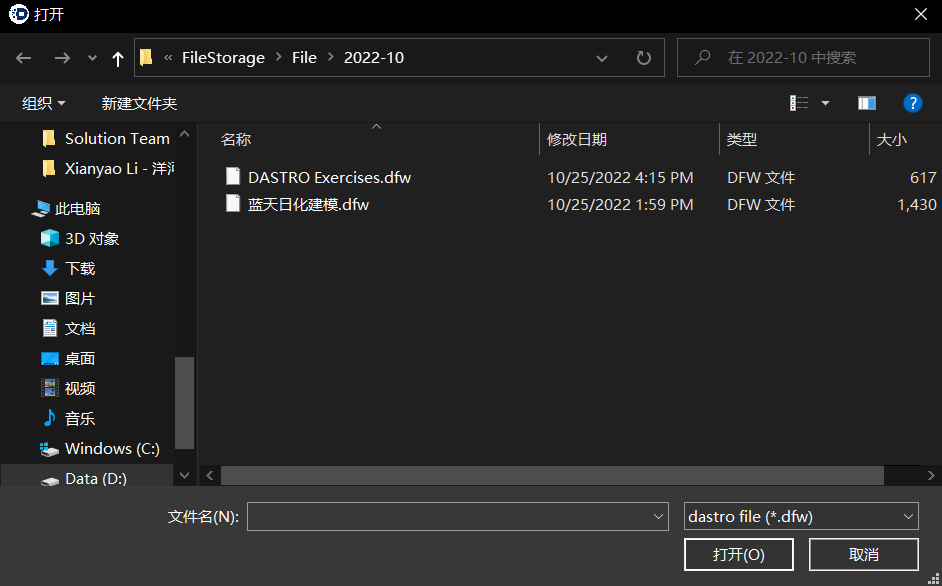
Click the file in the upper left corner of the Dastro menu bar, select Import Workflow in the menu, and find the path of the workflow to be imported in the subsequent pop-up window. The imported workflow file type must be dastro file, and the file extension must be .dfw.
Import node group
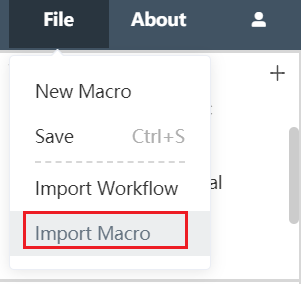

Click the file in the upper left corner of the Dastro menu bar, select Import Node Group in the menu, and find the path of the node group to be imported in the subsequent pop-up window. The imported node group file type must be dastro file, and the file extension must be .dfm.
# User Menu
Personal information

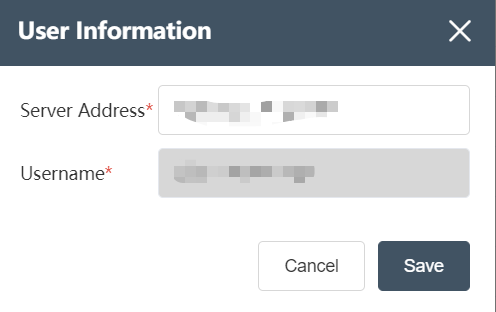
After entering the Dastro editing interface, find the user icon in the upper left corner, click the icon with the left mouse button, select Personal Information in the menu bar, and the pop-up window will display the server address and user name. The server address can be modified, but the user name cannot be changed.
User Management

Only super administrator users can use this function, click to pop up the user management dialog box.
- Search Toolbar: Enter text in the search box to search the user list by username. On the right is the role type filter box. You can select all roles, super administrators, ordinary users, and advanced users to filter the list.
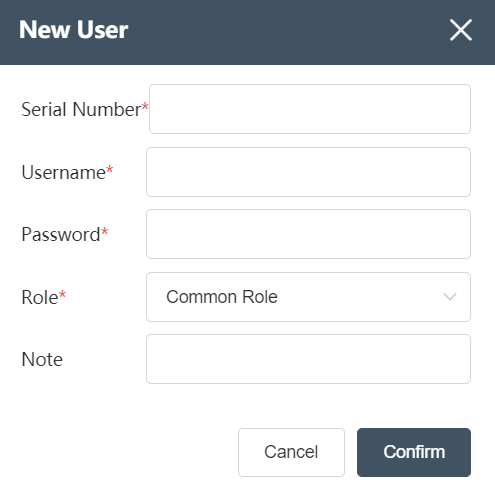
- Create User: Click to pop up the Create User dialog box, fill in the correct serial number, user name, password, role type, remarks (not required), and click OK to create a new user. To obtain the correct serial number, please contact Lanxingai customer service ( Support@lanxingai.com )
- User list: Each row is a user, and each user has the following 5 columns of information: role, user name, remarks, creation time, number of workflow creations, number of node groups created, number of node groups with permissions, executable related Actions are in the last column. The three columns of the number of workflow creations, the number of node groups created, and the number of node groups with permissions can be clicked to open to display the specific list. If the user list is too long, you can use the page number marked ⑤ and the left and right arrows to turn the page.
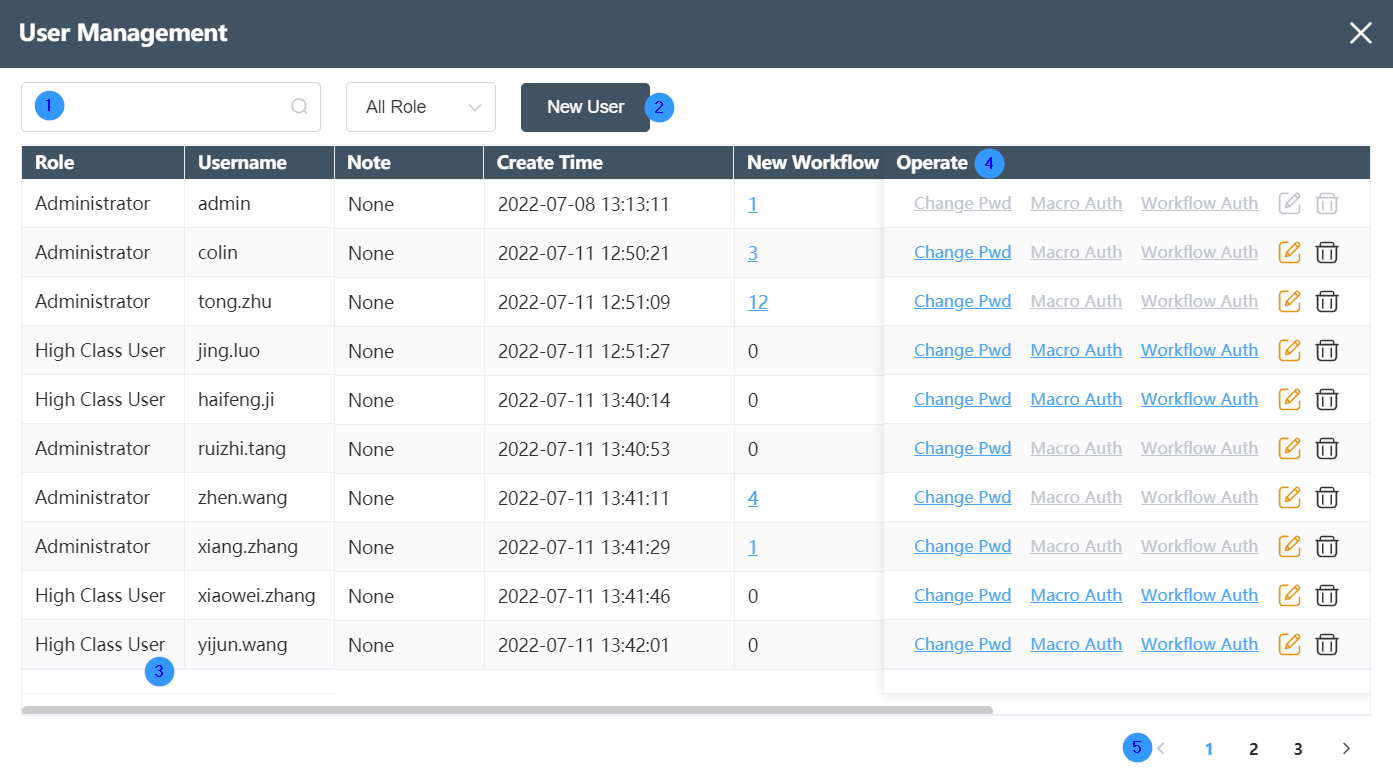
- User operations: Each user can perform up to 5 operations, from left to right: modify password, node group permissions, workflow permissions, edit user roles, and delete users.
- Modify password: After entering the administrator password and entering the new user password twice, the user password can be modified.
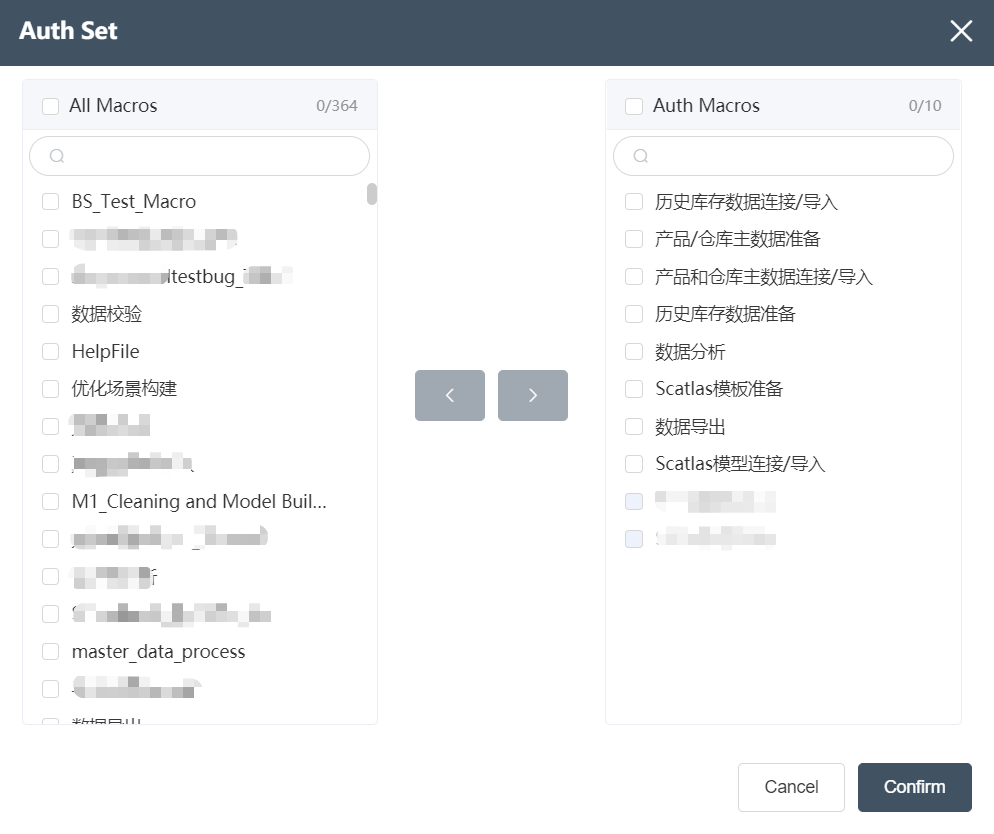
- Node group permissions: Click to pop up the node group permissions management dialog box, which displays all node groups and the node groups that the user currently has permissions for. Both lists can be searched in the search box. After selecting the node group in the list on the left, use the ">" add button to add the node group to the user, and use "<" to delete the selected node group in the list on the right. Only node groups to which the user has permission can edit.
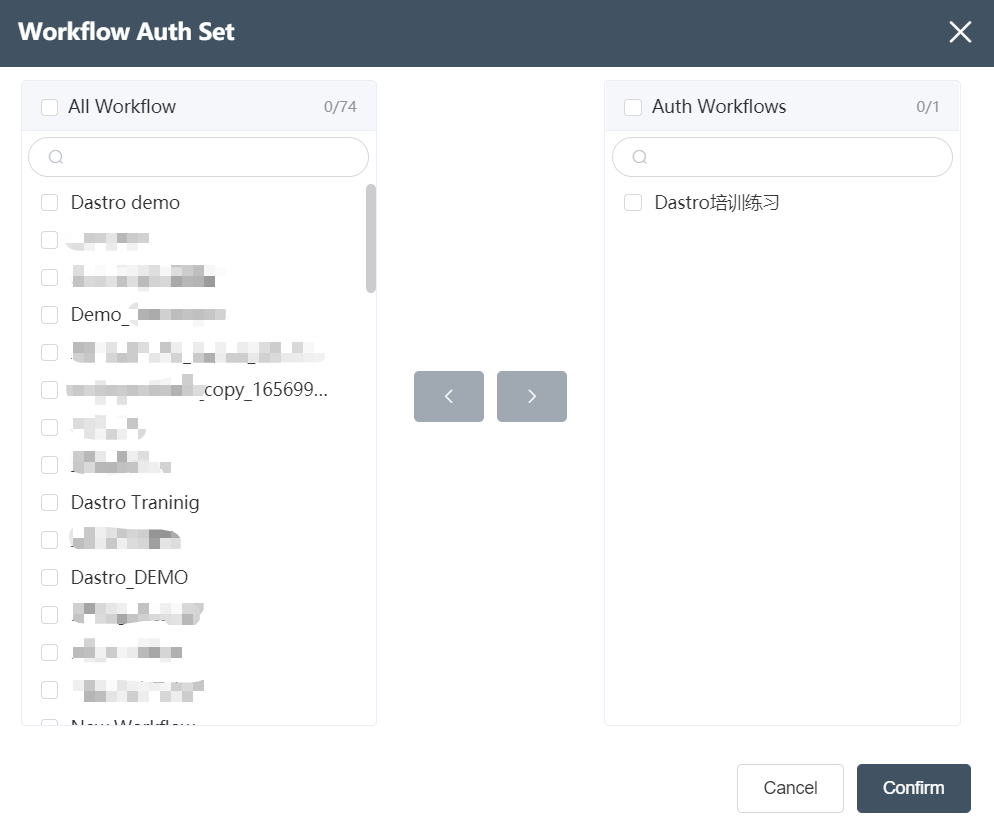
- Workflow Permission: Click to pop up the Workflow Permission Management dialog box to display all the workflows and the workflows that the user currently has permission to. The editing method is the same as that of the node group. The workflows created by the user always have permission and cannot be deleted.
- Edit User Role: Click to open the User Role Editing dialog box, you can change the user role.
- Delete user: Click to pop up a confirmation dialog box, click OK to delete the user.
change Password
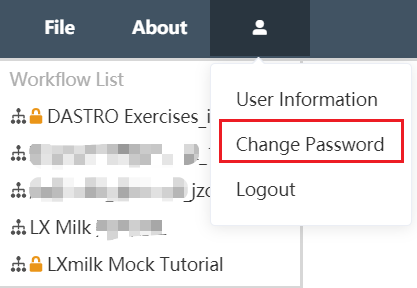

After entering the Dastro editing interface, find the user icon in the upper left corner, click the icon with the left mouse button, and select Modify Password in the menu bar to modify the password in the pop-up window. To change the password, you need to enter the password of the current account in the old password field, enter the new password to be modified in the new password, and then enter it again after confirming the new password. However, the input of the new password must be consistent with the input content of confirming the new password in order to modify it successfully.
sign out
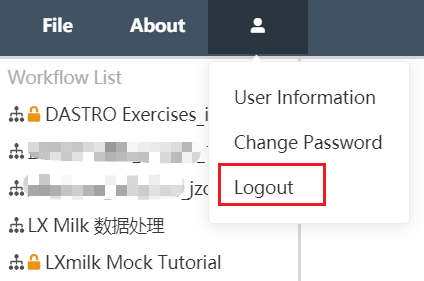
After entering the Dastro editing interface, find the user icon in the upper left corner, click the icon with the left mouse button, and select logout in the menu bar. You can immediately log out and go directly back to Dastro's login interface.
# Dash Board

Displays the name, lock status, current execution status, and last execution completion time of all workflows that the current user has permission, and can perform operations such as unlocking, viewing, editing timing cycles, and deleting.
# Language Selection


Click the language in the upper right corner of the Dastro canvas to switch the language. Currently, only Chinese and English are supported. If the system language of the current interface is Simplified Chinese, the words "Simplified Chinese" will be displayed in the upper right corner, and you can click to convert to English.
# Node Function
# Data Connection Node
# File Connection

# Parameter Settings
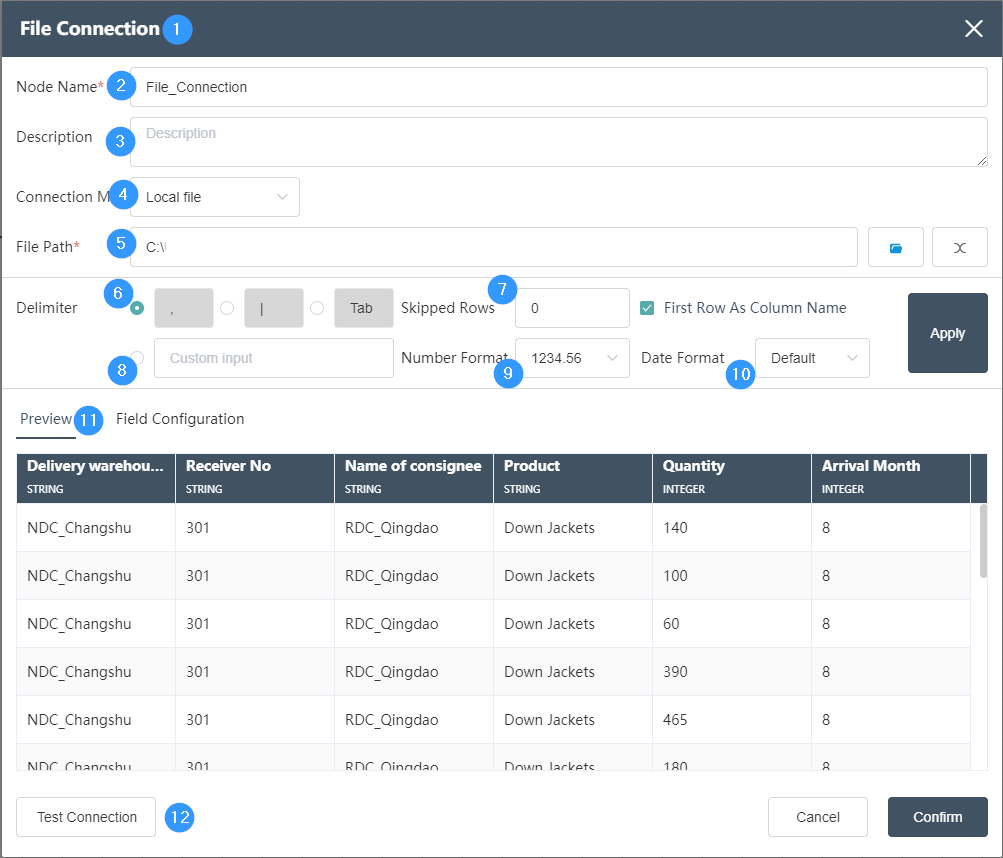
①New Node -> File Connection, you can drag and drop the node to the canvas or select the new file connection node.
②Node name: Display the name of the node on the canvas.
③Node description: The custom description of the node function, displayed when the node information button is clicked on the canvas.
④Connection mode: 
You can select the local file/network file/FTP file from the drop-down box, select the corresponding connection mode according to different file storage methods, and select the local file by default.
⑤File path: You can directly find the connected file in the file path. The file type needs to be csv or txt file.
⑥Delimiter: CSV files can choose different delimiters such as ",", "|", "Tab", etc. The specific delimiter can be determined according to the imported file delimiter. The correct choice of delimiter affects the accuracy of the data read.
⑦Number of skipped lines: You can fill in the number of skipped lines, and you can skip lines when reading. If you fill in and skip 100 lines, you can skip the first 100 lines when reading data, and start reading from line 101. Pick. If the first column is selected, the first column will not be skipped.
⑧Delimiter: Custom input delimiter can be implemented. The delimiter applicable to the file does not belong to any one of ",", "|", and "Tab".
⑨Number format: 
You can edit and define the way the number is displayed, whether there is a thousandth display.
⑩ Date format: 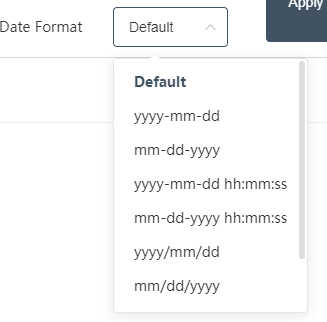
You can define different date formats to display.
⑪Preview: Click Preview to preview the read data.
⑫ Test the connection.
Fields with "*" are required fields.
# Excel Connection

# Parameter Settings
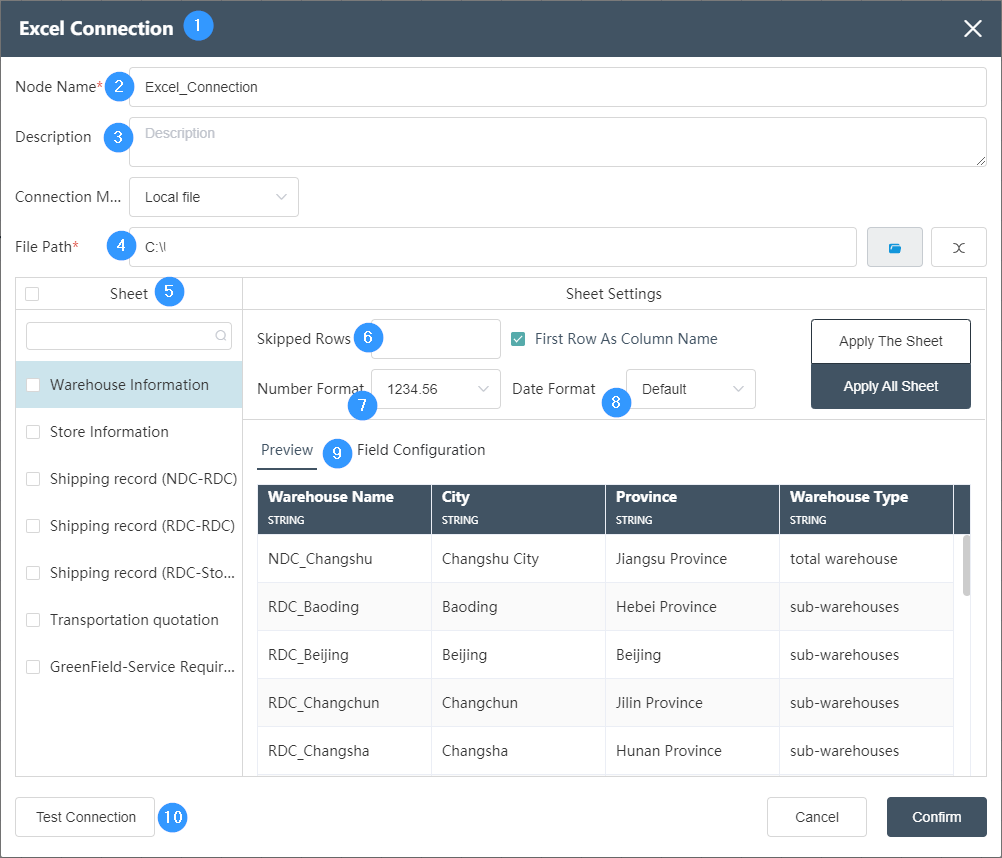
①New Node -> File Connection
②Node name: Display the name of the node on the canvas.
③Node description: The custom description of the node function, displayed when the node information button is clicked on the canvas.
④Connection path: You can directly find the connected file in the file path
⑤Sheet sheet: Display the name of the Excel sheet to be imported.
⑥ Number of skipped rows: You can fill in the number of skipped rows, you can skip rows when reading, and select the first column as the column name, the first column will not be skipped.
⑦Number format:
You can edit and define the way the number is displayed, whether there is a thousandth display.
⑧ Date format:
You can define different date formats.
⑨Preview: Click Preview to preview the read data.
⑩ Test the connection.
# Database Connection

# Parameter Settings
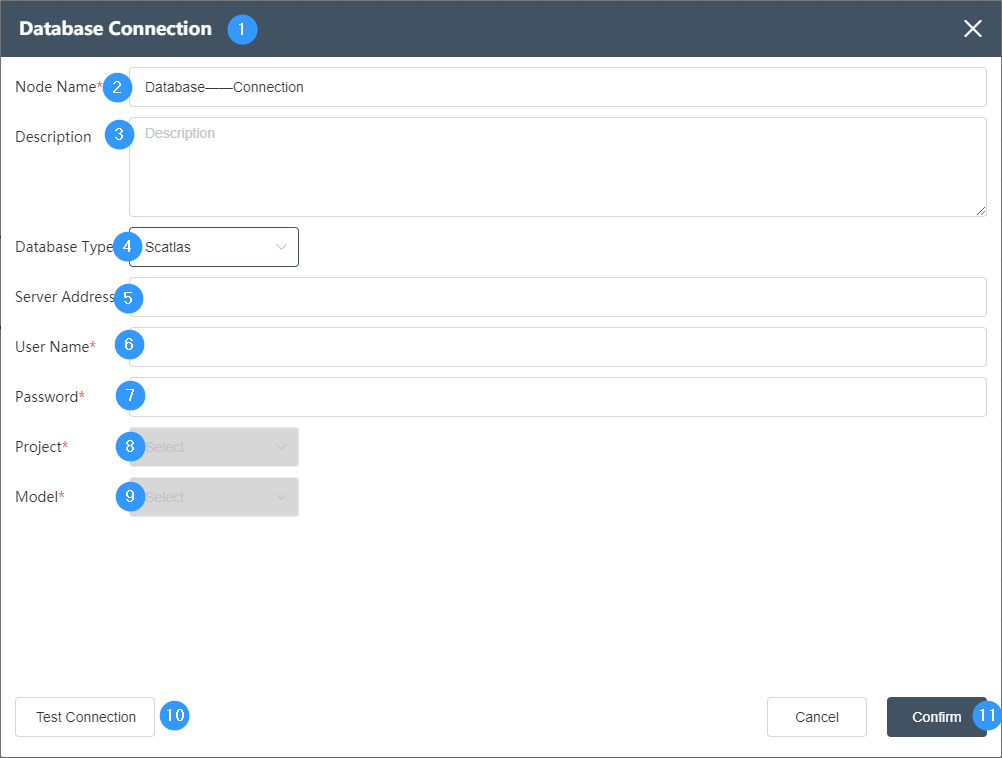
①New Node -> Database Connection
②Node name: Display the name of the node on the canvas.
③Node description: The custom description of the node function, displayed when the node information button is clicked on the canvas.
④Database type: 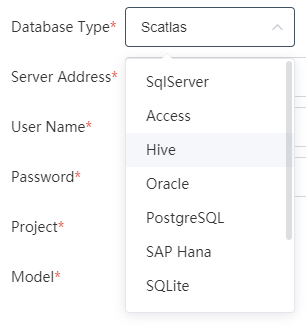
The drop-down box can select the database type. Commonly used are SqlServer, PostgreSQL, MySQL, Local DB, Access, Hive, etc. You need to select the corresponding database type according to the type of database to be connected.
⑤Server address: fill in the server address of the database, if it is a local database, enter localhost
⑥Account: Fill in the username used by the database account
⑦Password: Fill in the password of the user name, which needs to be completely corresponding to successfully connect to the database.
⑧Folder: Select the folder where the database is located or select the corresponding database name
⑨Model selection: Select the database to be connected.
⑩Test connection: Click to test the connection
⑪Confirm button: Click to confirm.
# Import and Export Nodes
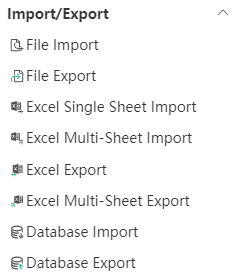
# File Import

# Node Function
This node is used to import data stored in csv or txt file format, and the imported data can be stored in a new table in the DASTRO database.
Basic Information Tab
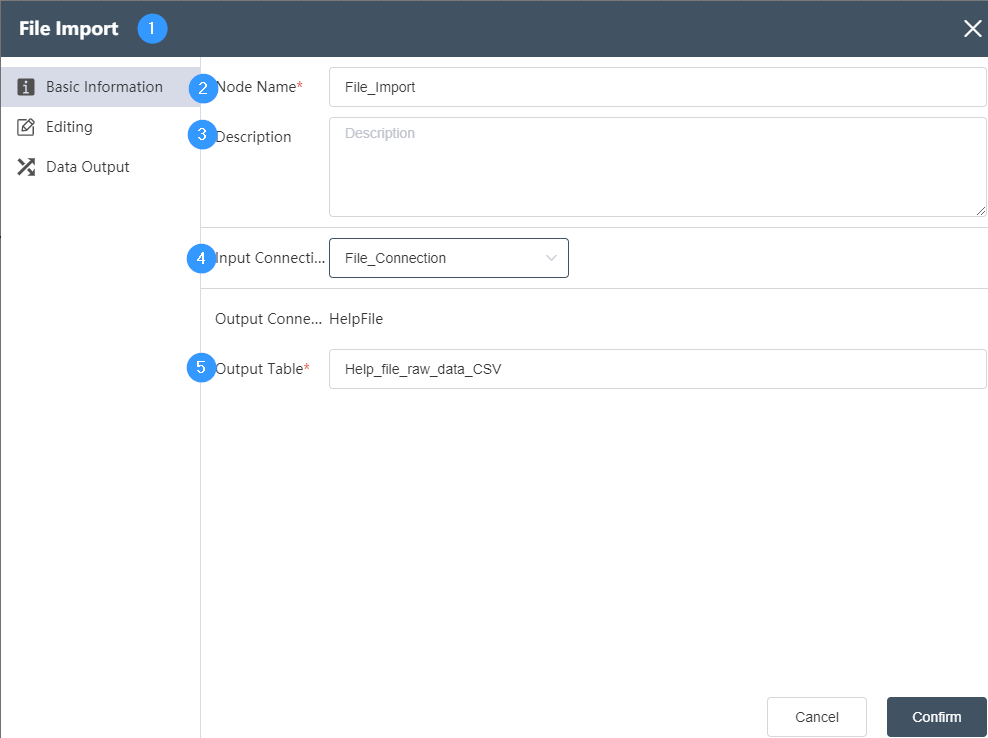
①Basic Information Tab: select this item to edit the basic information of the node
②Node name: Display the name of the node on the canvas.
③Node description: The custom description of the node function, displayed when the node information button is clicked on the canvas.
④ Input connection: Determine the data source of the node, and select the data source of the database connection node in the same node group.
⑤Table name: Determine the corresponding table name contained in the connection database
Data Editing Tab
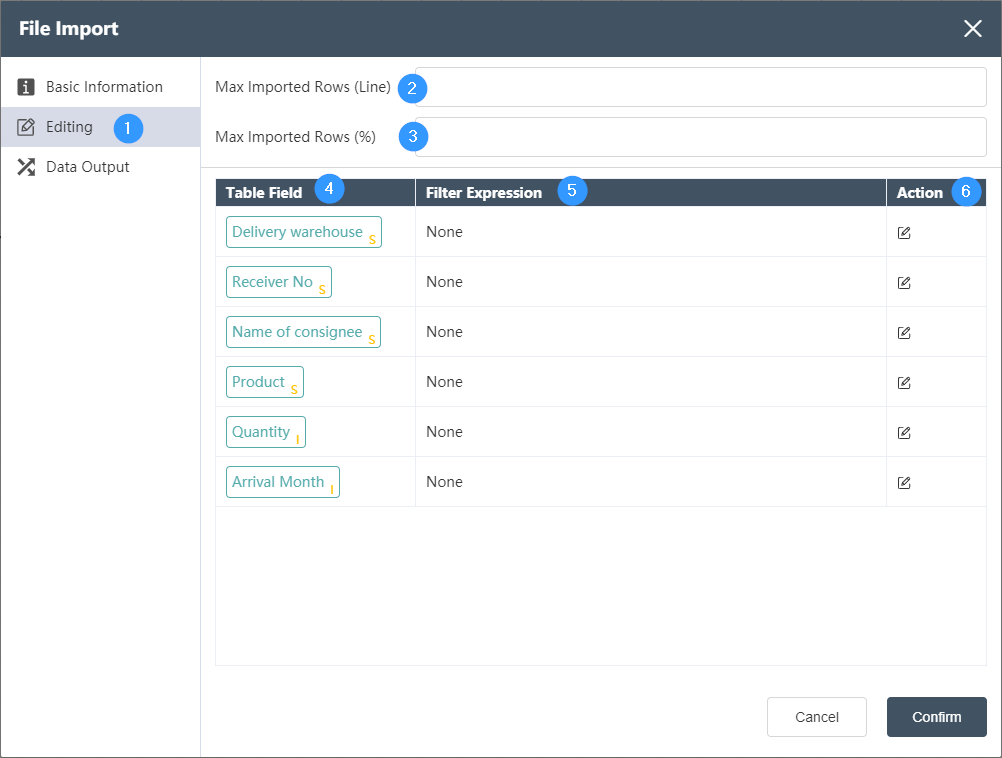
①Data editing: Data filtering can be performed on each field of the input table determined in the basic information.
②Maximum import lines (LINE): Fill in the maximum number of lines that can be read, for example, fill in 100 to read the first 100 lines of data. If it is filled in at the same time as the maximum import line (%) and the restriction range is different, the smallest range shall prevail.
③Maximum imported rows (%): The total percentage of read data can be filled in, for example, if 50 is filled in, the first 50% of the data will be read. If it is filled in at the same time as the maximum import line (LINE) and the restriction range is different, the smallest range shall prevail.
④Table Field: Automatically list all table fields in the input table, the letter in the lower right corner indicates the type of the field, I (Integer) integer, S (String) string, F (Float) decimal. For the correspondence between other field symbols and types, please refer to the following correspondence table.
⑤Filter expression: used to display the logic determined in the operation
⑥Operation: Determine the filtering of the field. Two logics can be connected by AND (and) and OR (or). For integer and decimal type fields, the optional logics are = (equal to), > (greater than), < ( Less than), >= (greater than or equal to), <= (less than or equal to), != (not equal to), a complete logic can be: >=5 AND <=10, for string fields, the available logic contains contains ( contains), not contains (does not contain), = (string is equal), != (string is not equal), a complete logical contains A AND != B.
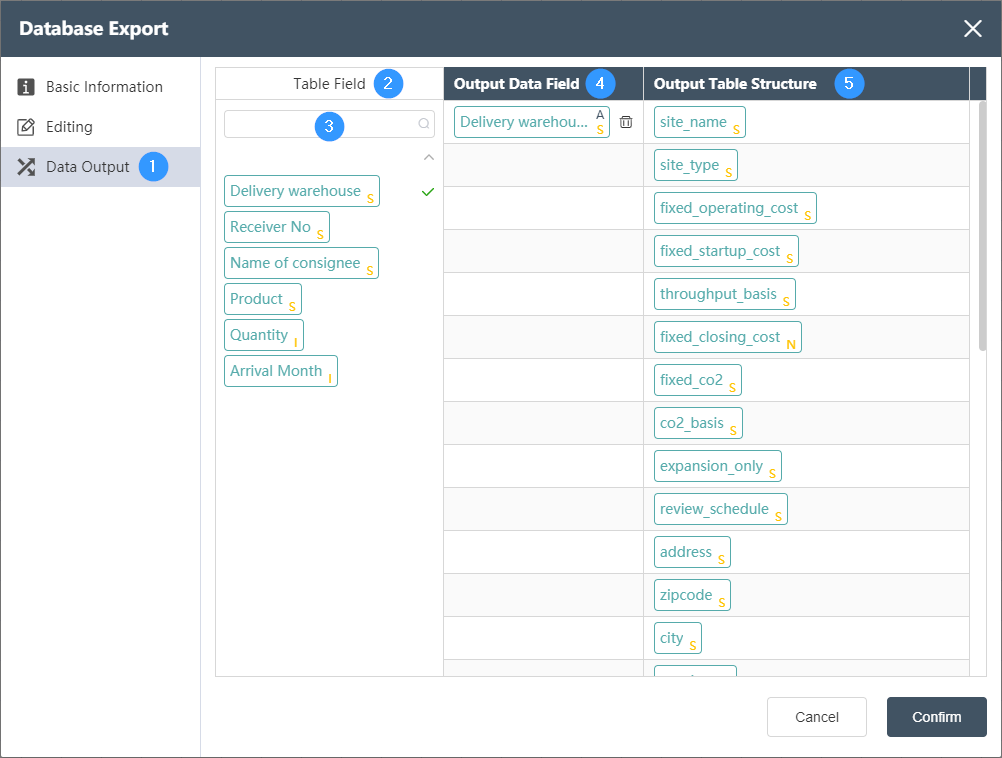
Data Output Tab
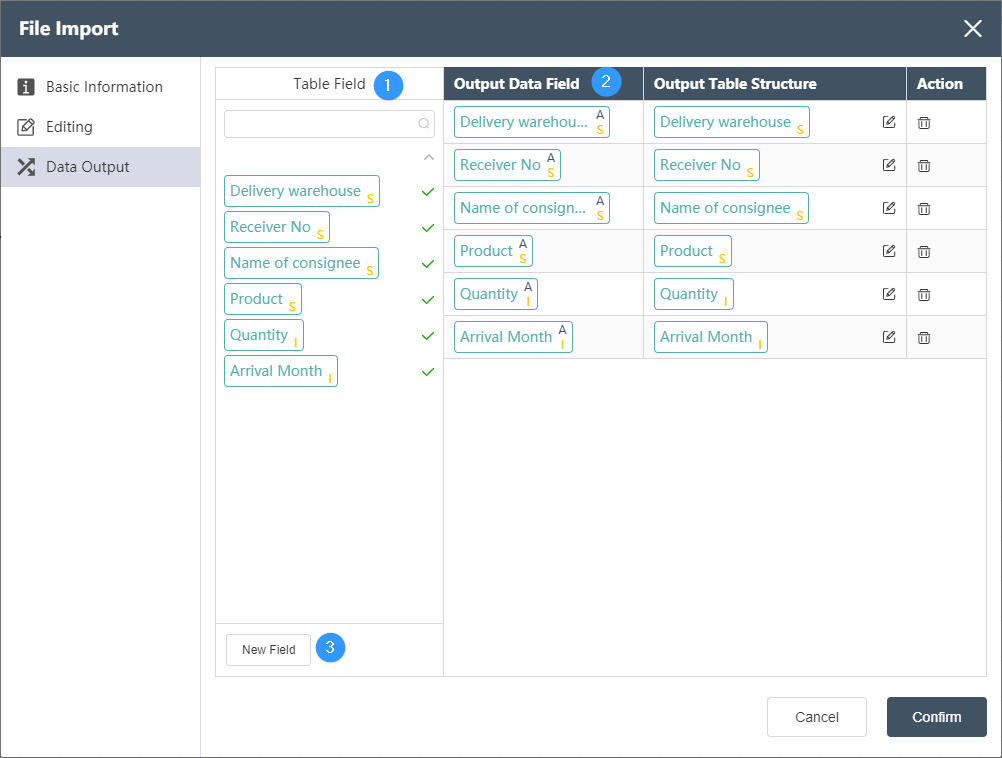
①Table fields: List all fields in the input table of the current node. The check mark on the right shows which fields have been selected as output fields. The search box of petition can search for existing fields.
②Output editing area: Adjust the corresponding relationship between the output data field on the left and the output table structure on the right, you can directly drag and drop fields from the table field to the right side and automatically generate. The output data field types can be the following, and the related settings are described as follows:
STRING (string), INTEGER (integer), NUMERIC (number), FLOAT (float), BOOLEAN (boolean), DATE (date), TIME (time). When the data type of the output data field and the output table structure are not the same, the forced data type conversion will be performed, so the change of data precision or the loss of information may occur. Please make sure that the type conversion can be executed correctly. For example converting a FLOAT field to an INTEGER field will round and lose digits after the decimal point.
By selecting and dragging the rows of the output editing area up and down, you can sort the fields of the output table, which will determine the order of the fields in the output table.
Click the delete button in the operation to delete the current field.
③ Click New Field to create a new empty field. At this time, you can set a default value for this field in the output table, that is, all data rows of the new field will be replaced with the default value.
# File Export
# Node Function

This node is used to export data stored in csv or txt file format, and the exported data can be stored in a local path.
Basic Information Tab
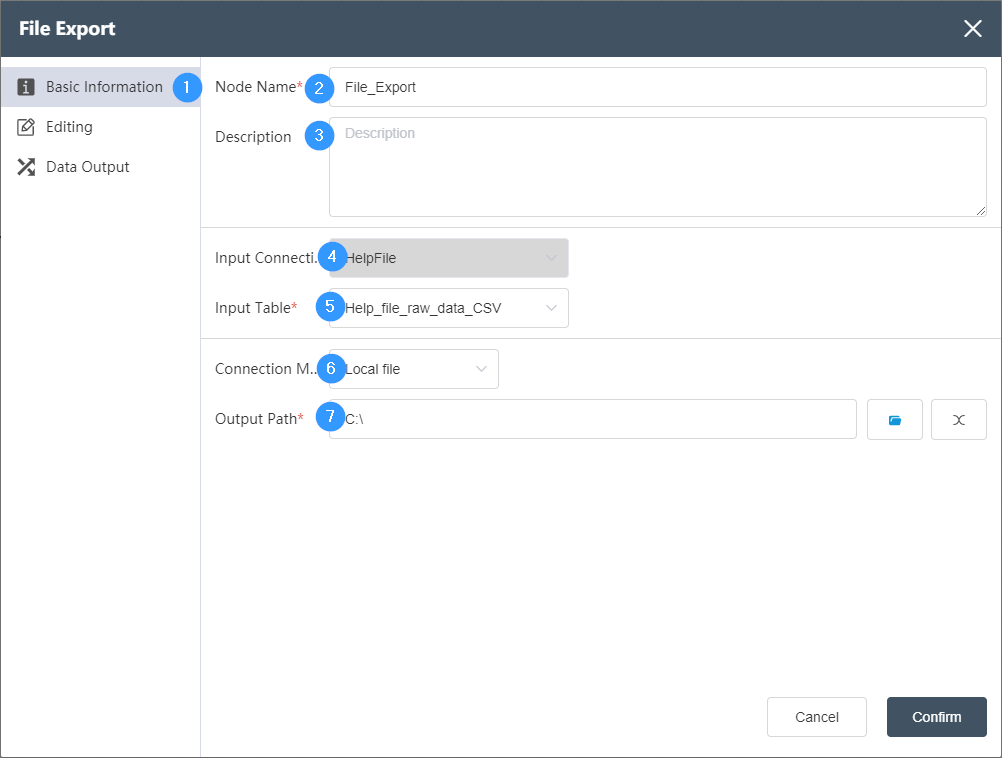
①Basic Information Tab: select this item to edit the basic information of the node
②Node name: Display the name of the node on the canvas.
③Node description: The custom description of the node function, displayed when the node information button is clicked on the canvas.
④ Input connection: Determine the data source of the node, and select the data source of the database connection node in the same node group.
⑤ Input table: Determine the table to be exported.
⑥Connection mode: Local file is selected by default, and FTP file can also be selected.
⑦Output path: the path where the file is stored.
Data Editing Tab
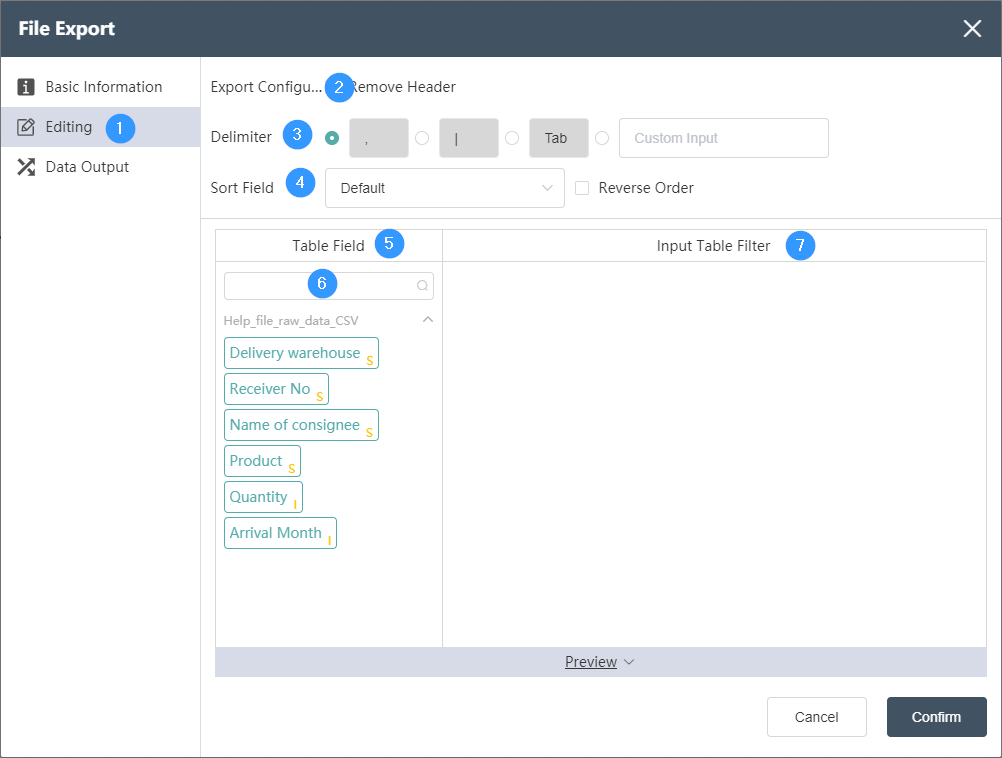
①Data editing: You can edit the conditions of data checking and the results of editing the output table on this interface.
②Export configuration: You can choose whether to remove the header.
③Delimiter: Select the delimiter of the exported file data, the default is ",", or you can customize the delimiter. .
④Sort field: You can sort and export according to a certain field, or in positive order/reverse order when exporting.
⑤Table field: After editing the data, you can see the defined table field and field type in the data output tab.
⑥Table field search: quickly locate the fields in the selected data table and select them
⑦ Input table filtering: You can flexibly use functions to filter and judge the input table.
Data Output Tab
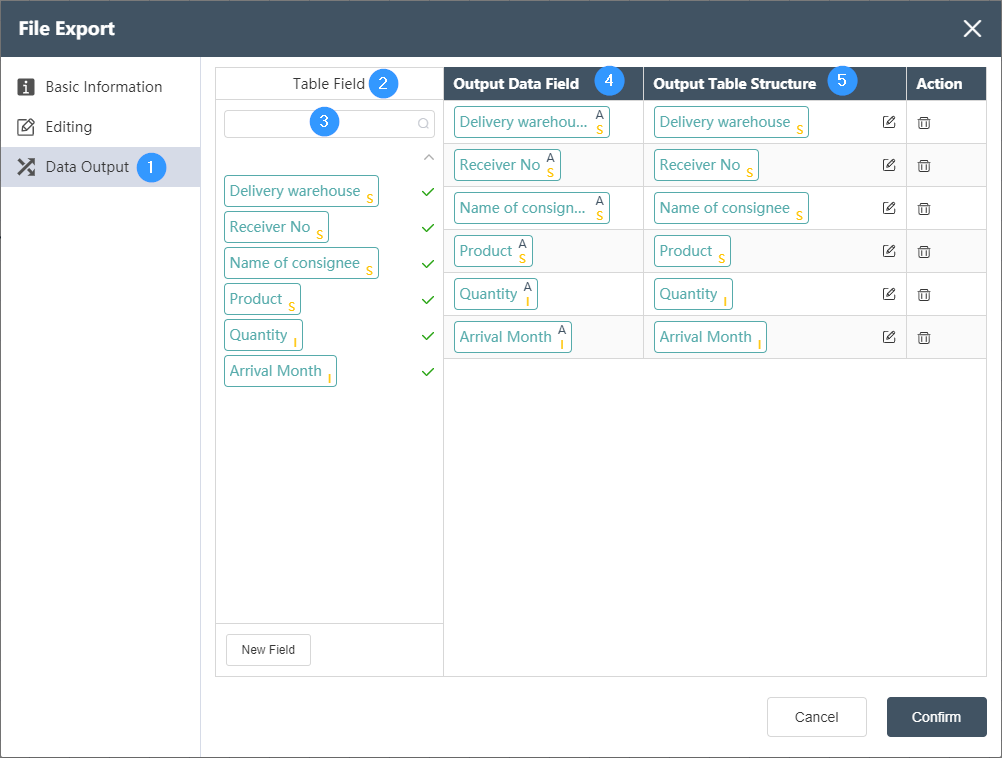
①Data output: After data editing, you can see the defined table fields and field types in the data output tab.
②Table field: After editing the data, you can see the defined table field and field type in the data output tab.
③Table field search: quickly locate the fields in the selected data table and select them
④ Output data field: Display the column name and data type of the data in the source data table.
⑤ Output table structure: Display the column name and data type of the data in the merged data.
# Excel Single-Sheet Import

# Node Function
This node is used to import Excel table data stored in a tab (Sheet), and the imported data can be stored in a new table in the DASTRO database.
Basic Information Tab
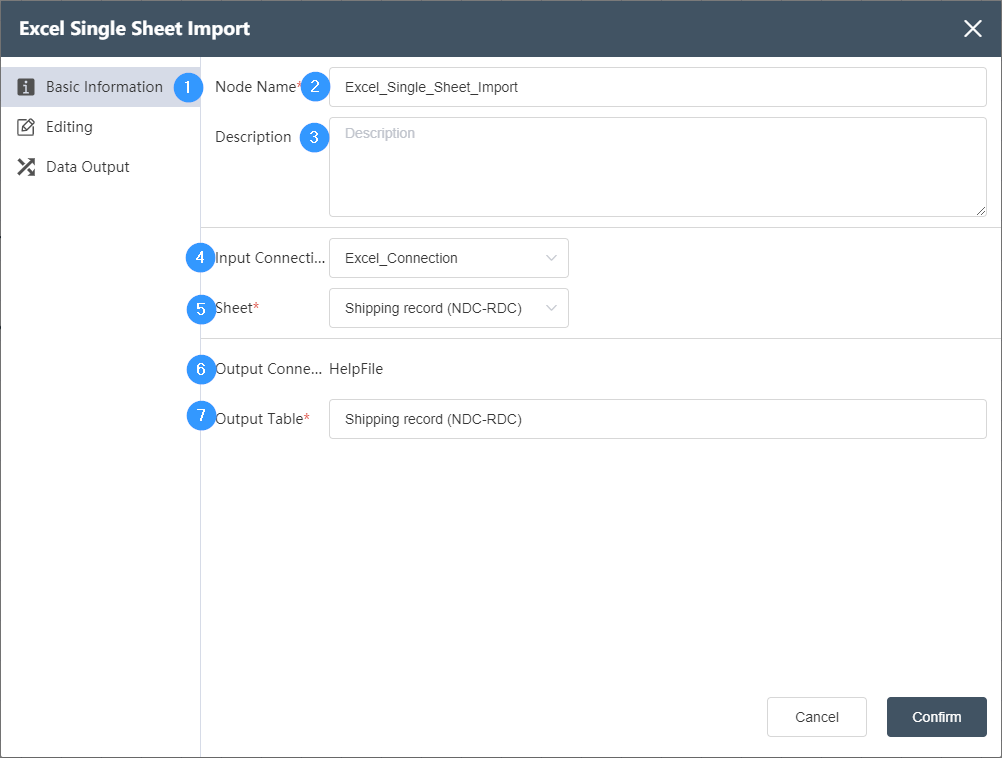
①Basic information: used to determine the basic information such as the name, description, input and output of the node.
②Node name: displayed on the canvas to mark the name of the node
③Node description: The custom description of the node function, displayed when the node information button is clicked on the canvas  .
.
Excel connection node in the same node group .
⑤Sheet: Determine which Excel sheet in the data source to select
⑥Output connection: not selectable, default is the temporary database of the current node.
⑦Table name: The table name of the data output, the default value is the same as the input sheet name. It can be a new table, but it cannot be an existing table in the current database. When the table already exists, it will prompt "Duplicate table name".
Data Editing Tab
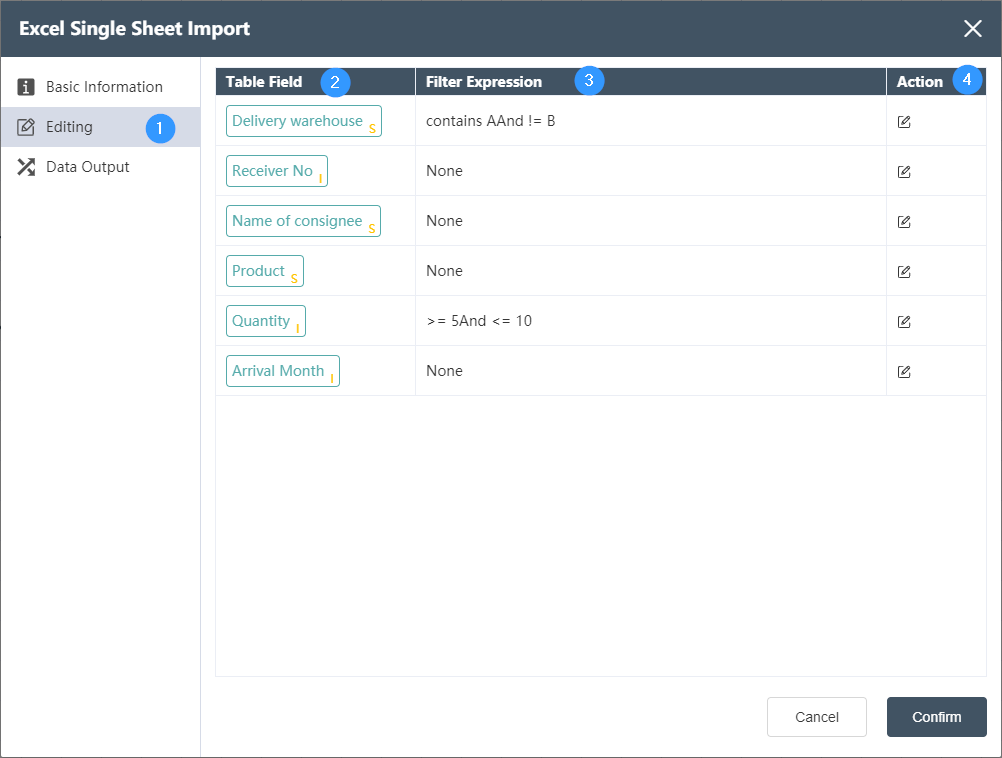
①Data editing: Data filtering can be performed on each field of the input table determined in the basic information.
②Table Field: Automatically list all table fields in the input table, the letter in the lower right corner indicates the type of the field, I (Integer) integer, S (String) string, F (Float) decimal.
③Filter expression: used to display the logic determined in the operation
④Operation: Determine the filter for this field. Two logics can be connected by AND (and) and OR (or). For integer and decimal type fields, the optional logics are = (equal to), > (greater than), < ( Less than), >= (greater than or equal to), <= (less than or equal to), != (not equal to), a complete logic can be: >=5 AND <=10, as shown in the following figure:

For string fields, the available logic includes contains (contains), not contains (does not contain), = (string equals), != (string is not equal to), a complete logic contains A AND != B, as shown below shown:

Data Output Tab
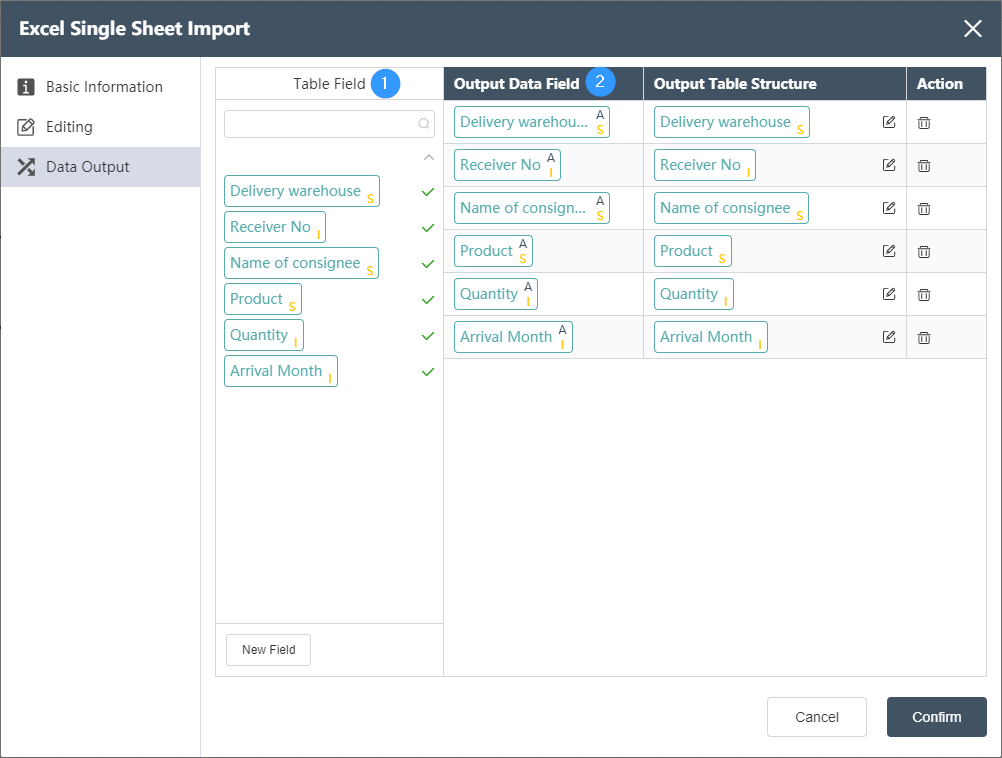
①Table fields: List all fields in the input table of the current node. The check mark on the right shows which fields have been selected as output fields. The search box of petition can search for existing fields.
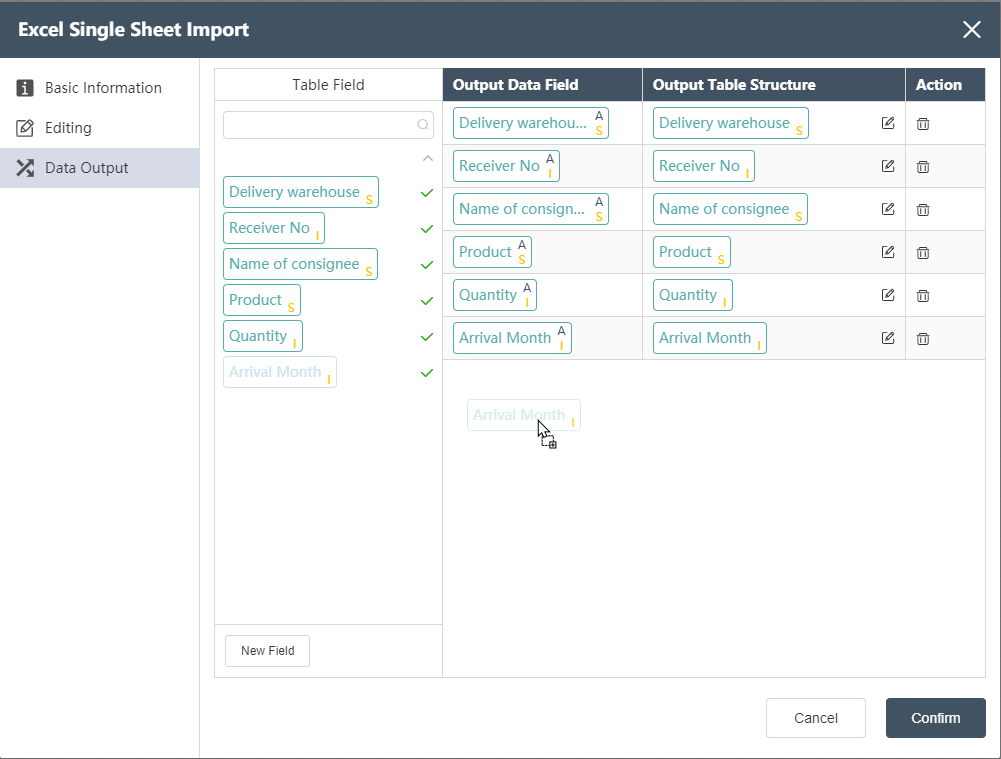
②Output editing area: Adjust the corresponding relationship between the output data field on the left and the output table structure on the right, you can directly drag the field from the table field to the right side and automatically generate it, as shown in the following figure:
Output data field, where superscript A refers to the input table in the current node, and the following table indicates the field type.
output the table structure, you can click the Edit button  to specify the field name (note that the field names in the same table cannot be repeated), type, and type-related settings. The types can be the following, and the relevant settings are described as follows:
- STRING (string), a string that expresses 'factory', the field length can be a positive integer value, such as 55.
- INTEGER (integer), expressing an integer value such as 102, no setting items
- NUMERIC (number), which can express integers and decimals, and can set the reserved digits for the integer part and the decimal part. The default is 28 digits for integers and 2 digits for decimals.
- FLOAT (floating point number), expressing a decimal value such as 50.1, no setting items
- BOOLEAN (Boolean value), can only be FALSE (false), TRUE (true) two values, no setting items.
- DATE (date), expressing a date value such as 2022-08-16, no setting items
- TIME (time), expressing the time value such as 18:30:59, there is no setting item
When the data type of the output data field and the output table structure are not the same, the forced data type conversion will be performed, so the change of data precision or the loss of information may occur. Please make sure that the type conversion can be executed correctly. For example converting a FLOAT field to an INTEGER field will round and lose digits after the decimal point.
By selecting and dragging the rows of the output editing area up and down, you can sort the fields of the output table, which will determine the order of the fields in the output table.
Click the delete button in the operation to  delete the current field.
③ Click New Field to create a new empty field. At this time, you can set the default value for this field in the output table, that is, all the data rows of the new field will be replaced with the default value, as shown in the following figure.

# Excel Multi-Sheet Import

# Node Function
This node is used to import Excel table data stored in multiple tabs (Sheets). The data in multiple data tables can be merged or imported into separate data tables.
Basic Information Tab
①Node name
The name displayed on the canvas to label this node.
②Node description
A custom description of the node's function, displayed when the node info button is clicked on the canvas .
③Input connection
Excel connection node in the same node group .
④Output connection
Not selectable, defaults to Dastro's staging database for the current node group.
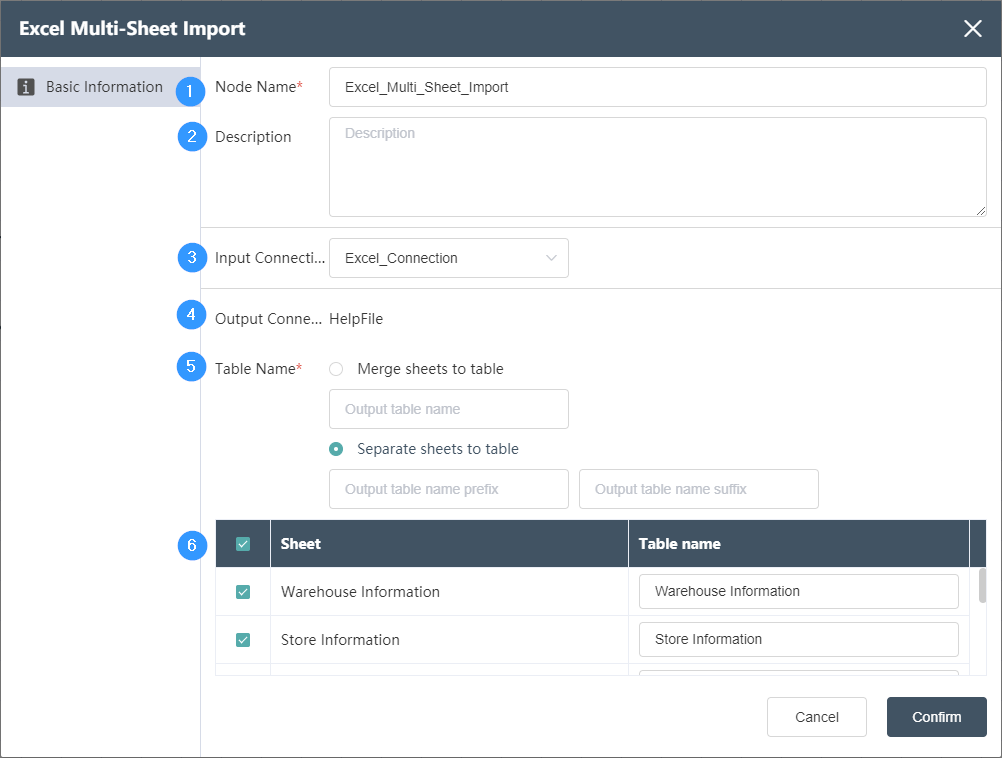
⑤Table name
Select the table name of the current import data output to the database
- Select "Merge Sheets and Import into One Table", then the contents of multiple sheets will be merged into one data. This option should be selected only when the data in multiple sheets have exactly the same fields and data structures. The table name entered here is the imported table name after the data is merged.
- If you select "Import by sheet", the data in multiple sheets will be imported into different tables, and the input prefix and suffix will be appended before and after the original sheet name. If the prefix is Input , the suffix is example, and the original sheet name is "factory data", the table name for saving data is Input factory data example.
⑥Data table selection area
- Select the sheet to be imported in the check area on the left, and only the selected sheet data will be imported.
- The Sheet column displays the data entered into the Excel sheet, and the sheet name is the output sheet name after adding the prefix and suffix, which is the same as the Sheet name by default.
# Excel Export

# Node Function
This node is used to export the data in the Dastro database to a single Sheet (tab) in the Excel file. The target Excel table can be located locally or on an FTP server . The data can be filtered for row-level operations, and the data table can be customized. Structure.
Basic Information Tab
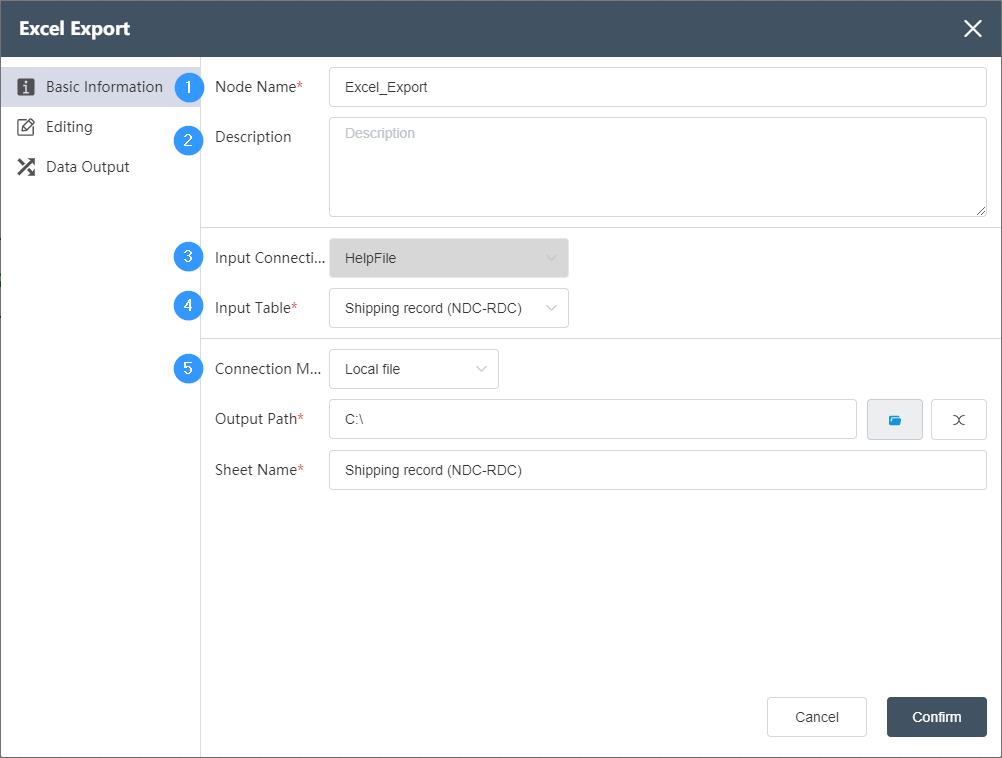
①Node name
The name displayed on the canvas to label this node.
②Node description
A custom description of the node's function, displayed when the node info button is clicked on the canvas .
③Input connection
To determine the source of node data, you can select other data in the same node group to import the data that has been imported in the node. It should be noted that the import node needs to be successfully run at least once before the actual data table can be generated, and there are corresponding options in the drop-down box. .
④Input form
Select a data table in the data source of the input connection
⑤Connection mode
Optional local file, FTP file
- When selecting a local file in connection mode: you need to specify the specific path of the output file and the sheet name of Excel
output path
You can use the file open button on the right to  select the file path on the current computer. When the file name already exists, the saved file will be automatically renamed to the original file name (1), and so on.
Sheet name: used to determine the sheet name output in Excel.
- When selecting an FTP file as the connection mode: you need to determine the FTP server to connect to, the path of the FTP output file, and the sheet name.

Select FTP Server: Select the FTP server that has been set in Dastro's current workflow. For details, please refer to FTP Server Settings .
output path
Specify the output path of the FTP file, be careful not to have a slash '/' at the front of the path, and the path needs to end with an Excel file.
Sheet name
Used to determine the sheet name output in Excel.
Data Editing Tab
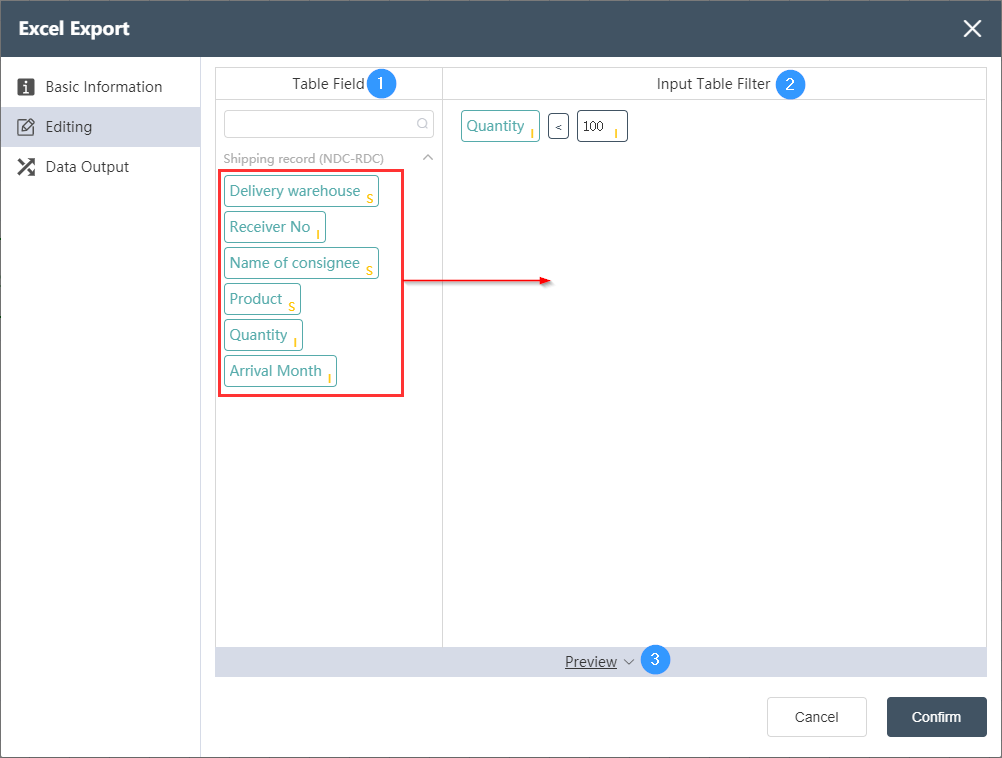
①Table field
Displays all fields in the currently selected input table, you can use the search box to search, and these fields can be used to write the input table filter conditions on the right.
②Input table filter
Use a visual editing method to write a SQL filter condition, which can be directly dragged into the input table field on the left (as shown by the red arrow). For the list of logical operators and functions that can be used, please refer to the corresponding logical operators and functions chapters.
- Example: The filter of the input table in the picture is: warehousing cost < 100, of which 100 is automatically recognized as an integer value after input. You can force the data type to be changed by clicking the data type character in the lower right corner. For more information about the data type , please refer to the data type
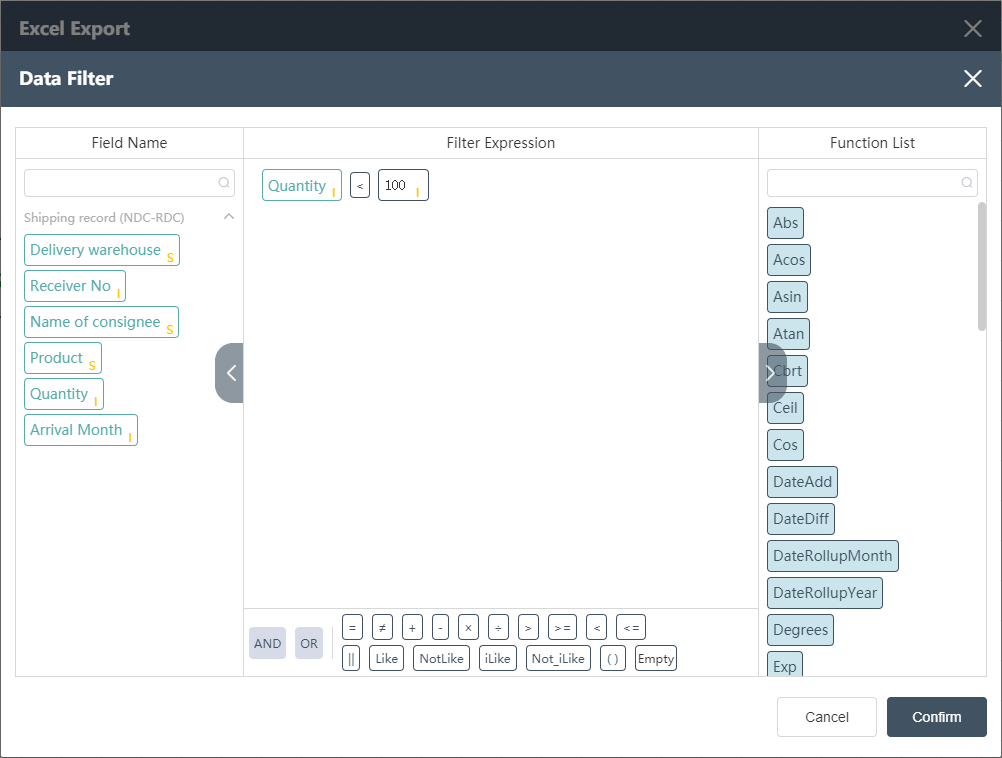
The shortcut operation bar on the right can be used for copying  , pasting
  , and deleting
  operations, as well as enlarging the editing area
  to display a complete list of operators and functions, as shown in the figure below.
preview
Display the output data and corresponding SQL statements under the current filter conditions, as shown in the following figure
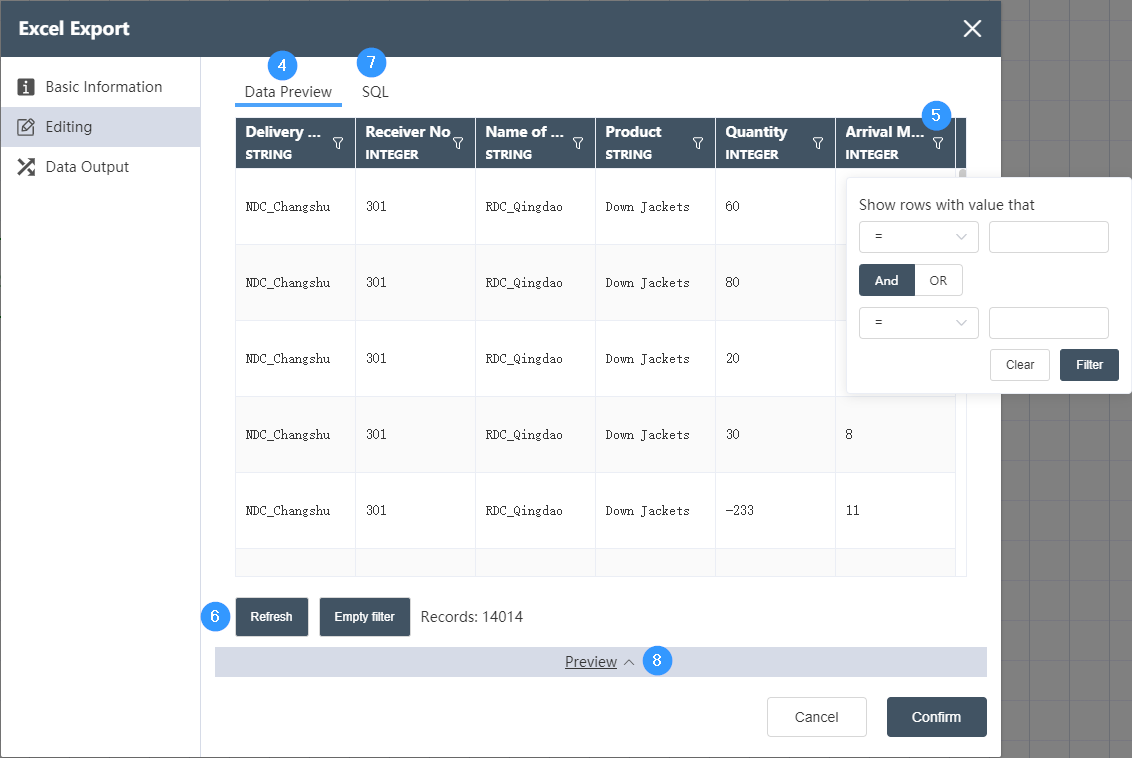
Data Preview Tab
Display the output table data under the current filter conditions
preview table, you can click the filter icon  to filter each column. For the specific filter function, please refer to the table filter chapter. The filter icon of the column to which the filter condition is applied will turn golden
  to indicate that a filter condition has been applied to this column.
Form action buttons
Refresh refreshes the current table data. Clear Filter will clear all filters in the current table.
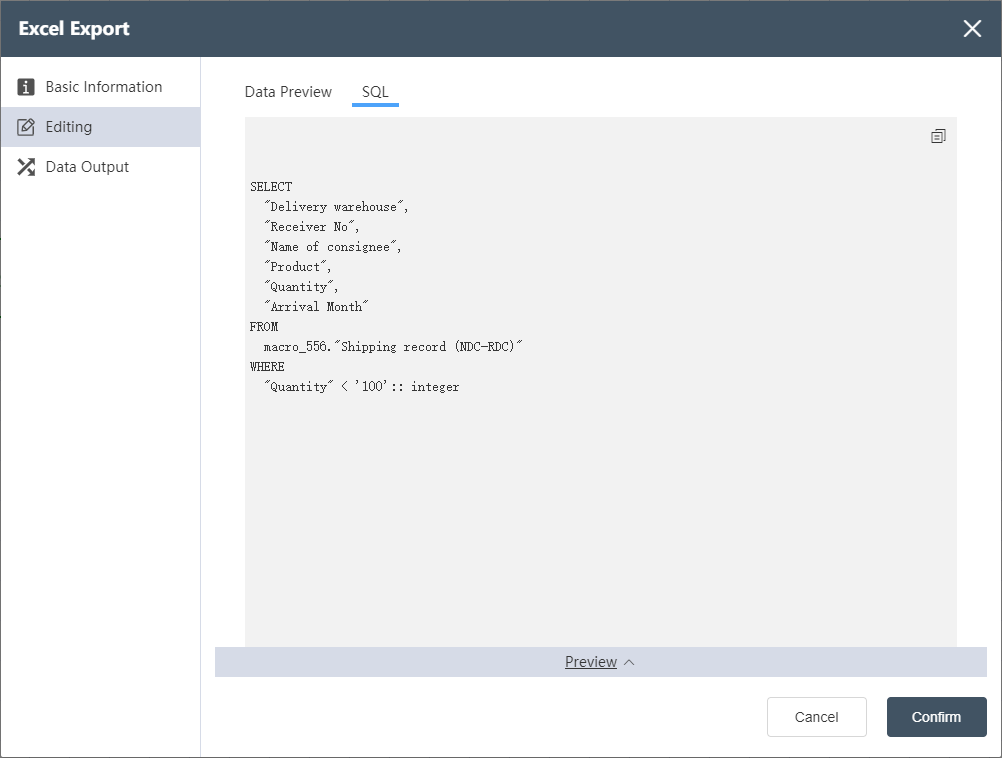
SQL Tab
Click the SQL button to switch to the SQL tab page, and display the corresponding SQL statements of the filter conditions that have been configured in the data editing (note: the additional column filter conditions in the preview are not included), the SQL statement here is only used to check the filter conditions and confirm that no modification can be made. The copy icon in the upper right corner  can copy the entire SQL.
Example: The simple filter condition in the example, the storage cost < 100 (integer value), can be expressed as the following statement in SQL, as shown in the figure
SELECT
"Delivery warehouse",
"Receiver No",
"Name of consignee",
"Product",
"Quantity",
"Arrival Month"
FROM
macro_556."Shipping record (NDC-RDC)"
WHERE
"Quantity" <'100'::integer
Data Output Tab
It is used to adjust the mapping relationship between the output field and the input table of the Dastro local database. You can create and sort fields, and set default values for each field.
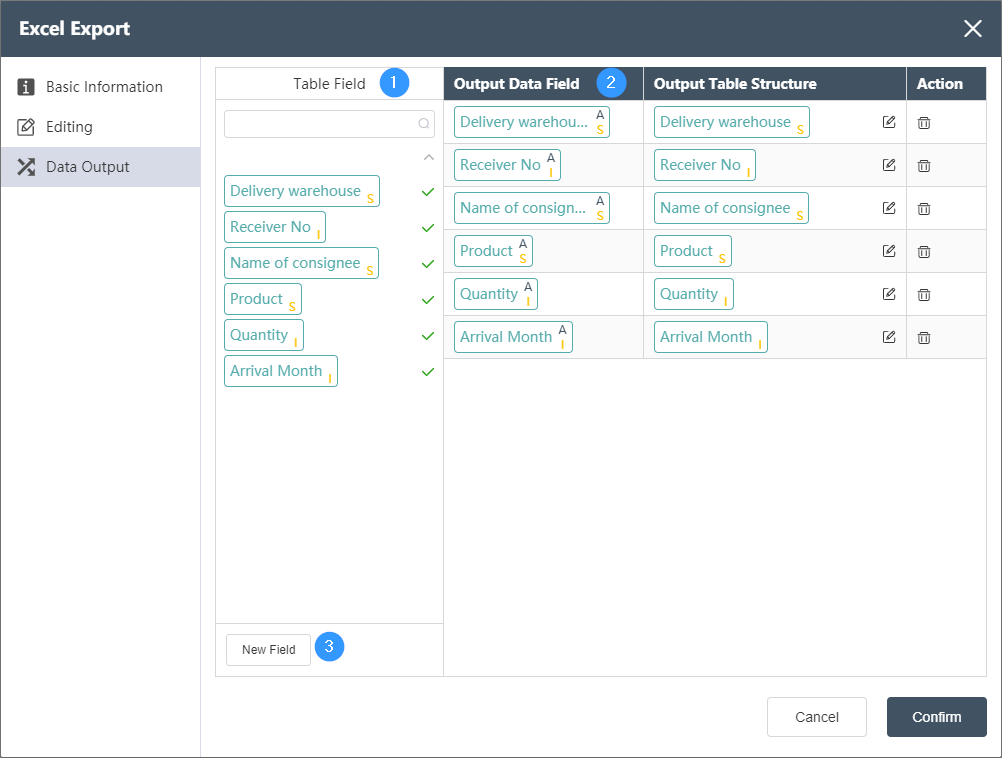
- Table Fields: List all fields in the input table of the current node. The check mark on the right shows which fields have been selected as output fields. The search box above can search for existing fields.
- Output editing area: To adjust the correspondence between the output data fields on the left and the output table structures on the right, you can directly drag and drop fields from the table fields to the right side and automatically generate them.
- The output data field, where the superscript A refers to the input table in the current node, and the subscript indicates the field type.
- output the table structure, you can click the Edit button to specify the name of the field (note that the field names in the same table cannot be repeated), type, and type-related settings, where the type can be the following, and the related settings refer to the data type of the output table . When the data type of the output data field and the output table structure are not the same, the forced data type conversion will be performed, so the change of data precision or the loss of information may occur. Please make sure that the type conversion can be executed correctly. For example converting a FLOAT field to an INTEGER field will round and lose digits after the decimal point. By selecting and dragging the rows of the output editing area up and down, you can sort the fields of the output table, which will determine the order of the fields in the output table. Click the delete button in the operation to delete the current field. A default value can be set for each field, that is, the data row output by all fields will be replaced with the default value.
- New field: You can create a new empty field, and you can set a default value for the field in the output table, that is, all data rows of the new field will be replaced with the default value.
# Excel Multi-Sheet Export

# Node Function
This node is used to export the data in the Dastro database to multiple Sheets (tabs) in an Excel file. The target Excel sheet can be located locally or on an FTP server.
Basic Information Tab
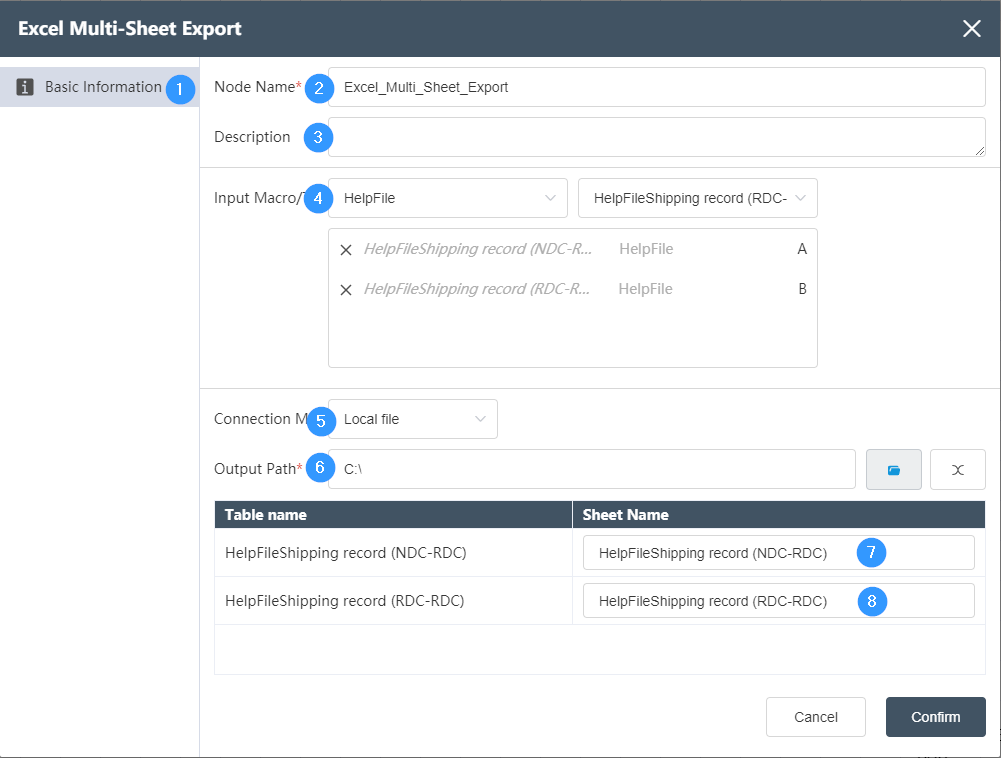
Basic Information Tab
②Node name: Display the name of the node on the canvas.
③Node description: The custom description of the node function, displayed when the node information button is clicked on the canvas.
④Input data: You can choose the data source of the database connection node in the same node group, you can choose single or multiple
⑤Connection mode: Local file is selected by default, and FTP file can also be selected.
⑥Output path: the path where the file is stored.
⑦Sheet table name: The default is the name of the data table as the name of the exported data sheet page, which can be edited and modified.
⑧Sheet table name: same as above.
# Database Export

# Node Function
This node is used to import data stored in the database. The data type supports SqlServer, PostgreSQL, MySQL, Local DB, Access, Hive, etc. You need to select the corresponding database type according to the database type to be connected.
Basic Information Tab
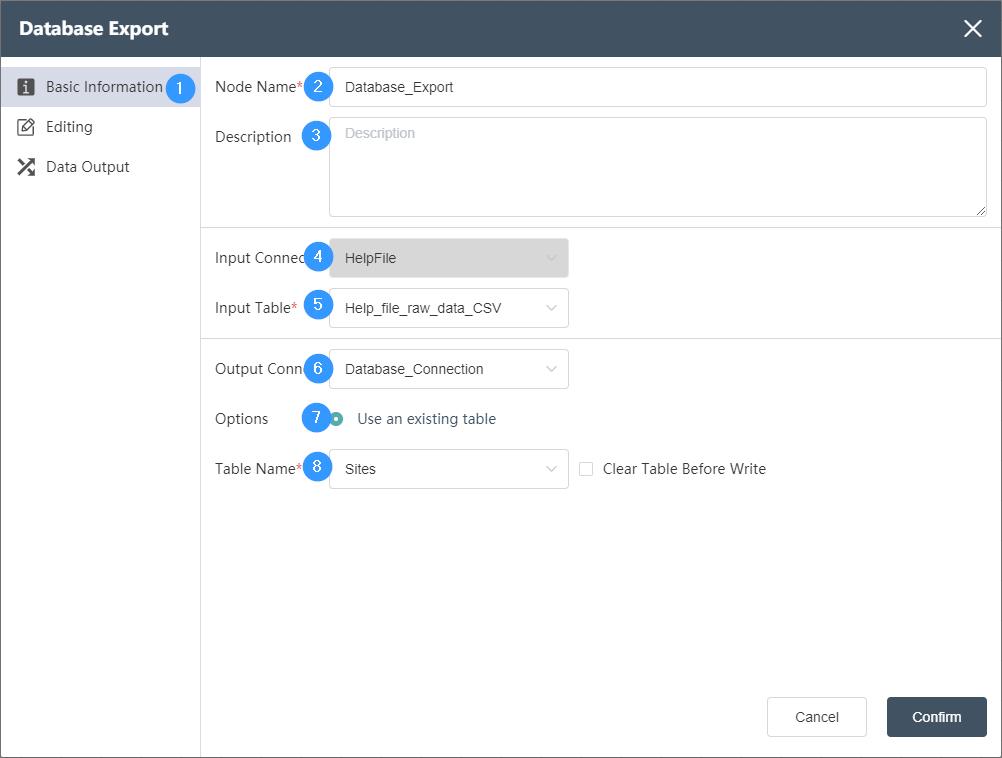
①Basic Information Tab: select this item to edit the basic information of the node
②Node name: Display the name of the node on the canvas.
③Node description: The custom description of the node function, displayed when the node information button is clicked on the canvas.
④ Input data: determine the data source of the node.
⑤Data Editing Tab:
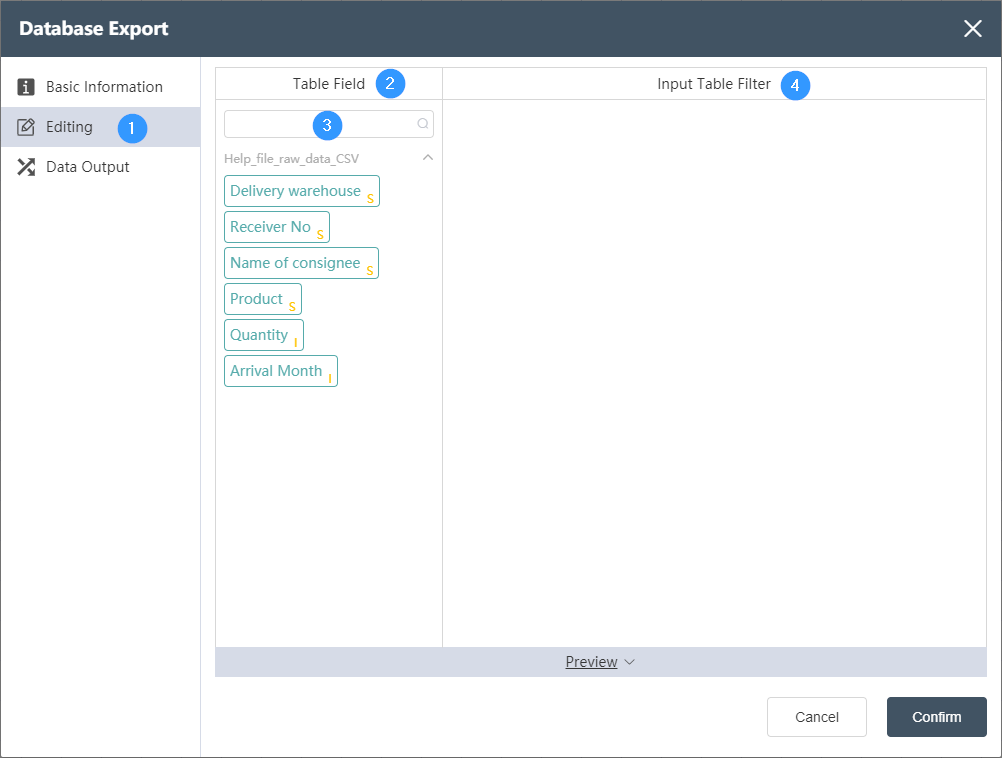
Data Editing Tab
①Data editing: You can edit the data conditions and edit the results of the output table on this interface.
②Table field: After editing the data, you can see the defined table field and field type in the data output tab.
③Search box: You can search for the desired field in the search box, which is suitable for the situation where there are too many table fields and cannot be found immediately.
④ Input table filtering: You can flexibly use functions to filter and judge the input table.
Data Output Tab
Data Output Tab:
①Data output: After data editing, you can see the defined table fields and field types in the data output tab.
②Table field: After editing the data, you can see the defined table field and field type in the data output tab.
③Table field search: quickly locate the fields in the selected data table and select them
④ Output data field: Display the column name and data type of the data in the source data table.
⑤ Output table structure: Display the column name and data type of the data in the merged data.
# Database Import

# Node Function
This node is used to export Dastro data to the database. The data type supports SqlServer, PostgreSQL, MySQL, Local DB, Access, Hive, etc. You need to select the corresponding database type according to the database type to be connected.
Basic Information Tab
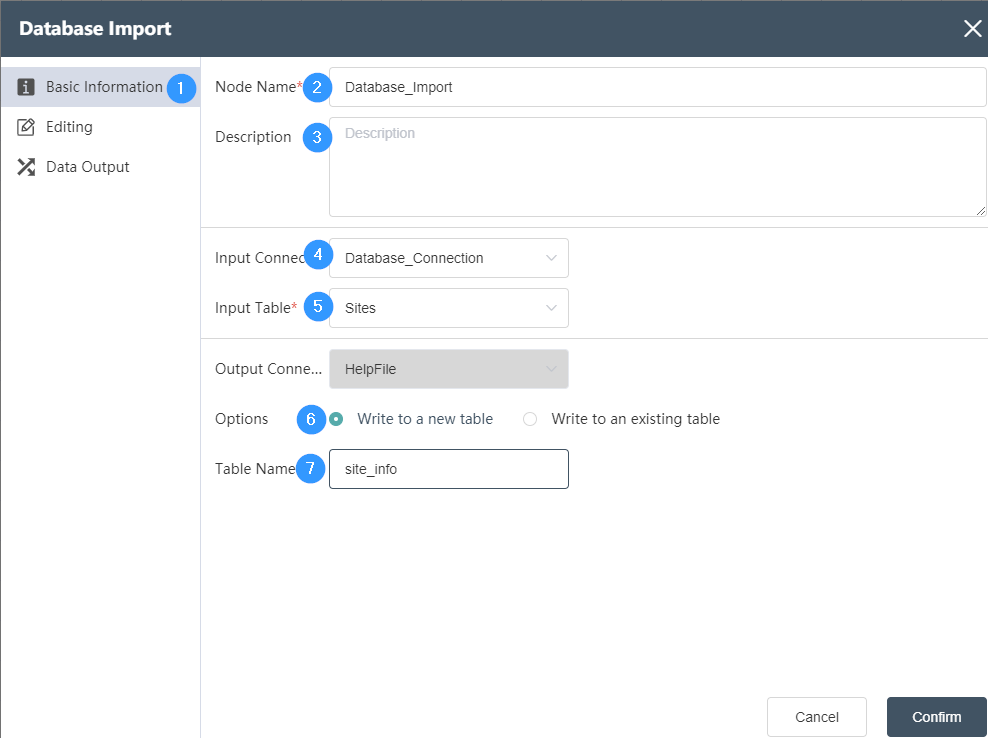
①Basic Information Tab: select this item to edit the basic information of the node
②Node name: Display the name of the node on the canvas.
③Node description: The custom description of the node function, displayed when the node information button is clicked on the canvas.
④ Input connection: Determine the data source of the node, and select the data source of the database connection node in the same node group.
⑤Table name: Determine the corresponding table name contained in the connection database
⑥Write mode: By default, you can choose to write to a new table, or you can choose to write to an existing table.
⑦Table name: The table name of the data output. The default value is the same as the input sheet name. It can be a new table, but it cannot be an existing table in the current database. When the table already exists, it will prompt "Duplicate table name".
Data Editing Tab
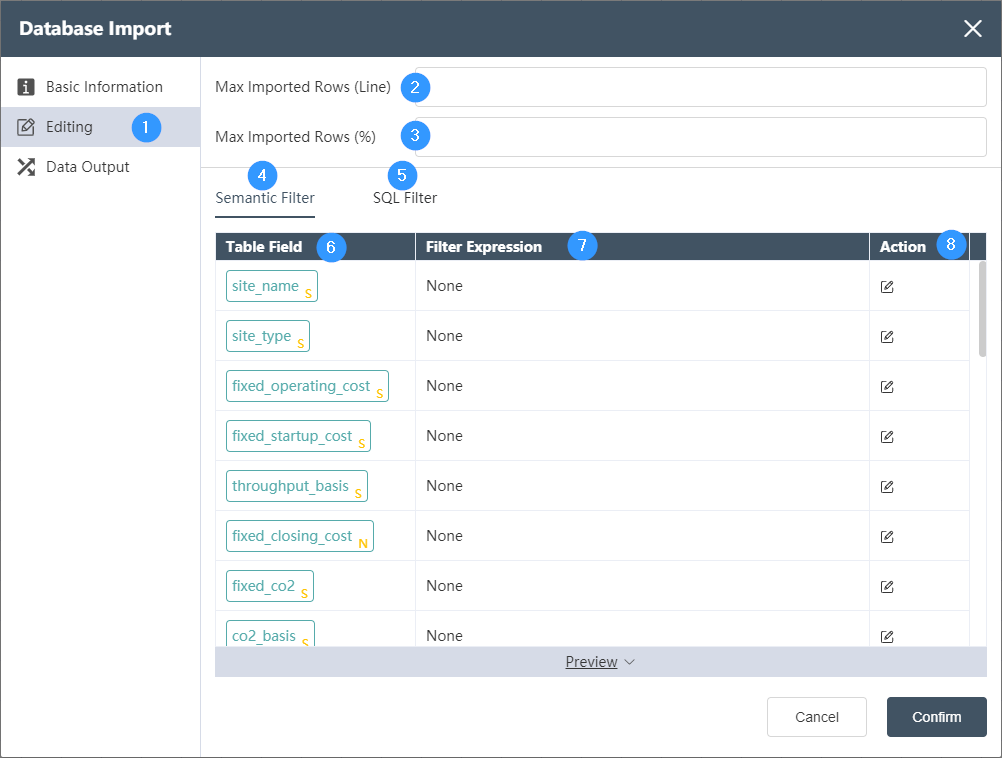
Data Editing Tab:
①Data editing: Data filtering can be performed on each field of the input table determined in the basic information.
②Maximum lines to be written (LINE): Fill in the maximum number of lines that can be read, for example, fill in 100 to read the first 100 lines of data.
③Maximum import lines: You can fill in the total percentage of read data, for example, fill in 50 to read the first 50% of the data.
④Semantic filter: Contains table fields, filter expressions and operations.
⑤SQL filter: not editable, only viewable.
⑥Table Field: Automatically list all table fields in the input table, the letter in the lower right corner indicates the type of the field, I (Integer) integer, S (String) string, F (Float) decimal.
⑦Filter expression: used to display the logic determined in the operation
⑧ Operation: 
Determine the filtering of the field. Two logics can be connected by AND (and) and OR (or). For integer and decimal type fields, the optional logics are = (equal to), > (greater than), < ( Less than), >= (greater than or equal to), <= (less than or equal to), != (not equal to), a complete logic can be: >=5 AND <=10, for string fields, the available logic contains contains ( contains), not contains (does not contain), = (string is equal), != (string is not equal), a complete logical contains A AND != B.
Data Output Tab
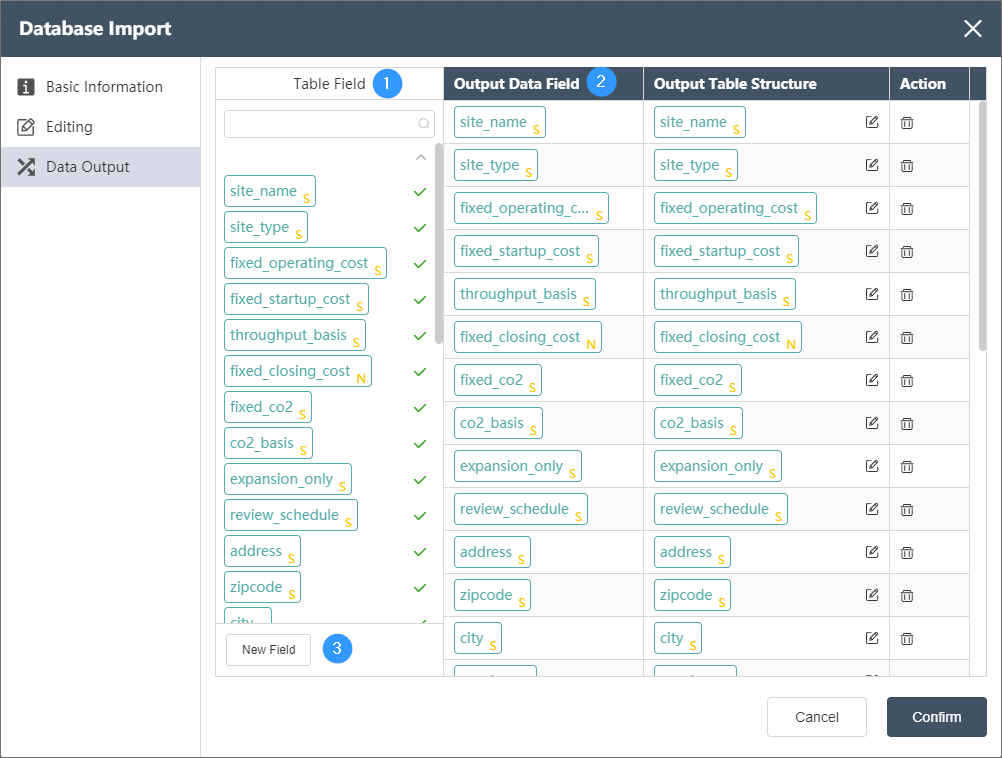
Data Output Tab:
①Table fields: List all fields in the input table of the current node. The check mark on the right shows which fields have been selected as output fields. The search box of petition can search for existing fields.
②Output editing area: Adjust the corresponding relationship between the output data field on the left and the output table structure on the right, you can directly drag and drop fields from the table field to the right side and automatically generate. The output data field types can be the following, and the related settings are described as follows:
STRING (string), INTEGER (integer), NUMERIC (number), FLOAT (float), BOOLEAN (boolean), DATE (date), TIME (time). When the data type of the output data field and the output table structure are not the same, the forced data type conversion will be performed, so the change of data precision or the loss of information may occur. Please make sure that the type conversion can be executed correctly. For example converting a FLOAT field to an INTEGER field will round and lose digits after the decimal point.
By selecting and dragging the rows of the output editing area up and down, you can sort the fields of the output table, which will determine the order of the fields in the output table.
Click the delete button in the operation to delete the current field.
③ Click New Field to create a new empty field. At this time, you can set a default value for this field in the output table, that is, all data rows of the new field will be replaced with the default value.
# Data Preparation Node
# Create Table

# Node Function
This node is used to create a new table stored in the Dastro platform.
Basic Information Tab
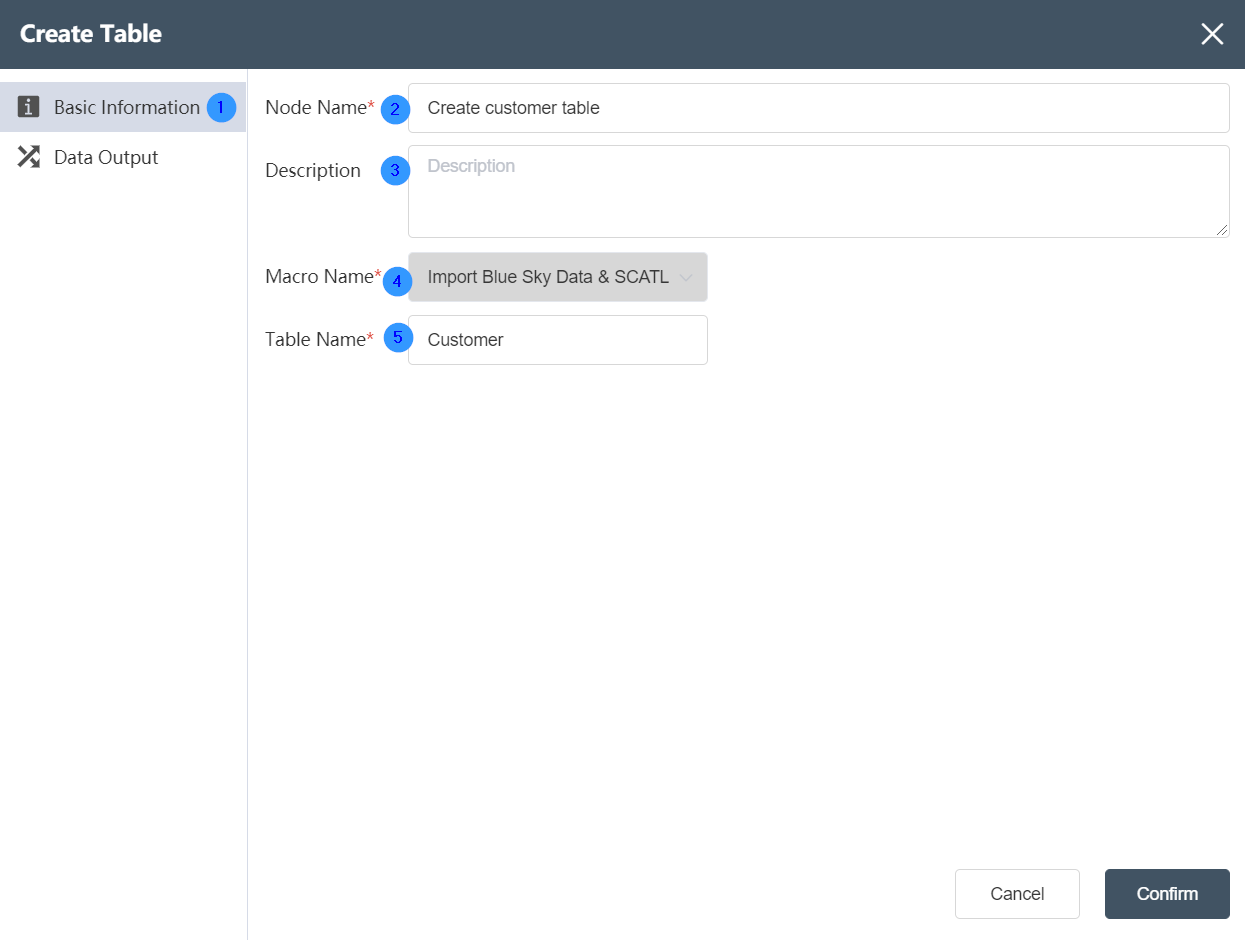
②Node name: Display the name of the node on the canvas.
③Node description: The custom description of the node function, displayed when the node information button is clicked on the canvas.
④Output: The current node is selected by default as the storage location of the new table.
⑤Table Name: Name the newly created table, which can be customized.
Data Output Tab
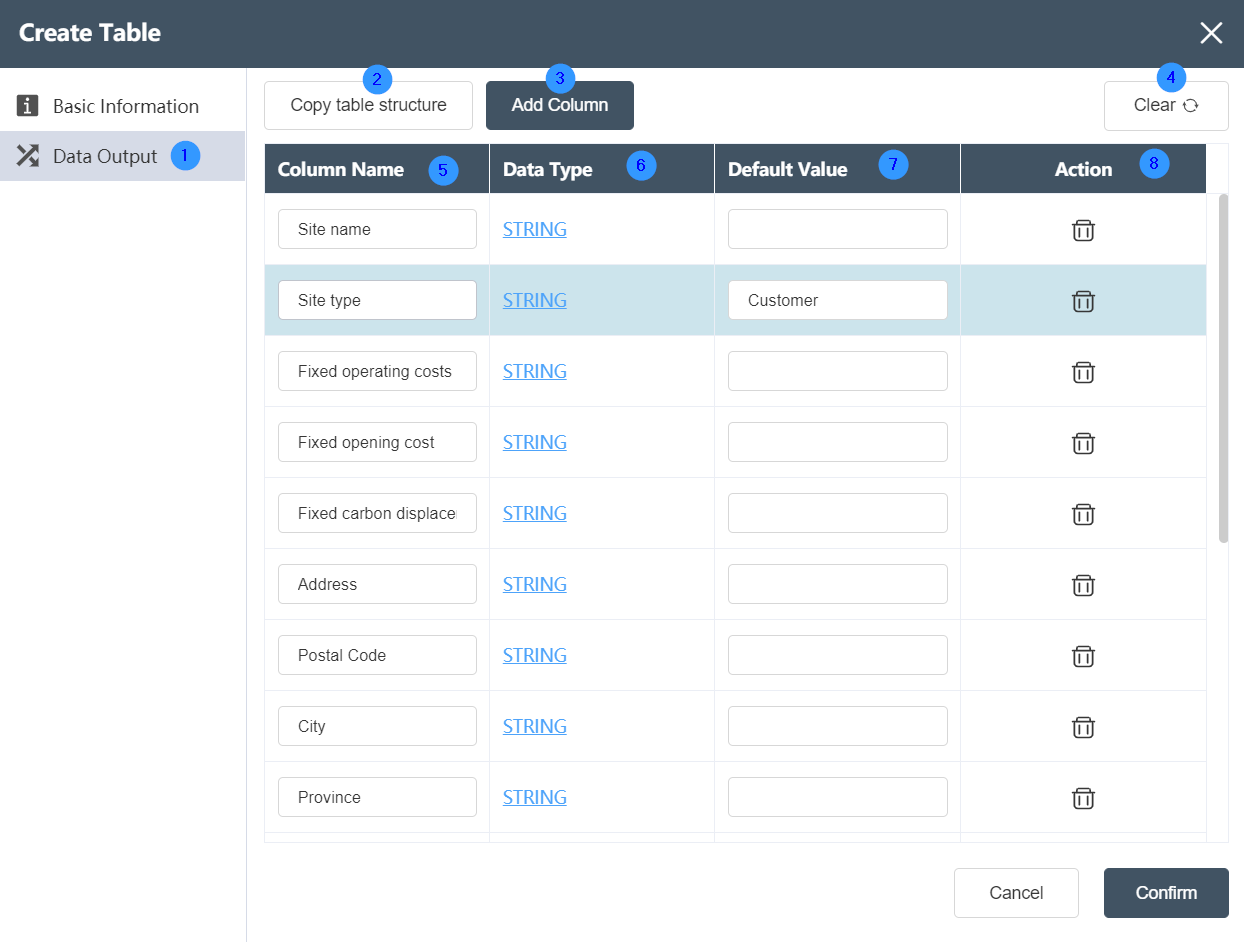
①Data output: You can edit and define the data type and column name of the new table on this page.
②Copy table structure: Click Copy table structure to select an imported data table in a connected database, and realize the copying of column names and data types, but the data in the table will not be copied.

③Add field: Customize the name and data type of the new field.
④Clear: You can clear the format of the defined new table with one click.
⑤Column name: If you add a new field, you can see the edited field here. If you copy the table, you can see the column name of the copied table here, and the column name can be modified arbitrarily.
⑥Data type: If you add a new field, you can see the data type of the edited field here. If you copy a table, you can see the data type of the copied table here, and the column name can be modified.
⑦ Default value: You can set the default value of the data in the table.
⑧ Operation: The operation of deleting a column can be realized.
# Delete Table

# Node Function
Deletes the specified table under the current node group, supports the deletion of single or multiple tables.
Basic Information Tab
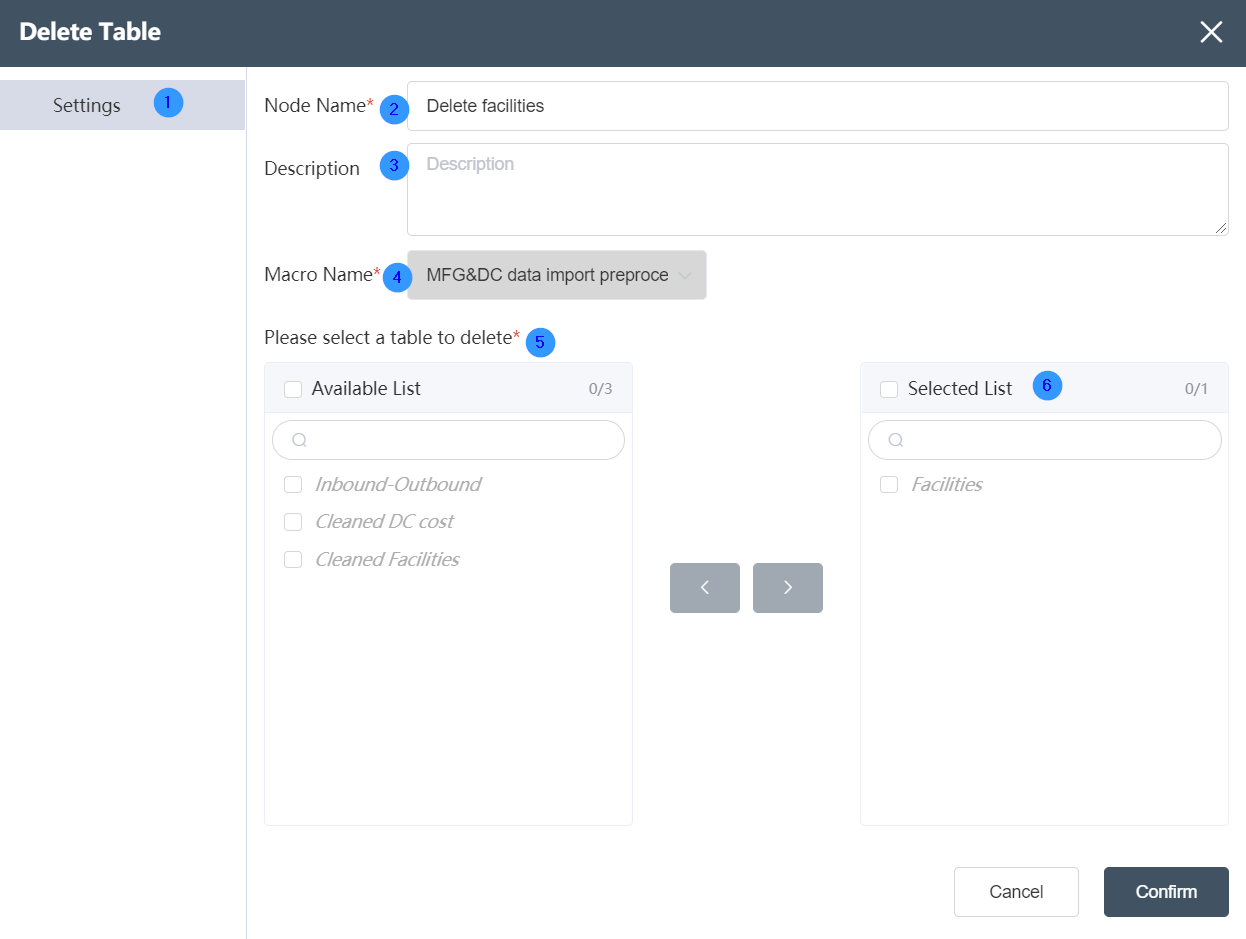
②Node name: Display the name of the node on the canvas.
③Node description: The custom description of the node function, displayed when the node information button is clicked on the canvas.
④Target data: Determine the data source of the node, the target data is the main table, and the data column will be updated on the basis of this table later.
⑤Please select the table to be deleted: it can display all the data tables contained in the current data source, tick in front of "Table List" to select all tables. The numbers on the right show the number of tables selected and the total number of tables.
⑥Deleted table: The deleted table column displays the table to be deleted.
# Delete Field

# Node Function
Deletes the fields of the specified table under the current node group, supports the deletion of single or multiple fields.
Basic Information Tab
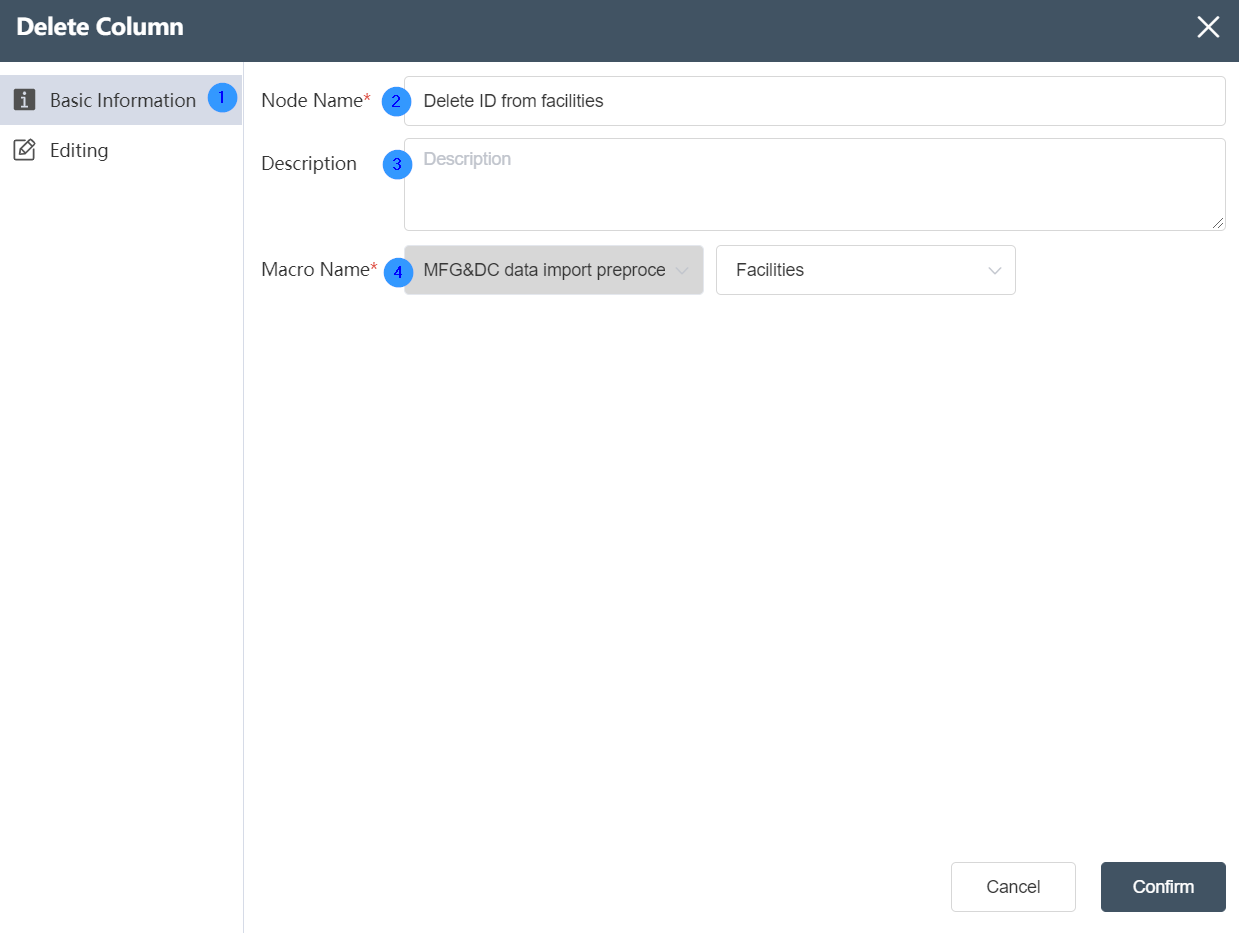 ②Node name: Display the name of the node on the canvas.
③Node description: The custom description of the node function, displayed when the node information button is clicked on the canvas.
④Target data: Determine the data source of the node, the target data is the main table, and the data column will be updated on the basis of this table later.
Data Editing Tab
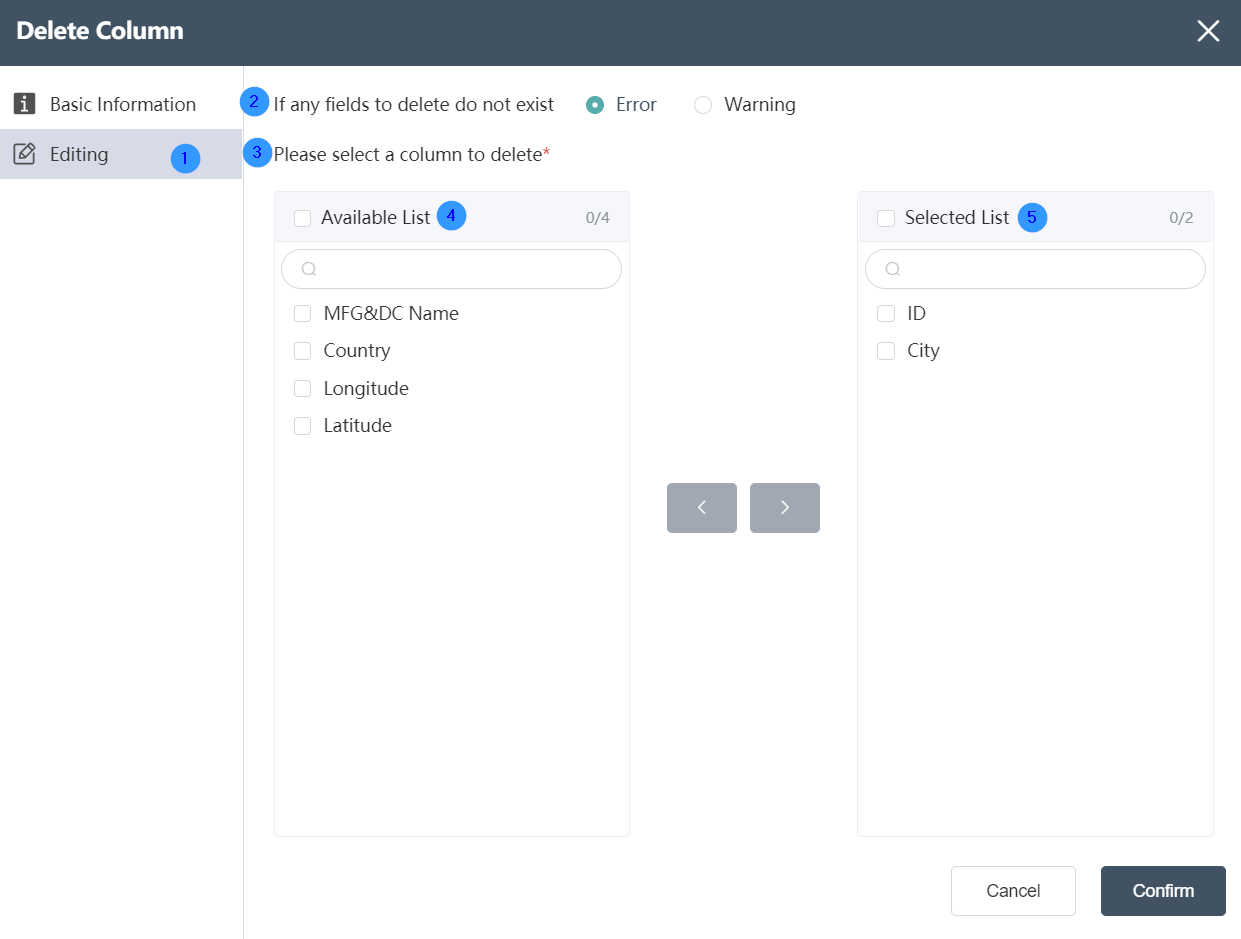
Data Editing Tab
It is possible to edit the fields to be deleted in this interface.
②The field does not exist at the time of execution
If the field has been deleted, or if the field does not exist, there are two node states for the user to choose from: error/warning.
③Please select the delete field
The fields in the selected table are displayed as follows.
④Table field
All data fields contained in the current data source can be displayed, and all fields can be selected by ticking in front of "Table Fields". The numbers on the right show the number of fields selected and the total number of fields.
⑤Delete field
Delete Field Displays the field to delete.
# Delete Row

# Node Function
Delete the data row of the specified table under the current node group, support the deletion logic based on filter conditions or reference table association, and support the preview of the result (deleted and undeleted table display)
Basic Information Tab
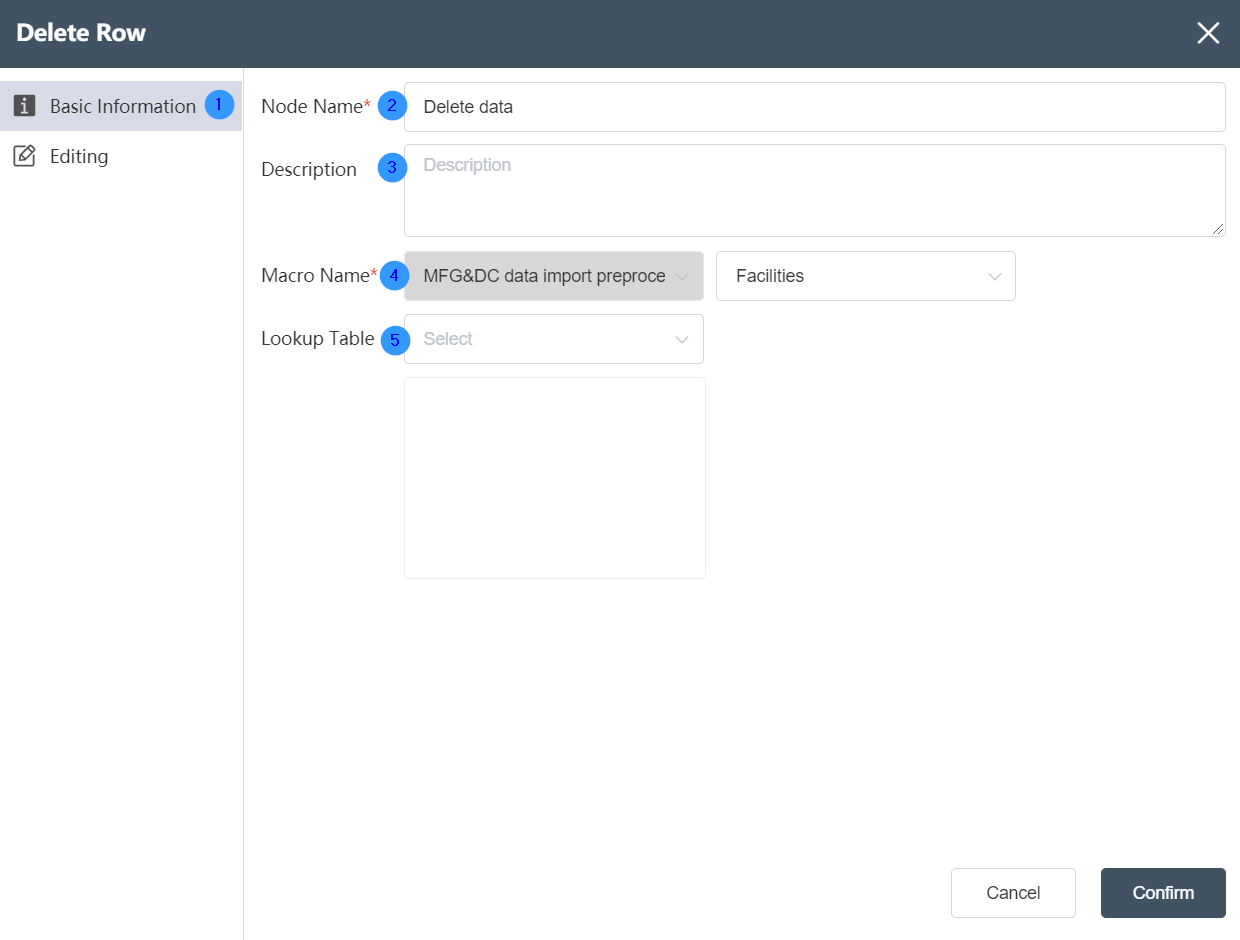
①Basic Information Tab: select this item to edit the basic information of the node
②Node name: Display the name of the node on the canvas.
③Node description: The custom description of the node function, displayed when the node information button is clicked on the canvas.
④Target data: Determine the data source of the node, the target data is the main table, and the data column will be updated on the basis of this table later.
⑤Reference table: The reference table is the table to be associated. After setting the associated data, you can select data update in the reference table.
Data Editing Tab
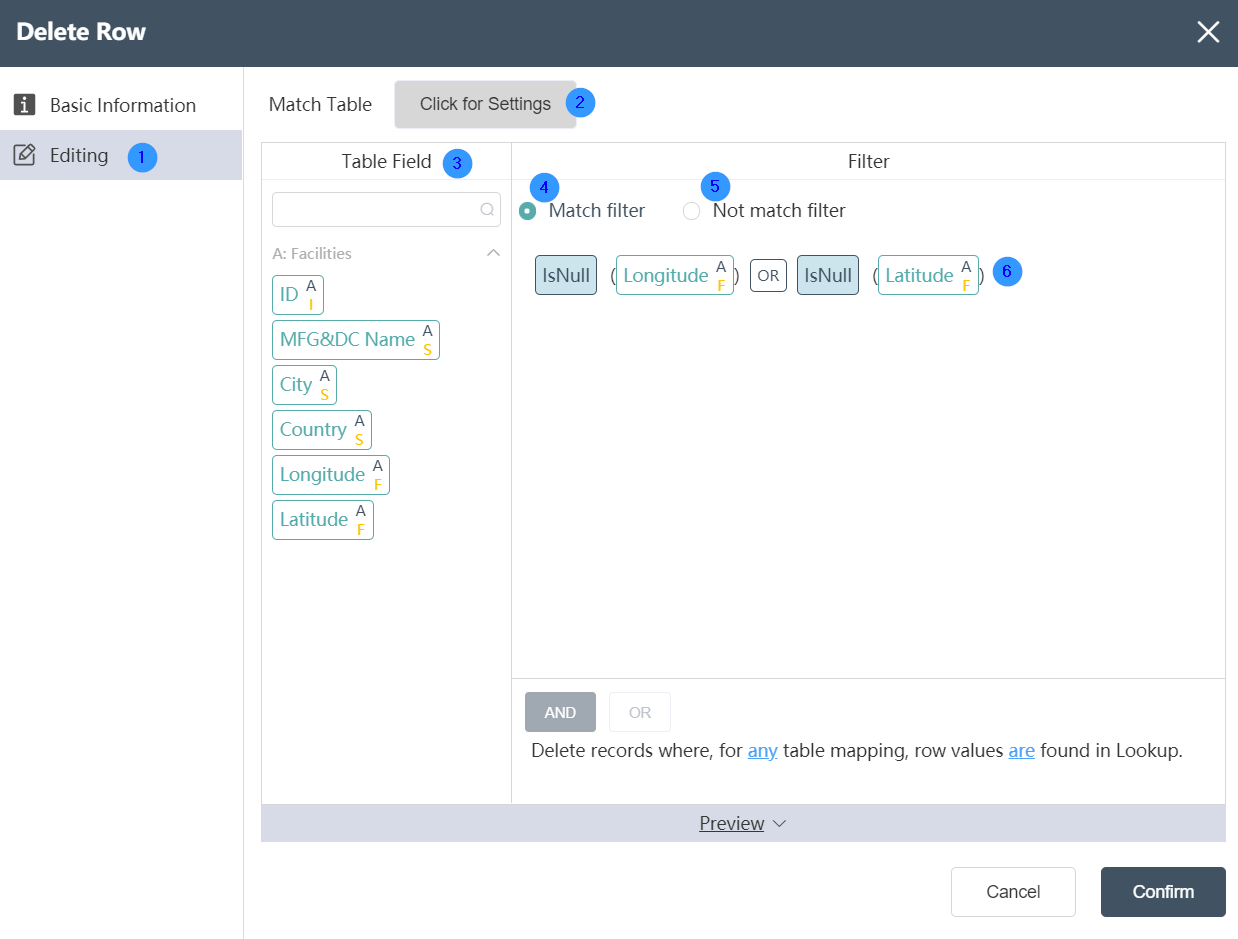
Data Editing Tab:
①Data editing: You can edit the data conditions and edit the results of the output table on this interface.
②Reference table: In the reference table setting, you can select the association relationship and edit the associated key values in the two tables. But you can only select the intersection of the target table and the reference table or take all the rows of the target table. (optional)
③ Input table fields: After editing the data, you can see the defined table fields and types in the data output tab.
④Meet the filter conditions: Select this condition to delete the data rows that meet the following filter conditions.
⑤ Does not meet the filter conditions: Select this condition to delete the data rows that do not meet the following filter conditions.
⑥Filter conditions: You can customize the filter conditions, with a high degree of freedom. Data that meets/does not meet the filter criteria will be deleted.
# Fix Schema

# Node Function
Used to modify the structure of the specified table under the current node group, copy the structure of the target table, and modify the field name and type.
Basic Information Tab
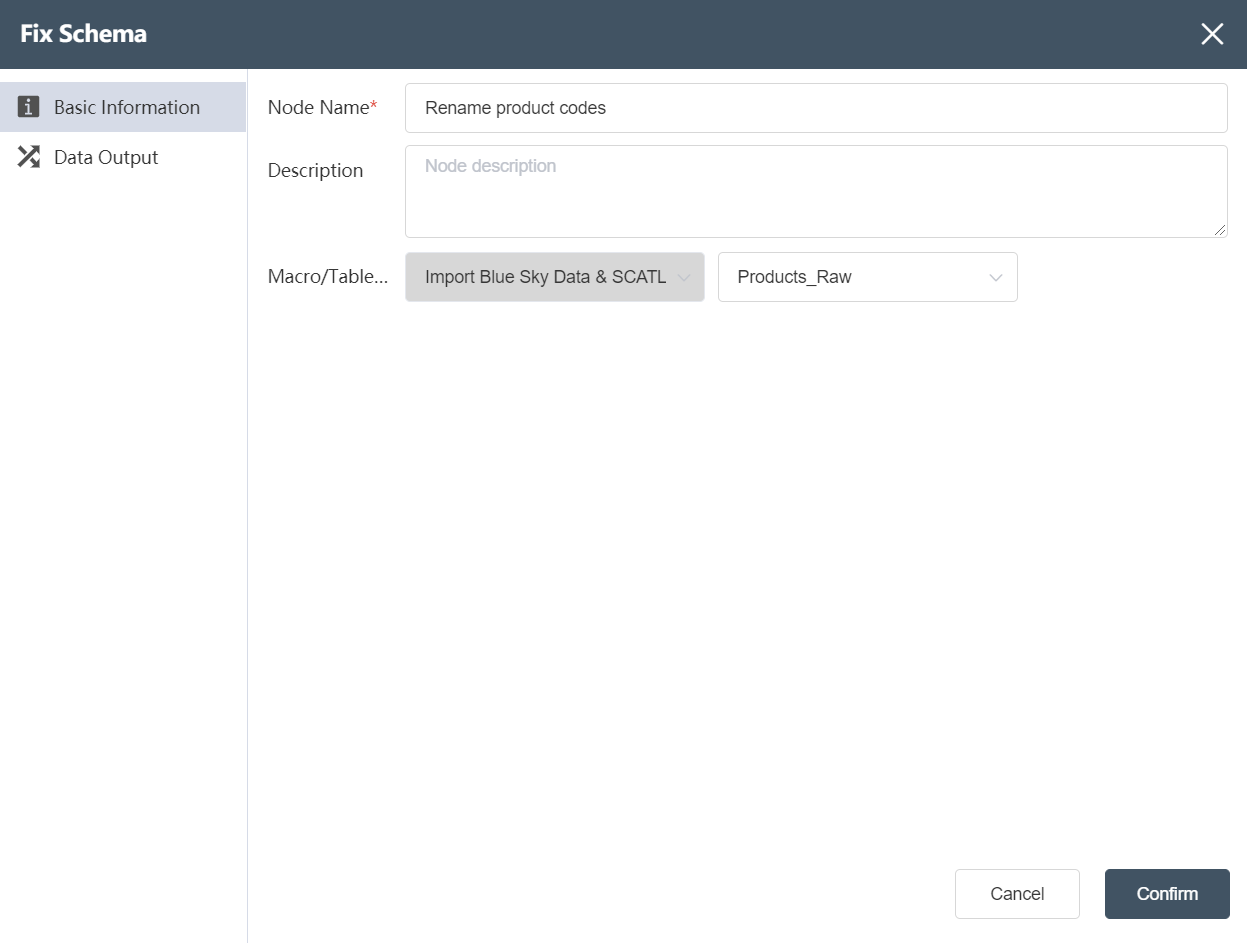 ①Basic Information Tab: select this item to edit the basic information of the node
②Node name: Display the name of the node on the canvas.
③Node description: The custom description of the node function, displayed when the node information button is clicked on the canvas.
④Target data: Determine the data source of the node, the target data is the main table, and the data column will be updated on the basis of this table later.
Data Output Tab
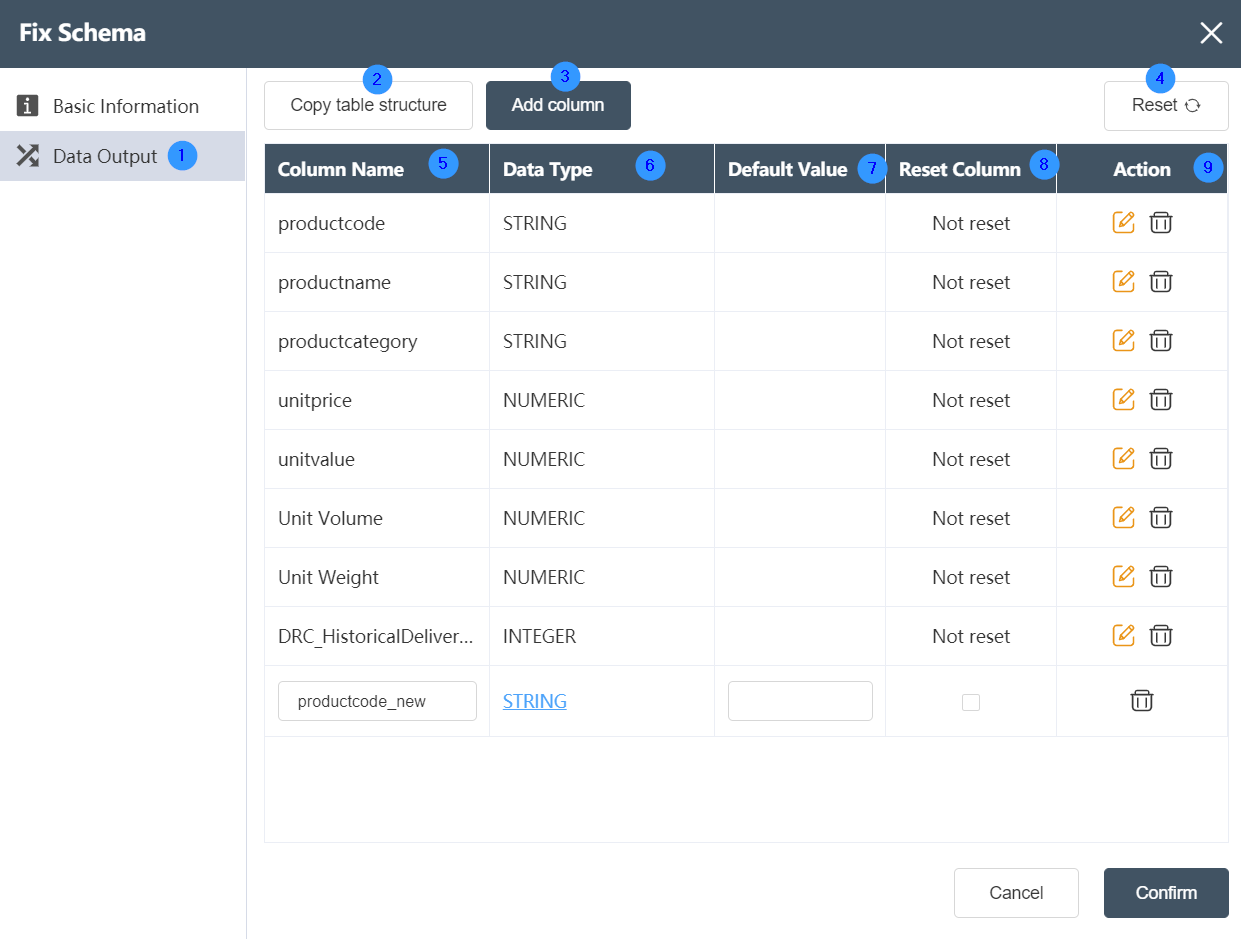
- Data Output Tab: In this interface, you can implement detailed editing of data table modification, such as modifying data types or creating/deleting columns.
- Copy table structure: You can select any data table stored in this node. After copying the table structure, you can add the copied table structure as a new column to this data table.
- New Field: Add fields of any data type.
- Reset: After adding new fields or copying the table structure, and making any modifications to the original table structure, clicking reset will cancel it with one click, and only keep the most original table structure.
- Column Name: Display the existing column names in the table, and the newly added/copied column names will also be displayed here.
- Data Type: Displays the data type corresponding to the column name.
# Pivot Table

# Node Function
It can realize the pivoting function of the original data table.
Basic Information Tab
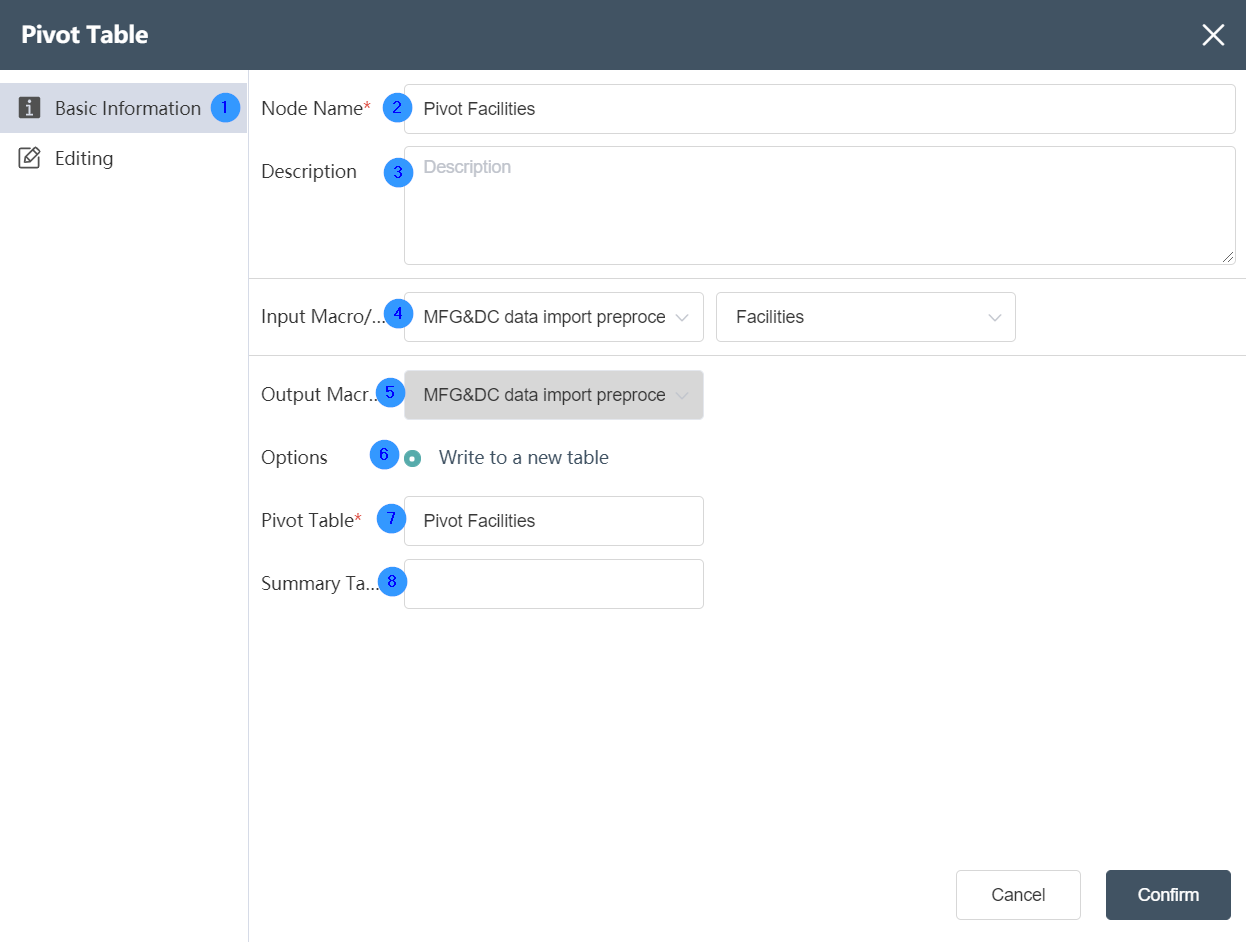
①Basic Information Tab: select this item to edit the basic information of the node
②Node name: Display the name of the node on the canvas.
③Node description: The custom description of the node function, displayed when the node information button is clicked on the canvas.
④ Input data: Determine the data source of the node, and select the data source of the database connection node in the same node group.
⑤ Output data: not selectable, the default is the temporary database of the current node.
⑥Write mode: write new table by default
⑦Pivot table name: The table name of the data output, the default value is the same as the input sheet name, it can be a new table, but it cannot be an existing table in the current database. When the table already exists, it will prompt "Duplicate table name".
⑦Statistical table name:
Data Editing Tab
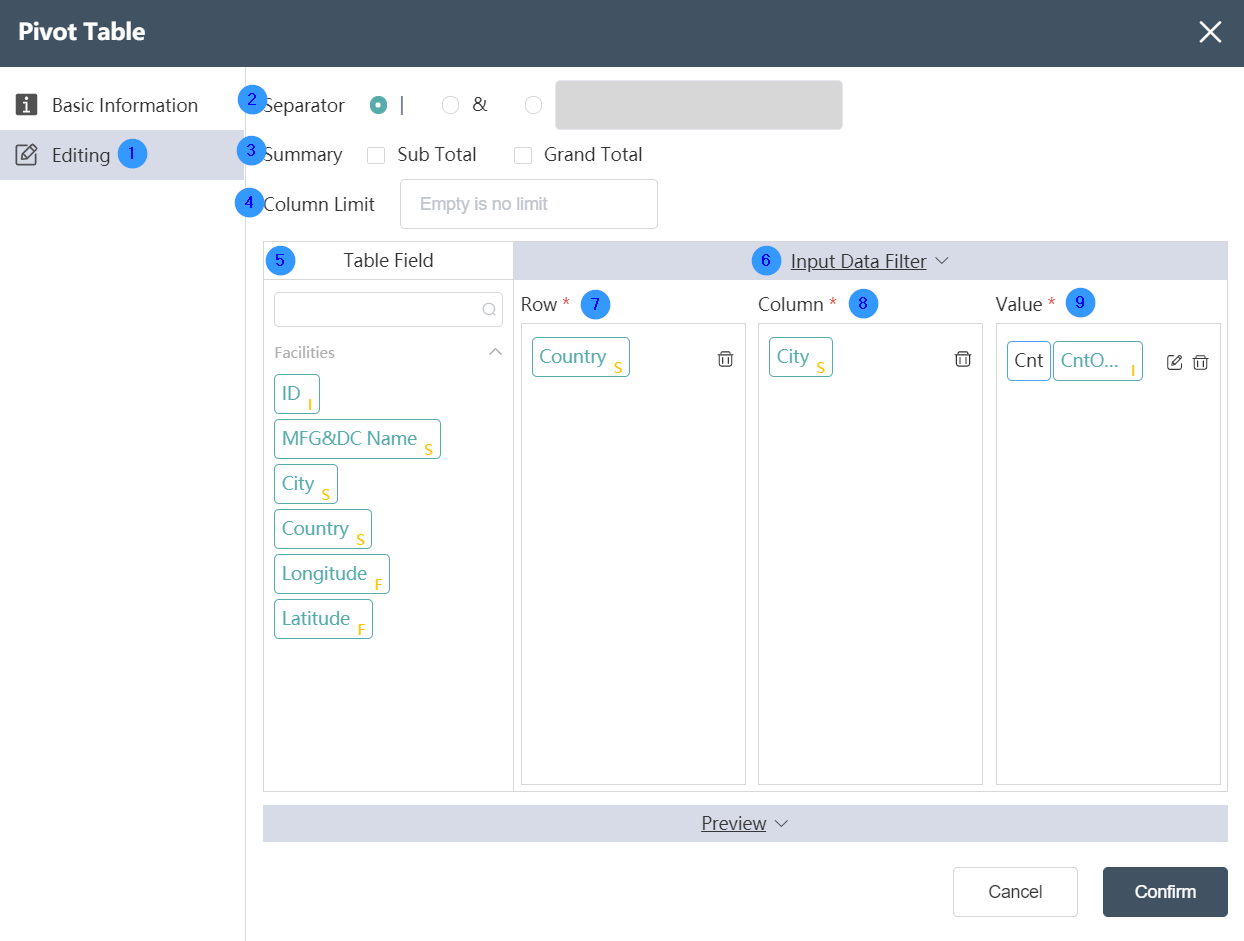
Data Editing Tab:
①Data editing: You can edit the conditions of data checking and the results of editing the output table on this interface.
②Column name separator: the default is "|", optional "&" or custom
③Data Statistics: Select "Subtotal"/"Total"
④The maximum number of columns: the default is empty, then there is no limit
⑤Table field: After data editing, you can see the defined table field and field type in the data output tab.
⑥ Input data filtering: You can customize the filtering conditions by filtering expressions, then the associated data is the data that satisfies the filtering conditions. Through the button between the table field and the output data field, you can customize the content of the output data field, including the field type, which can be defined in the output data field.
⑦Row: Design the format of the output pivot table row, and select the field located at the row position in the final output pivot table.
⑧Column: Design the format of the output pivot table column, and select the field located in the column position in the final output pivot table.
⑨ Statistical value: Set the statistical value or calculation amount (summation/count, etc.) to be displayed according to the data aggregation dimension after subtotal
# Unpivot Table

# Node Function
It can realize the reverse pivoting function of the data table.
Basic Information Tab
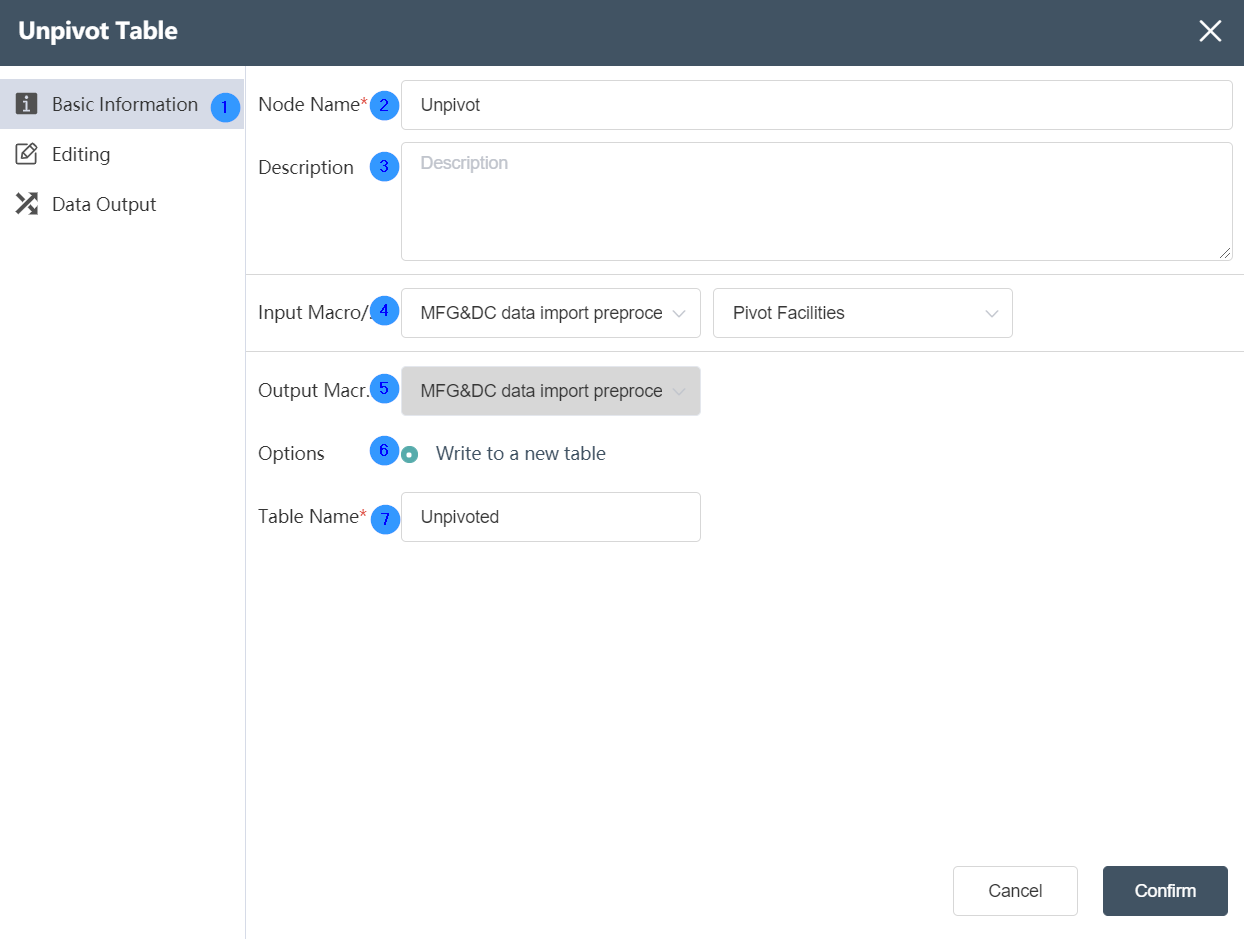
①Basic Information Tab: select this item to edit the basic information of the node
②Node name: Display the name of the node on the canvas.
③Node description: The custom description of the node function, displayed when the node information button is clicked on the canvas.
④ Input data: Determine the data source of the node, and select the data source of the database connection node in the same node group.
⑤ Output data: not selectable, the default is the temporary database of the current node.
⑥Write mode: write new table by default
⑦Table name: The table name of the data output, the default value is the same as the input sheet name. It can be a new table, but it cannot be an existing table in the current database. When the table already exists, it will prompt "Duplicate table name".
Data Editing Tab
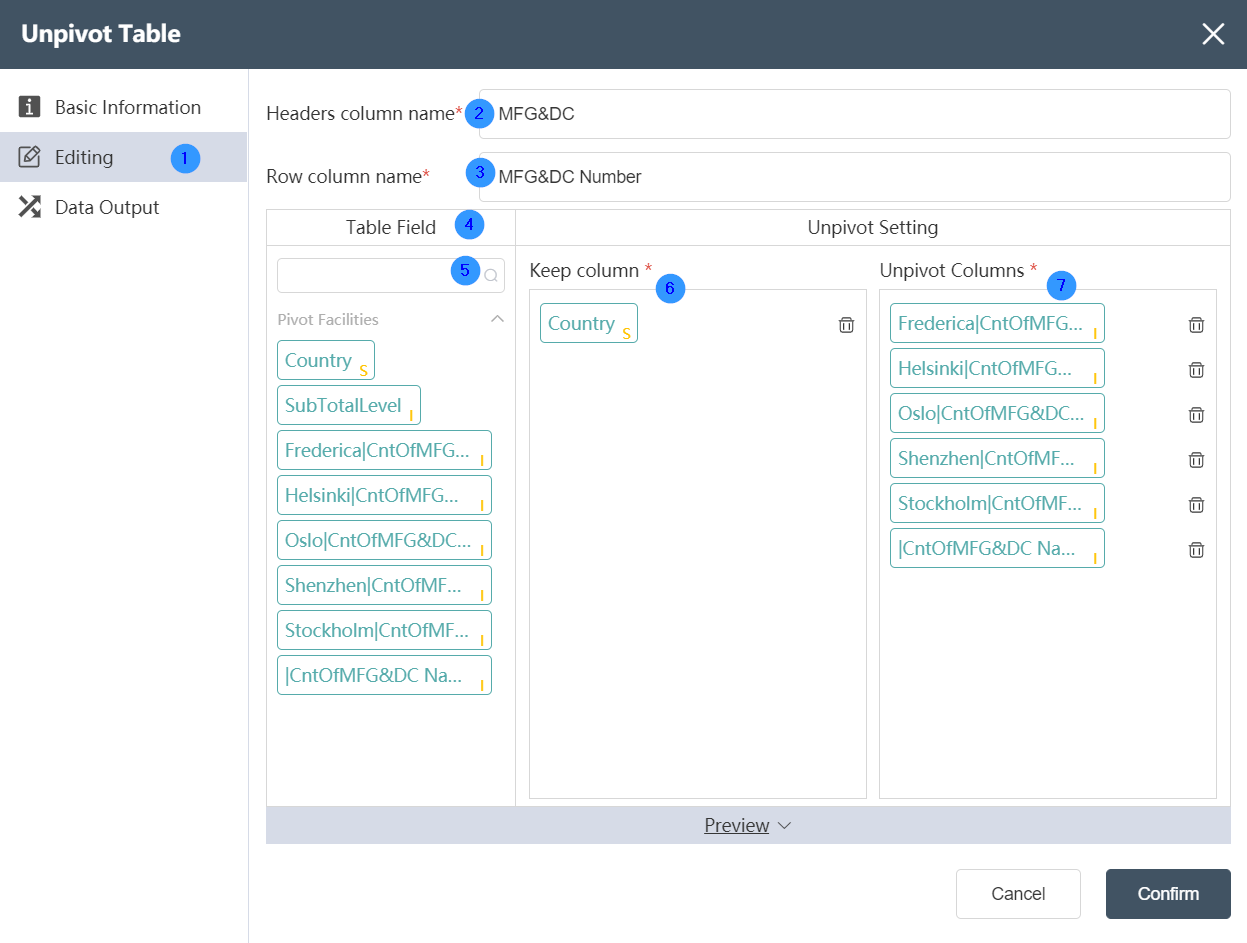
Data Editing Tab:
①Data editing: You can edit the conditions of data checking and the results of editing the output table on this interface.
②Column value field name: Define the name of the field used to display the column value in the one-dimensional output table.
③Transform column field name: Define the name in the one-dimensional output table after multiple fields in the two-dimensional input table are aggregated by reverse pivot classification.
④Table field: After data editing, you can see the defined table field and field type in the data output tab.
⑤Table field search: Quickly locate the fields in the input table by searching for the field name.
⑥Reserved column: Select the fields of the two-dimensional input table that need to be reserved to the one-dimensional output table.
⑦Reverse pivot column: Select the fields that need to be classified and aggregated in the two-dimensional input table field, and these fields will be classified into the transformation column field set in the third step in the one-dimensional output table.
Data Output Tab
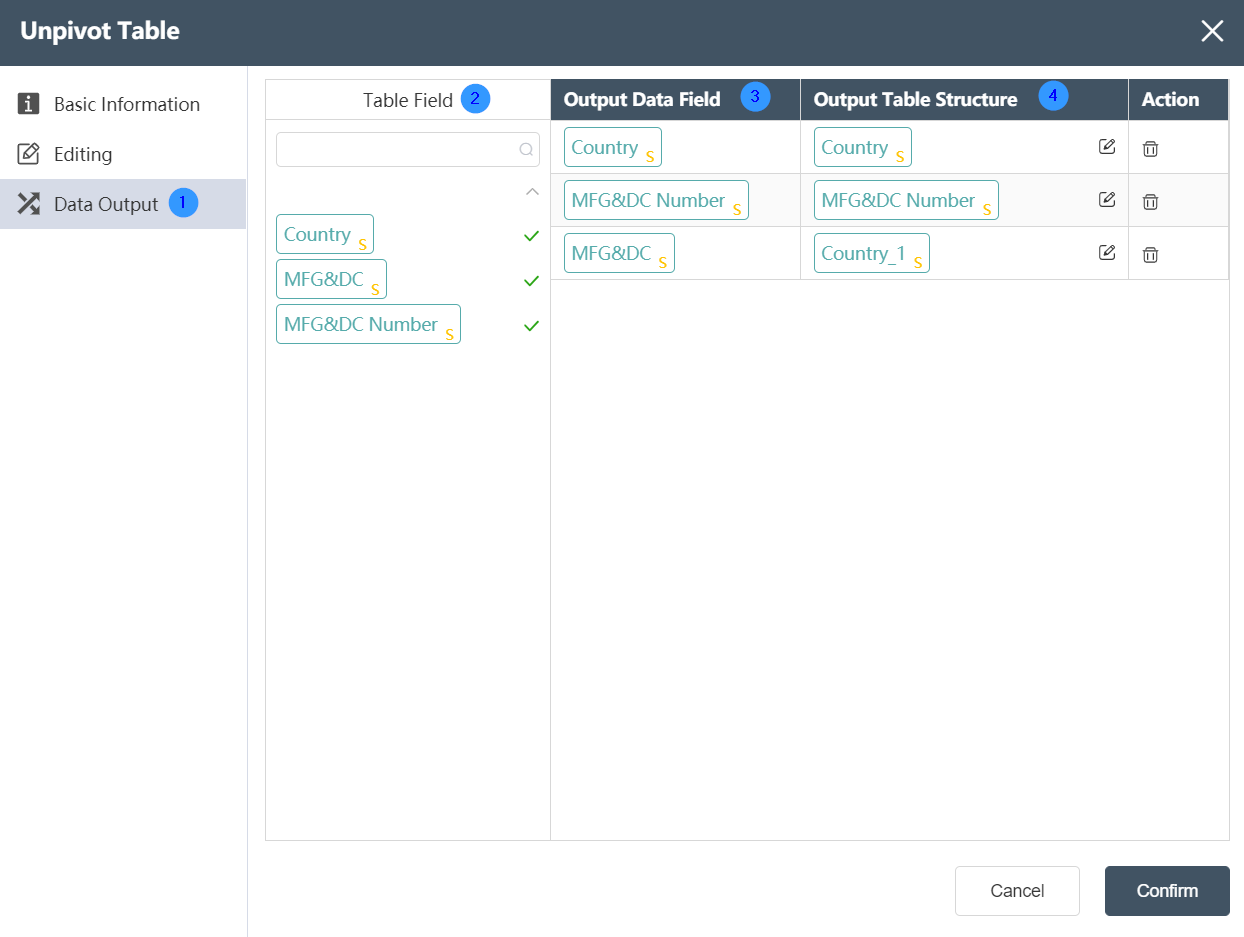
Data Output Tab:
①Data output: After data editing, you can see the defined table fields and field types in the data output tab.
②Table field: After editing the data, you can see the defined table field and field type in the data output tab.
③ Output data field: Display the column name and data type of the data in the source data table.
④Output table structure: Display the column name and data type of the data in the merged data.
# Data Analysis Node
# Aggregation Action

# Node Function
For the table under the current node group, perform summary aggregation. The results can be written to a new table, or an existing table, (optionally empty before writing); support grouping aggregation after single-table or multi-table association, support configuring the type of output fields (including adding new fields), Other: Supports filtering of input and output data.
Basic Information Tab
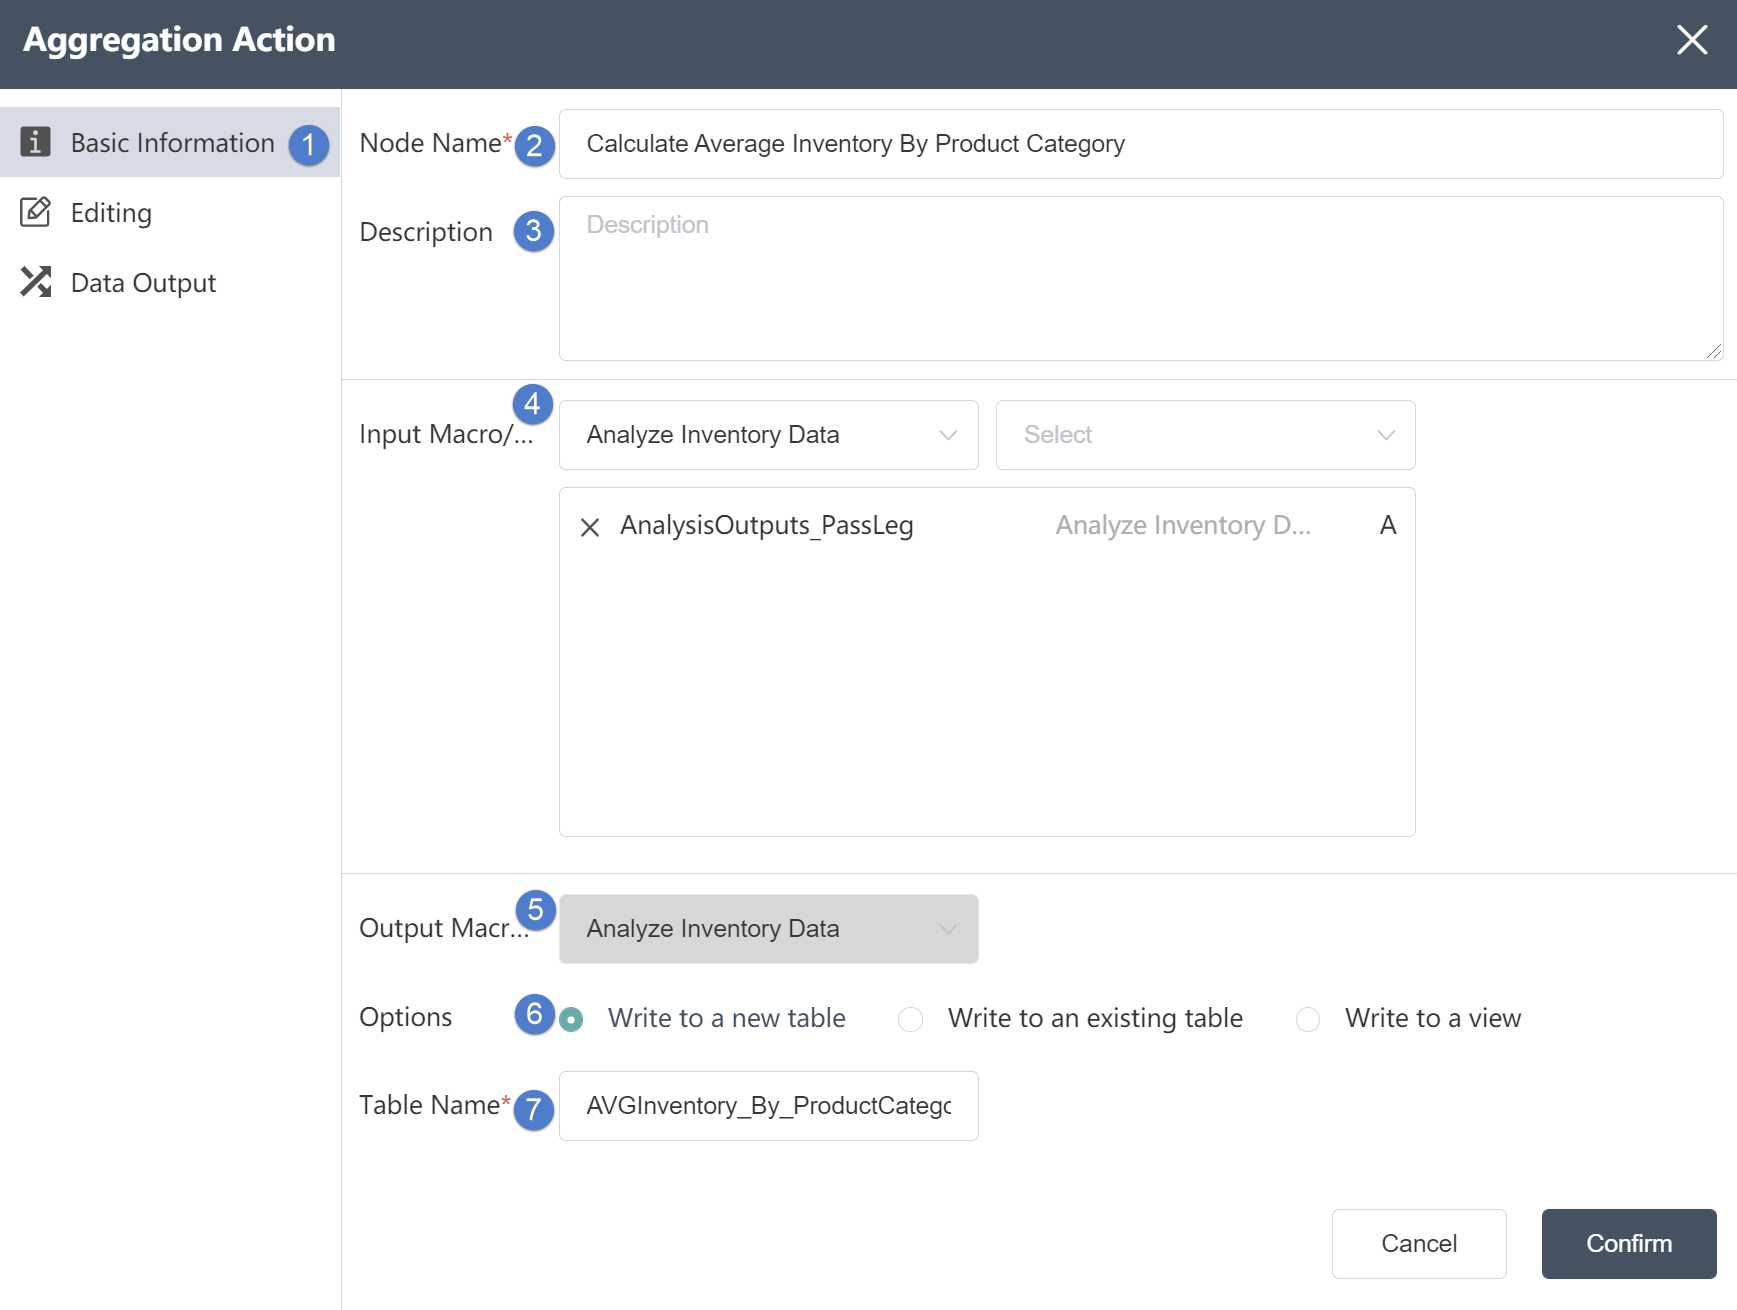
②Node name: Display the name of the node on the canvas.
③Node description: The custom description of the node function, displayed when the node information button is clicked on the canvas.
④ Input data: You can select multiple tables to determine the data source of the node. The data source must be the data source of the database connection node in the same node group.
⑤ Output data: cannot be changed.
⑥Write mode: Three options are available. If you choose to write to a new table, a new table will be created to store the merged content; if you choose to write to an existing table, the merged content will be stored in the table. If you choose to generate a view, the processing result will be temporarily stored and will not be written to the table. Subsequent references to this node result can directly reference the view.
⑦Table name: Make sure to select the corresponding table name contained in the connection database.
Data Editing Tab
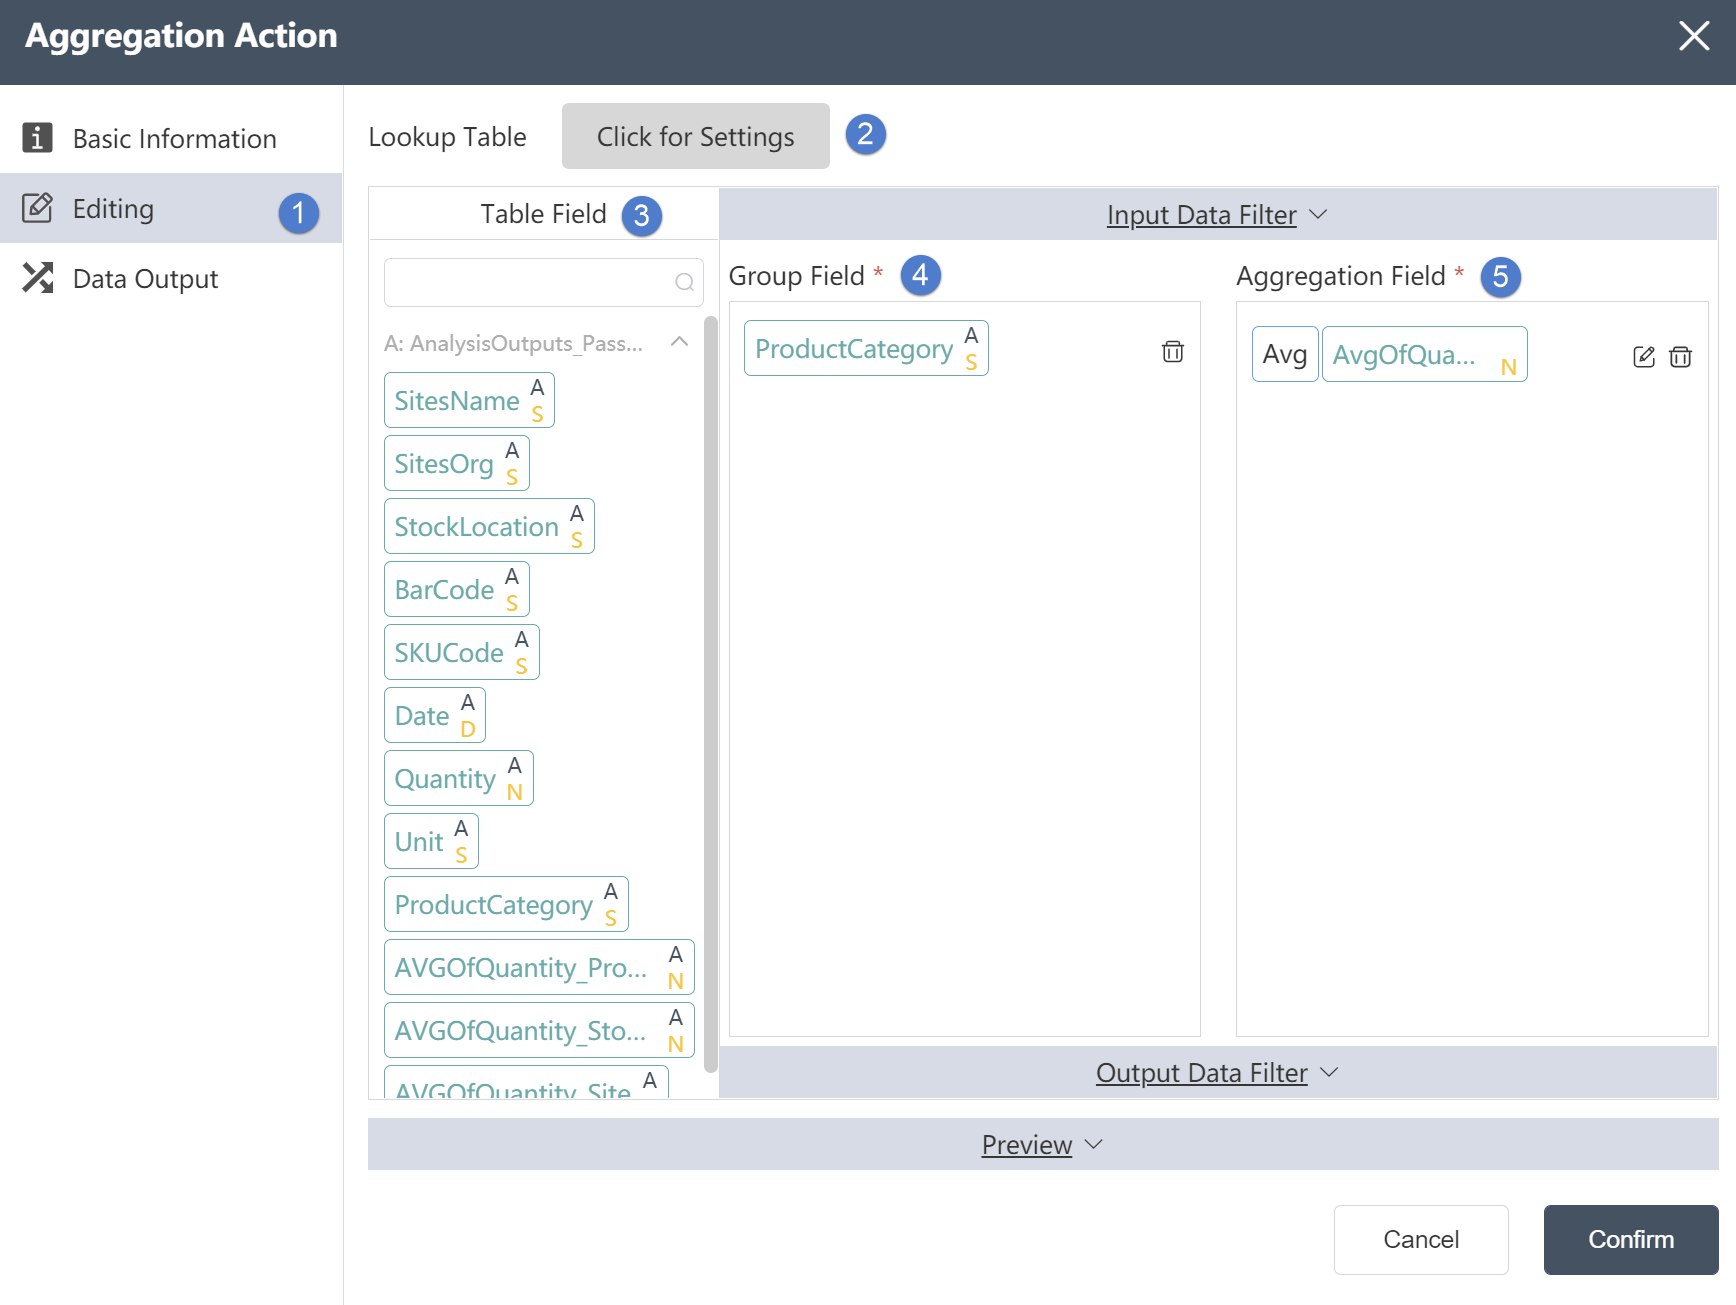
Data Editing Tab:
①The merged table fields can be edited in the data editing tab.
②Association table: You can choose the association relationship in the association table, such as left association/right association/inner association/outer association, etc., and edit the key values associated in the two tables.
③Table Field: In Table Field, you can see the fields and field types contained in the table.
④ Grouping field: Import the imported data field into the grouping field, and the data will use the grouping field as a group to aggregate other data.
⑤ Aggregation result field: Import the fields of imported data into the aggregation result field, and the data will aggregate the fields of these results by grouping fields.
Data Output Tab
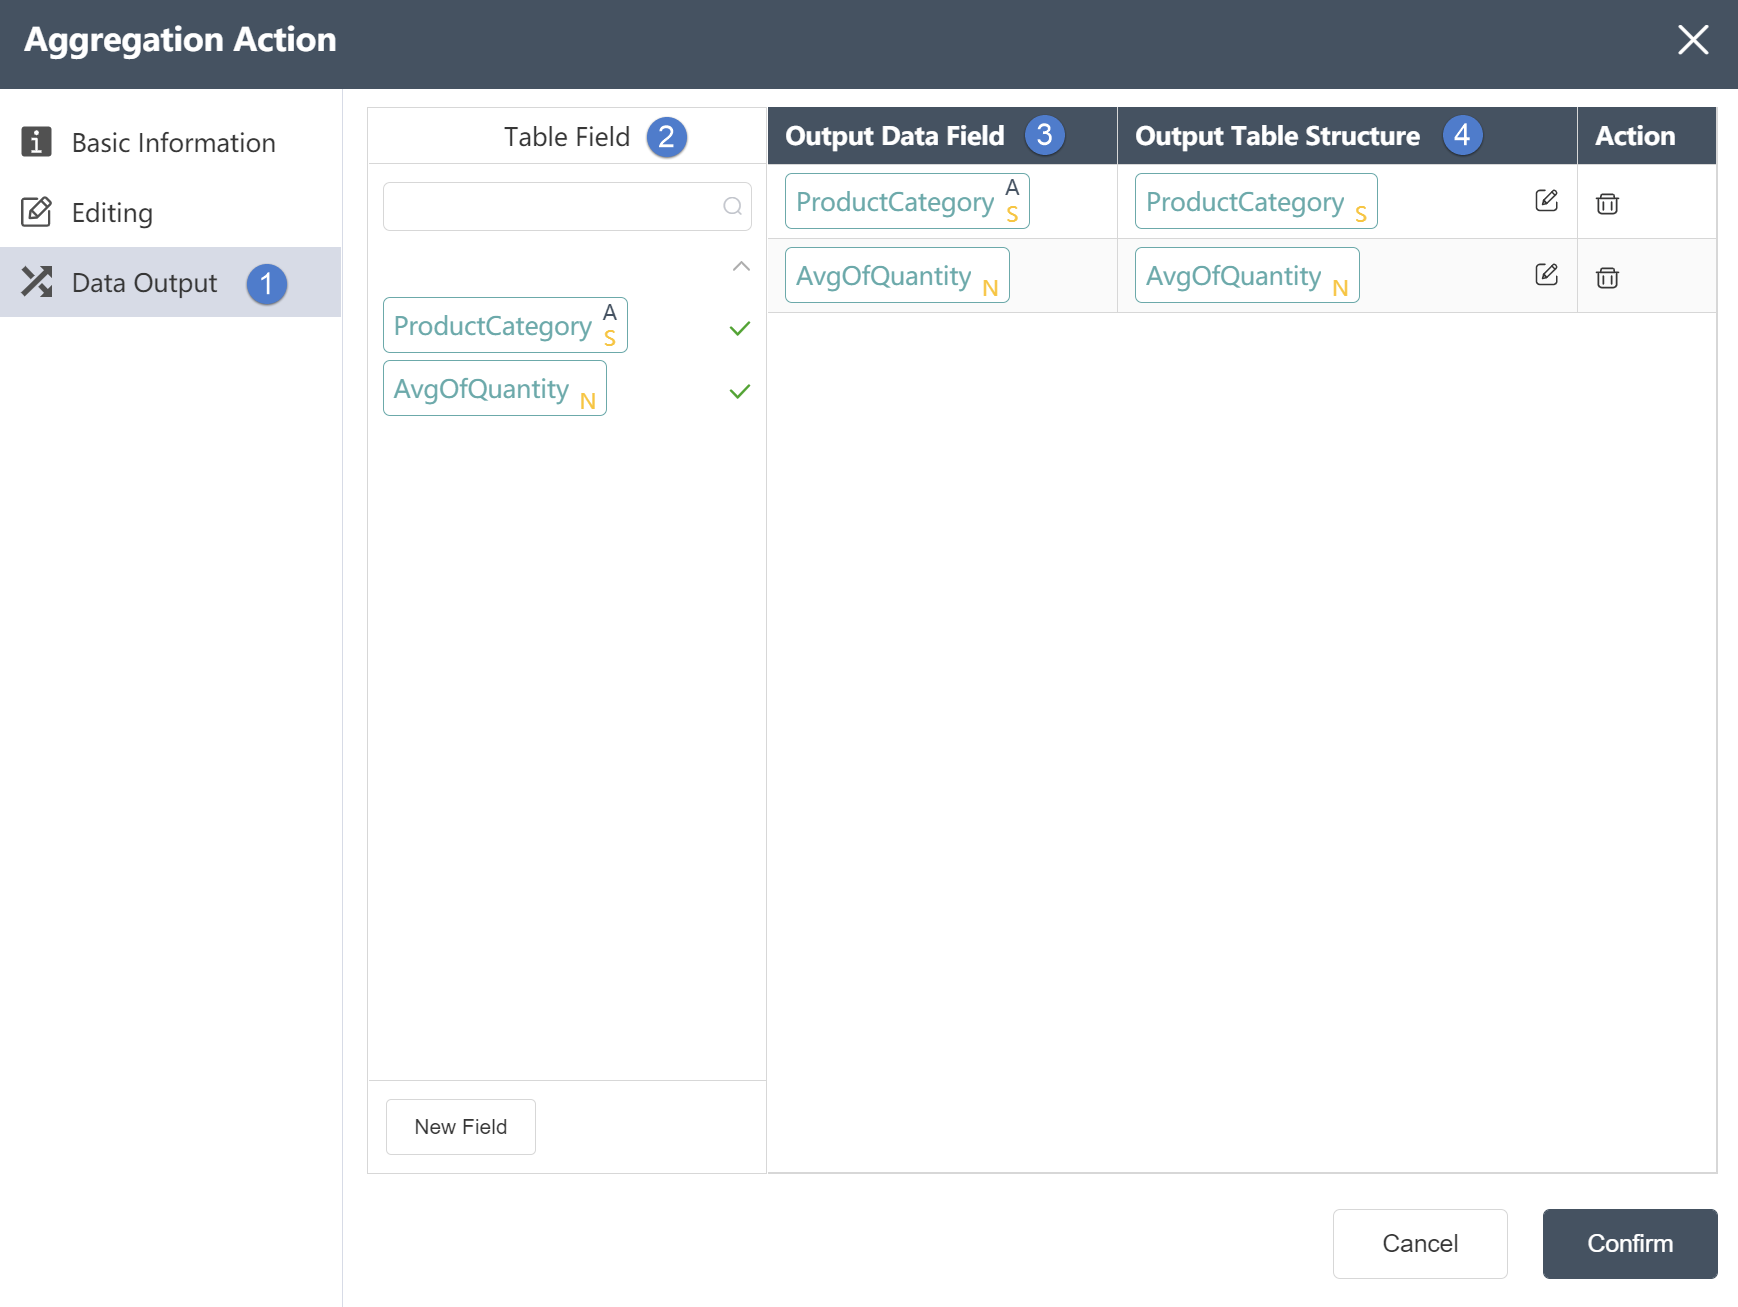
①In the data output tab, you can view the associated table fields.
②Table field: After editing the data, you can see the defined table field and field type in the data output tab.
③ Output data field: Display grouping field and aggregation result field.
④Output table structure: Display the column name and data type of the data in the merged data.
# Conditional Update

# Node Function
For the table under the current node group, update the value of the existing field or write the new field; support the field update of single table or multi-table association; support the input and operation of complex expressions. For conforming and non-conforming conditions, they can be assigned values separately; filter expressions for input data are supported.
Basic Information Tab
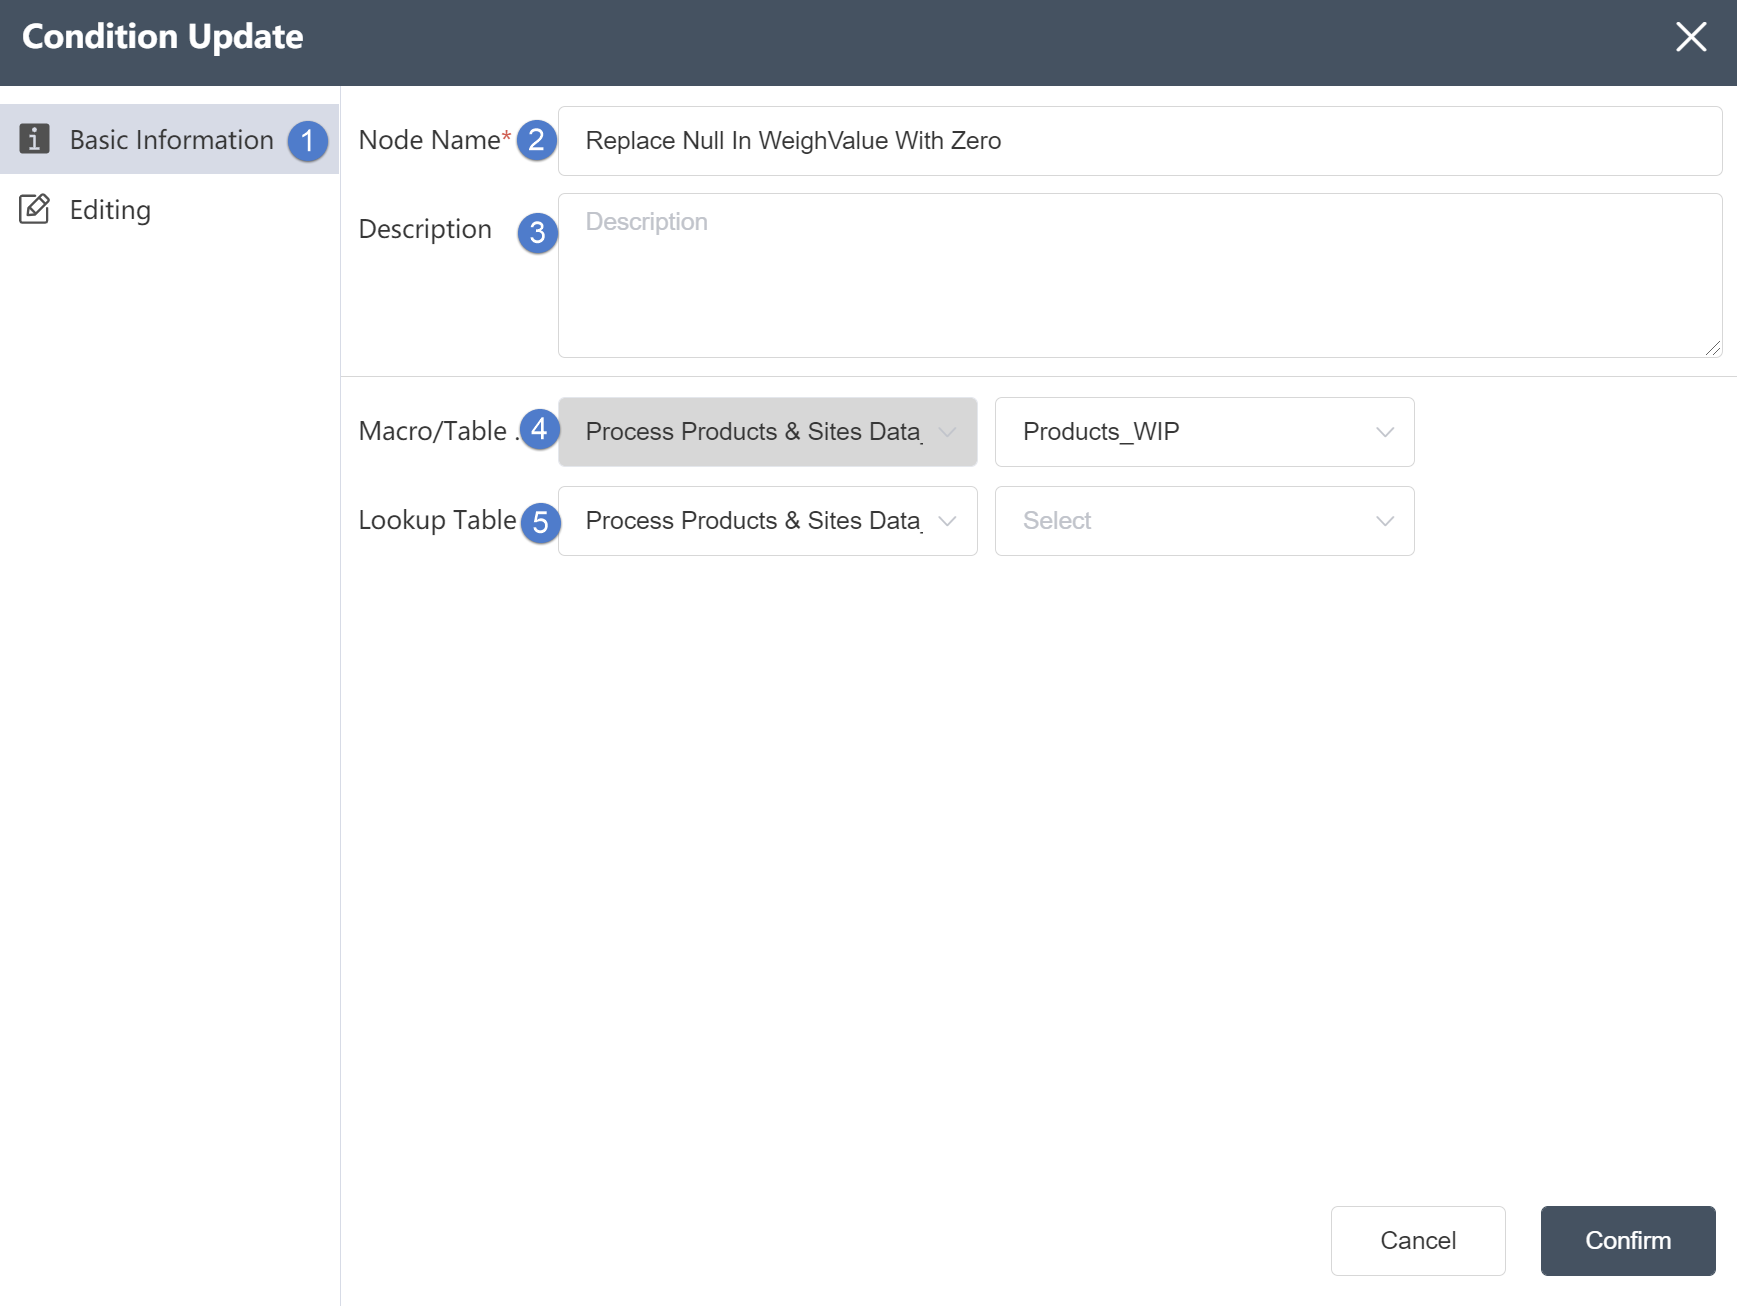
①Basic Information Tab: select this item to edit the basic information of the node
②Node name: Display the name of the node on the canvas.
③Node description: The custom description of the node function, displayed when the node information button is clicked on the canvas.
④Target data: Determine the data source of the node, the target data is the main table, and the data column will be updated on the basis of this table later.
⑤Reference table: The reference table is the table to be associated. After setting the associated data, you can select data update in the reference table.
Data Editing Tab
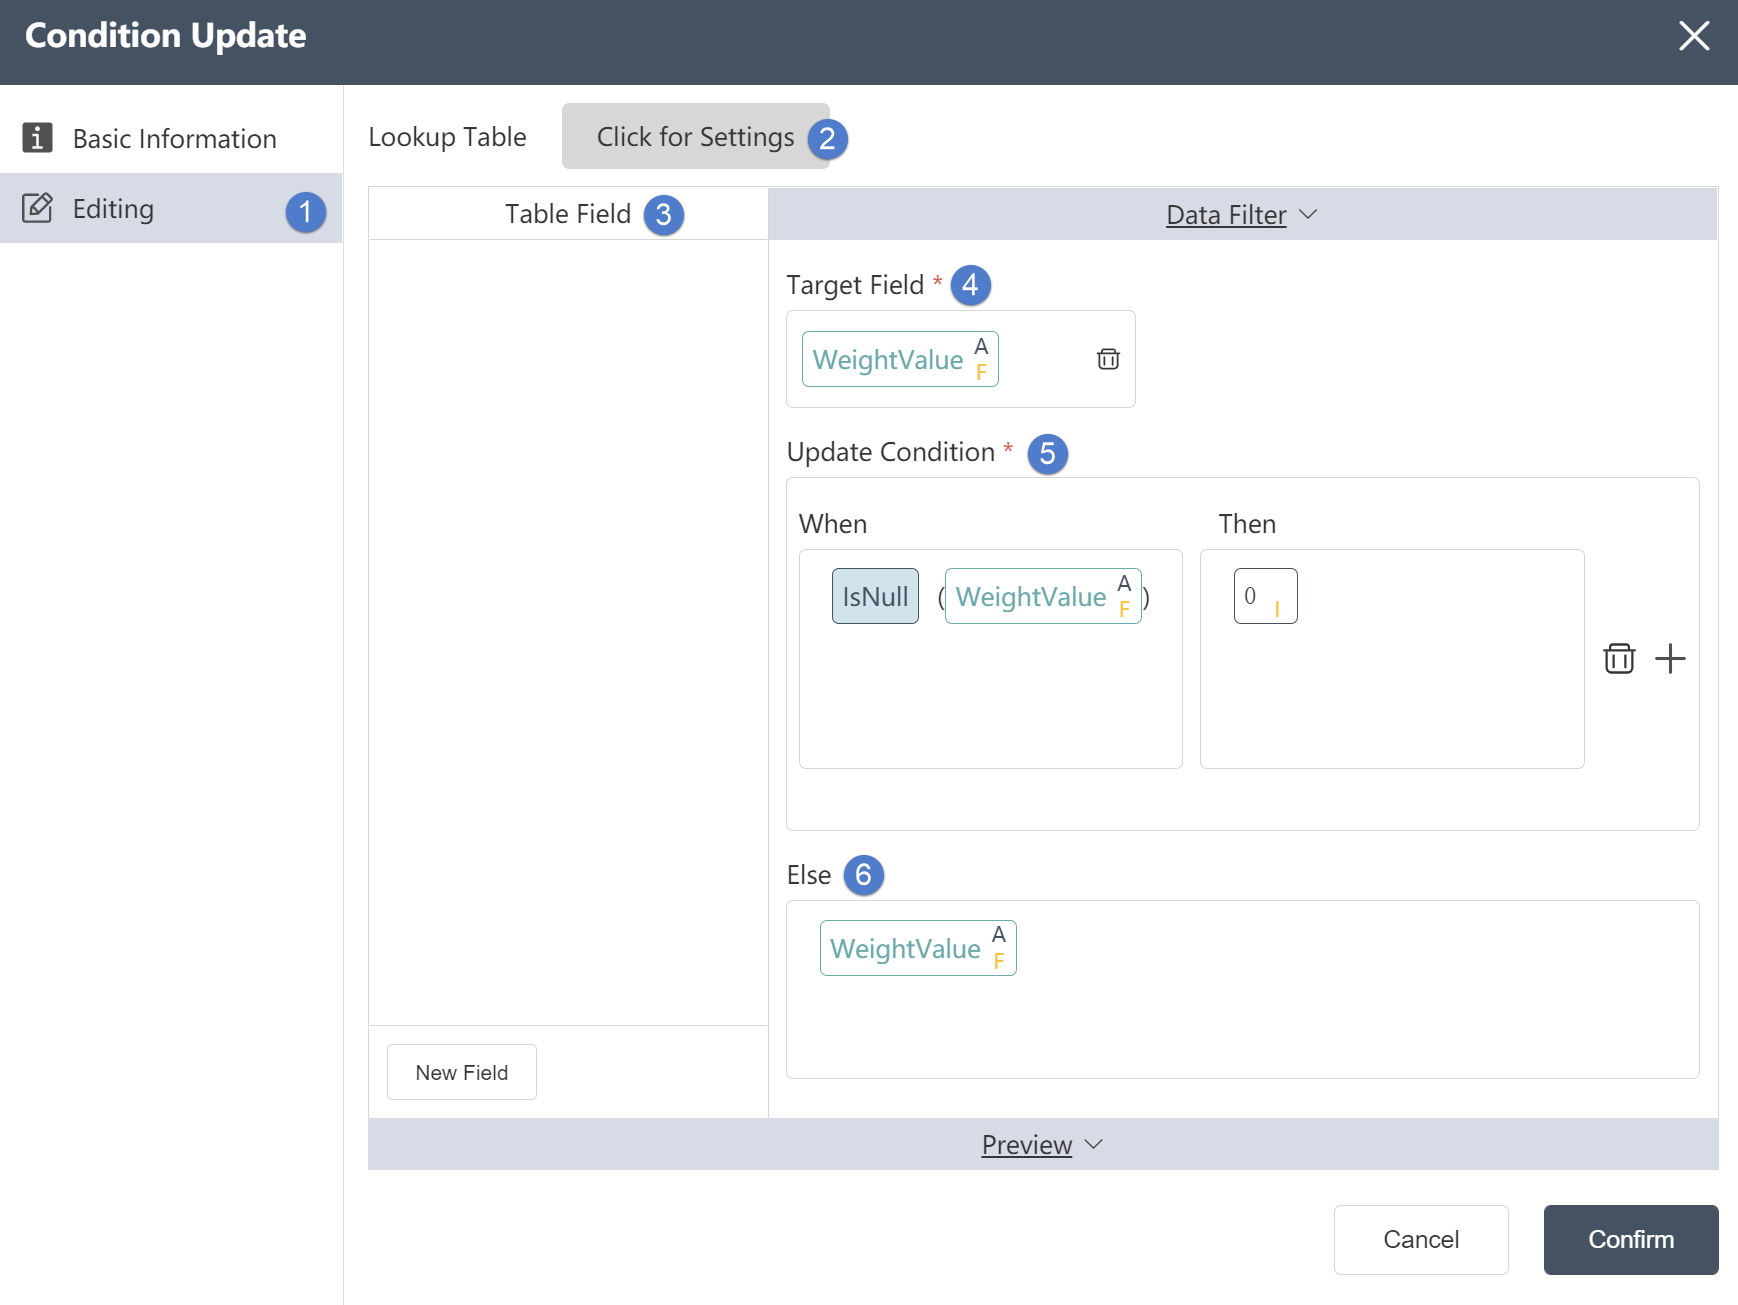
Data Editing Tab:
①Data editing: You can edit the conditions of data checking and the results of editing the output table on this interface.
②Reference table: In the reference table setting, you can select the association relationship and edit the associated key values in the two tables. But you can only select the intersection of the target table and the reference table or take all the rows of the target table. (optional)
③Table field: After editing the data, you can see the defined table field and field type in the data output tab.
④Target field: refers to the field name to be processed or modified
⑤ Update condition: The content of the target field that satisfies a certain condition will be updated to a certain value, depending on the content of the input condition.
⑥Otherwise: Refers to the value that the data should be updated when the target field does not meet the update conditions.
# Data Fork

# Node Function
Based on conditions, the table under the current node group can be separated into two tables; the results can be written to a new table, written to an existing table (optionally empty before writing), and generated views; Separate naming of matching tables; support separation based on filter conditions or reference table association; support preview of results (matching, unmatched table display)
Basic Information Tab
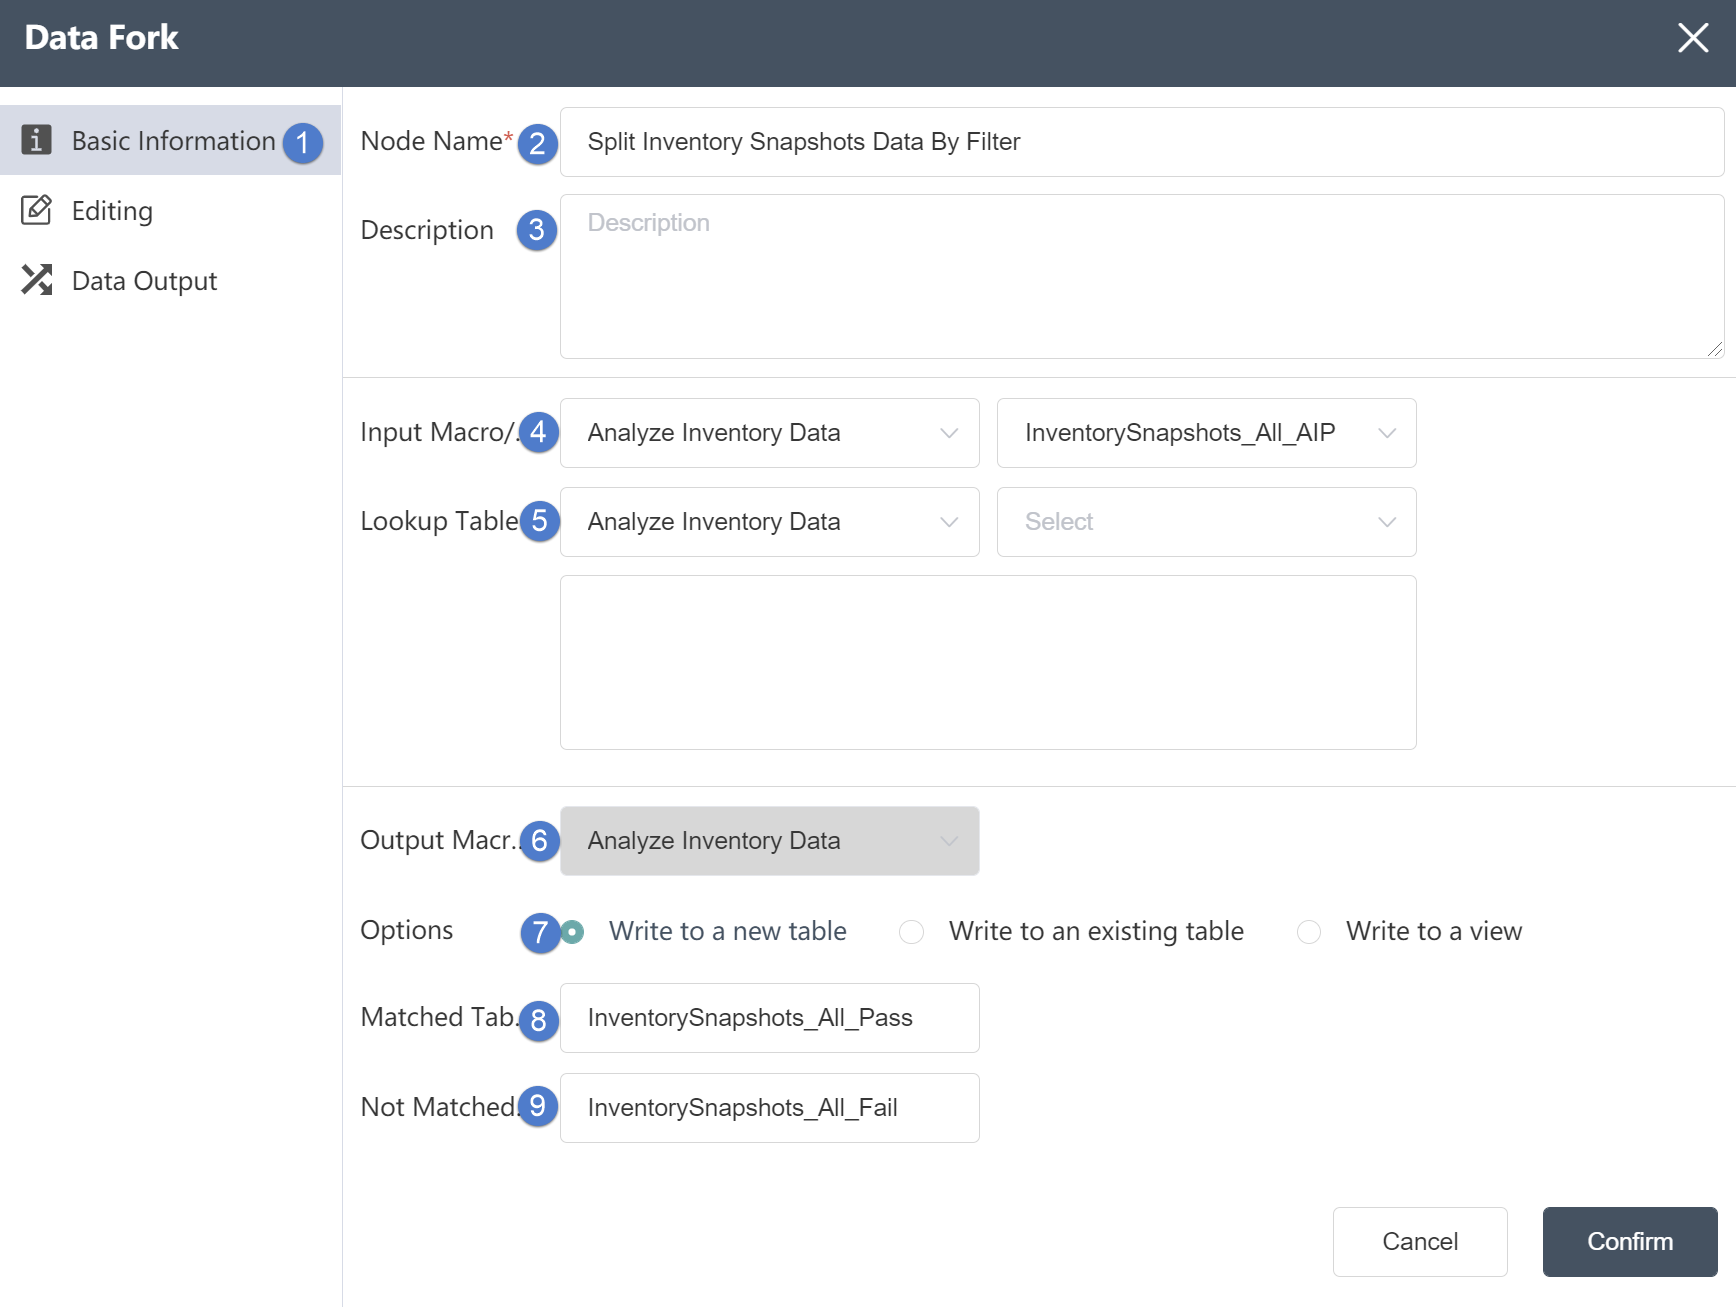
①Basic Information Tab: select this item to edit the basic information of the node
②Node name: Display the name of the node on the canvas.
③Node description: The custom description of the node function, displayed when the node information button is clicked on the canvas.
④ Input data: You can select multiple tables to determine the data source of the node. The data source must be the data source of the database connection node in the same node group.
⑤Reference table: used as a reference for input data, which can be matched through associated fields.
⑥ Output data: cannot be changed.
⑦Write mode: Three options are available. If you choose to write to a new table, a new table will be created to store the merged content; if you choose to write to an existing table, the merged content will be stored in the table.
⑧Matching table: Fill in the name of the matching table. According to the matching conditions in the data editing, those that pass the matching conditions will be stored in the matching table.
⑨ Non-matching table: Fill in the name of the non-matching table. According to the matching conditions in the data editing, those that do not pass the matching conditions will be stored in the non-matching table.
Data Editing Tab
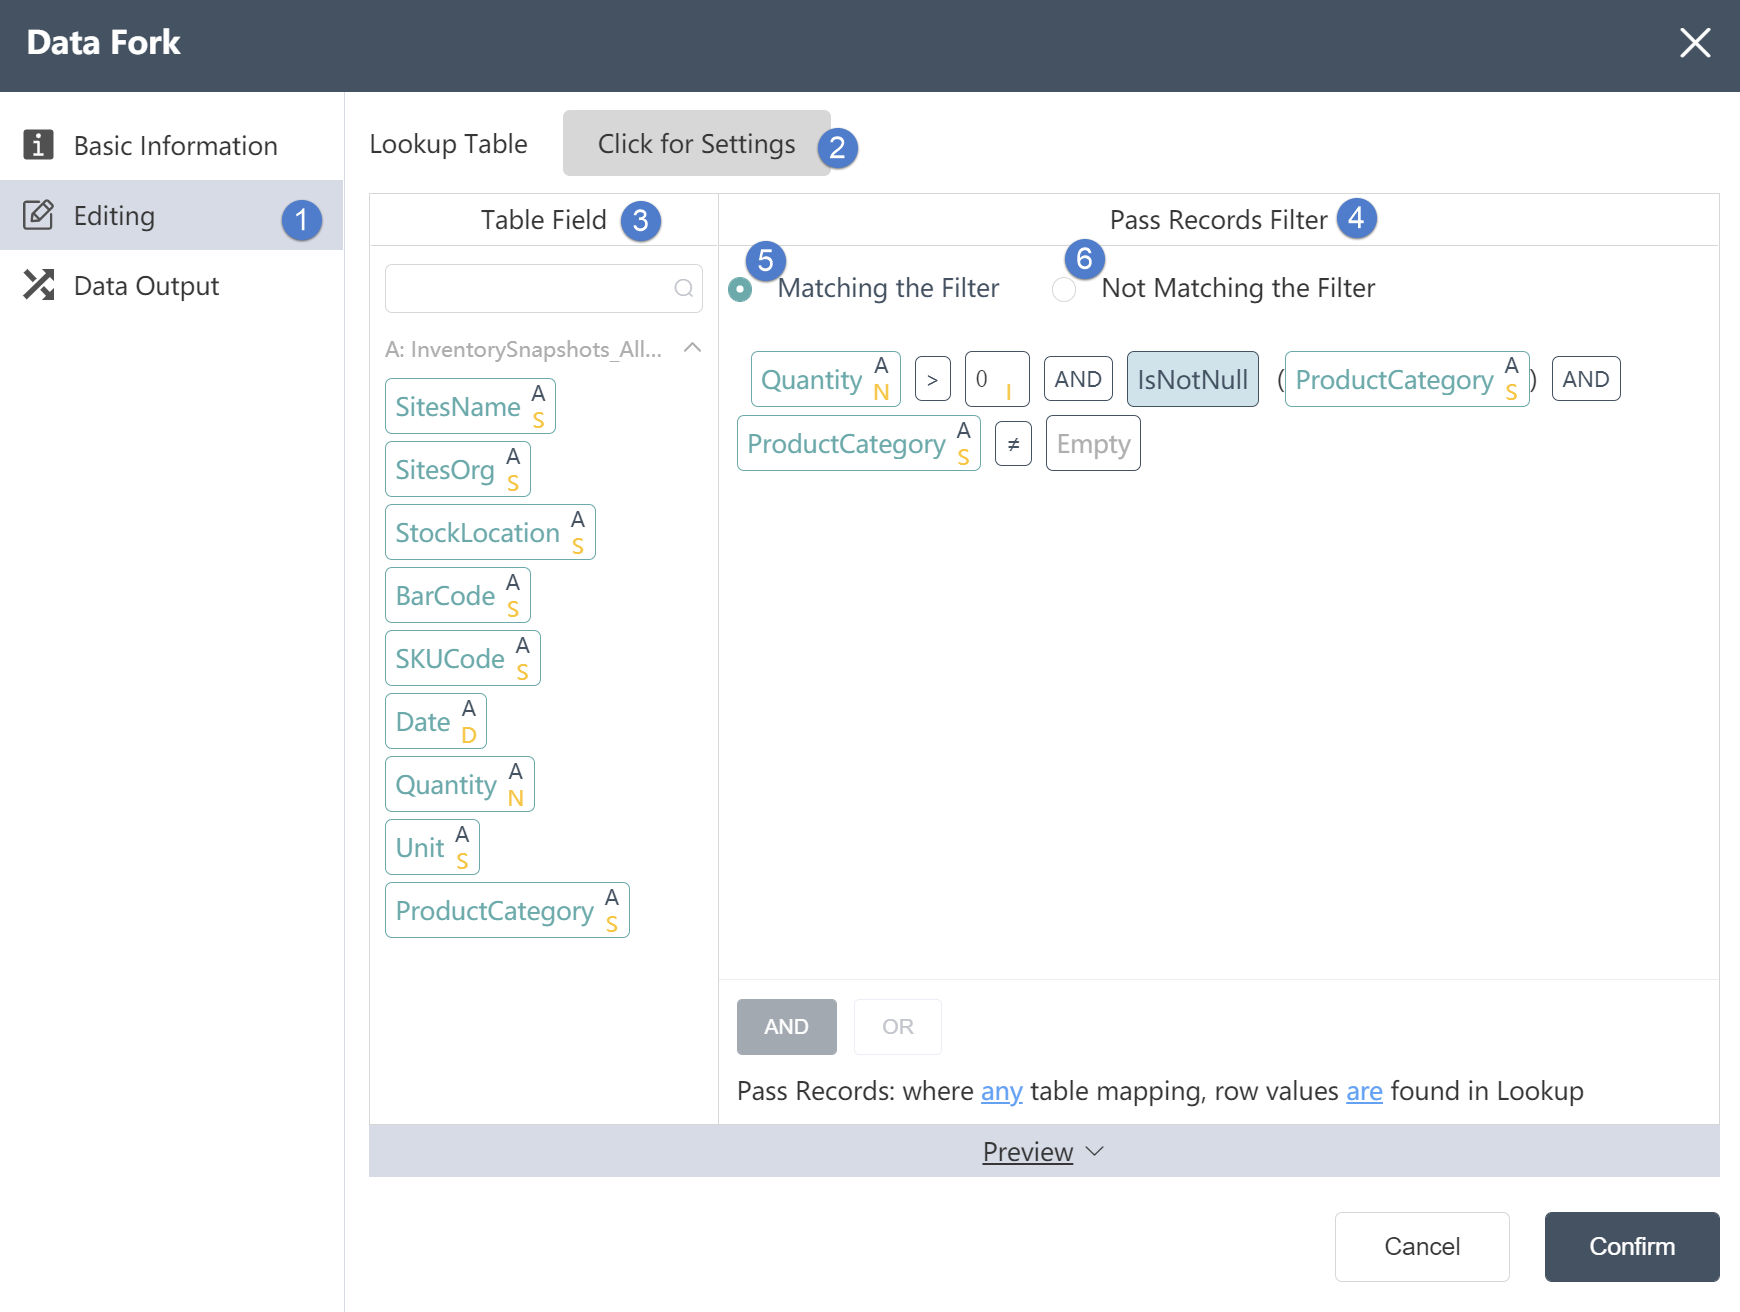
Data Editing Tab:
①Data editing: You can edit the conditions of data separation and the results of editing the output table on this interface.
②Reference table: In the reference table setting, you can select the association relationship and edit the associated key values in the two tables. But you can only select the intersection of the target table and the reference table or take all the rows of the target table. (optional)
③Input table fields: After editing the data, you can see the defined table fields and field types in the data output tab.
④Meet the filter conditions: Select this condition to delete the data rows that meet the following filter conditions.
⑤ Does not meet the filter conditions: Select this condition to delete the data rows that do not meet the following filter conditions.
⑥Filter conditions: You can customize the filter conditions, with a high degree of freedom. Data that meets/does not meet the filter conditions will be stored in the corresponding table respectively.
Data Output Tab
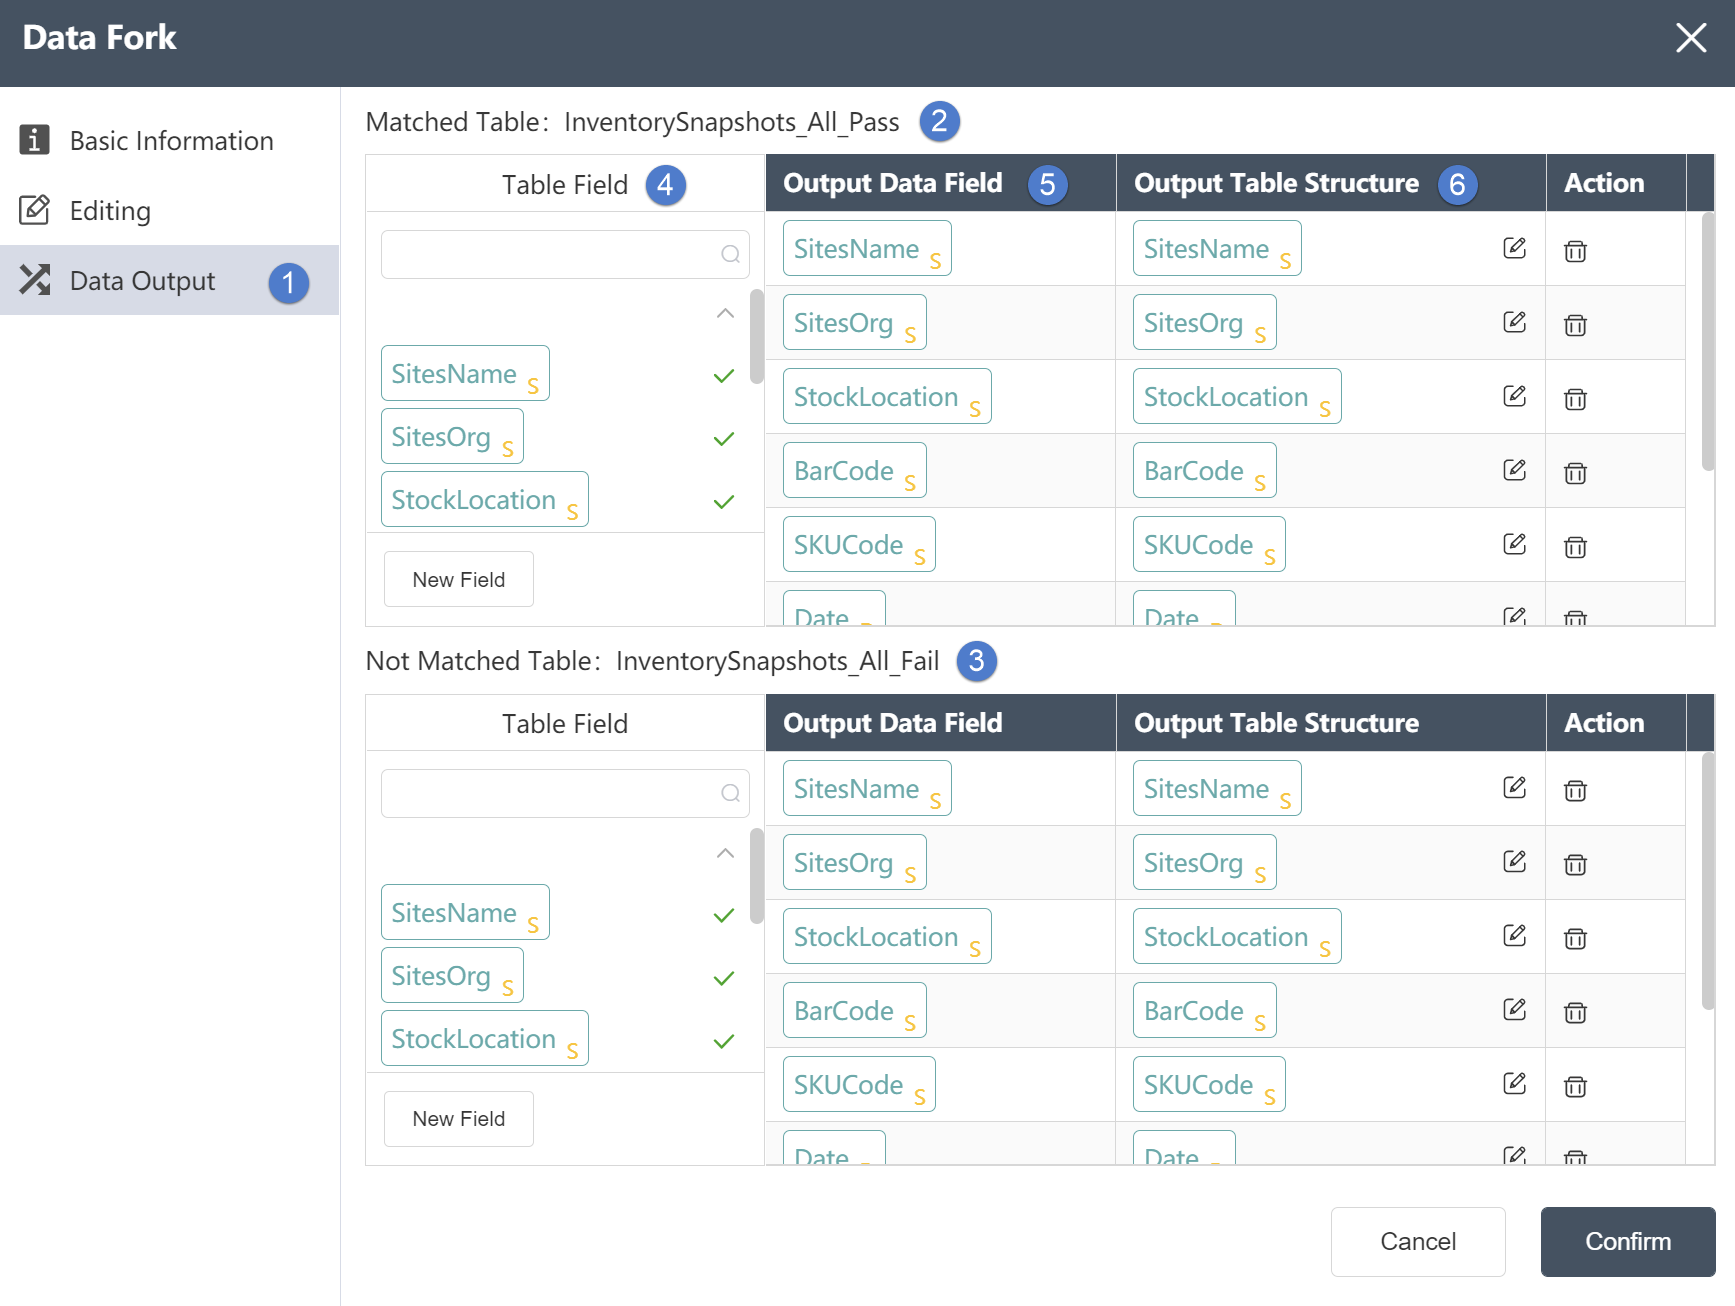
Data Output Tab:
- Data output: After data editing, you can see the defined table fields and field types in the data output tab.
- Match table: After the data editor writes the filter conditions, the content that meets the filter conditions will be stored in the match table.
- Non-matching table: After the data editor writes the filtering conditions, the content that does not meet the filtering conditions will be stored in the non-matching table.
- Table Fields: After editing the data, you can see the defined table fields and field types in the Data Output tab.
- Output data field: Display the column name and data type of the data in the source data table.
- Output table structure: Display the column names and data types of the data in the merged data.
# Partitioned Value

# Node Function
Group statistics on the specified tables under the current node group. The statistics methods support summarization, sorting, and moving summation. Results are displayed in percentage of total, total, count, maximum, minimum; configuration of one or more grouping fields is supported.
Basic Information Tab
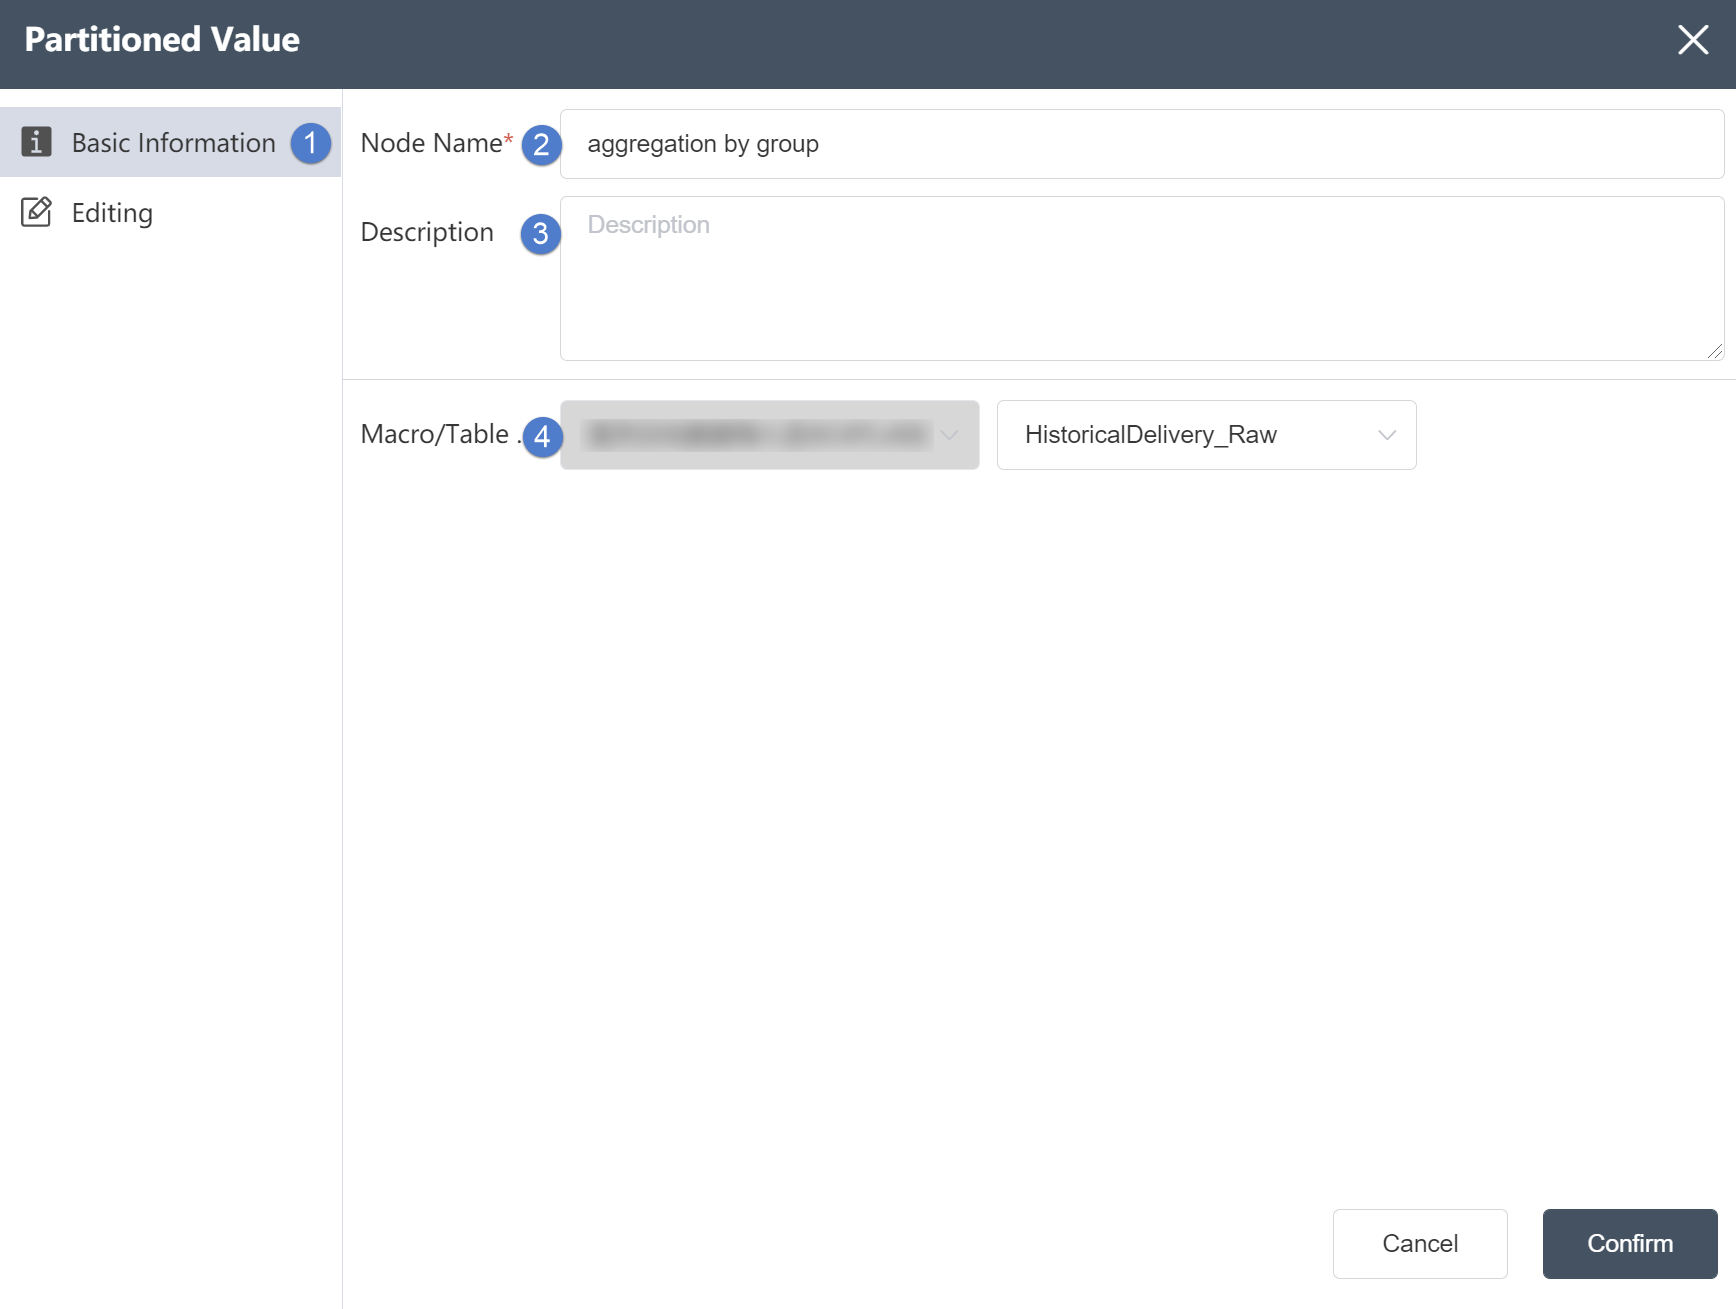
①Basic Information Tab: select this item to edit the basic information of the node
②Node name: Display the name of the node on the canvas.
③Node description: The custom description of the node function, displayed when the node information button is clicked on the canvas.
④Target data: Determine the data source of the node, the target data is the main table, and the data column will be updated on the basis of this table later.
Data Editing Tab
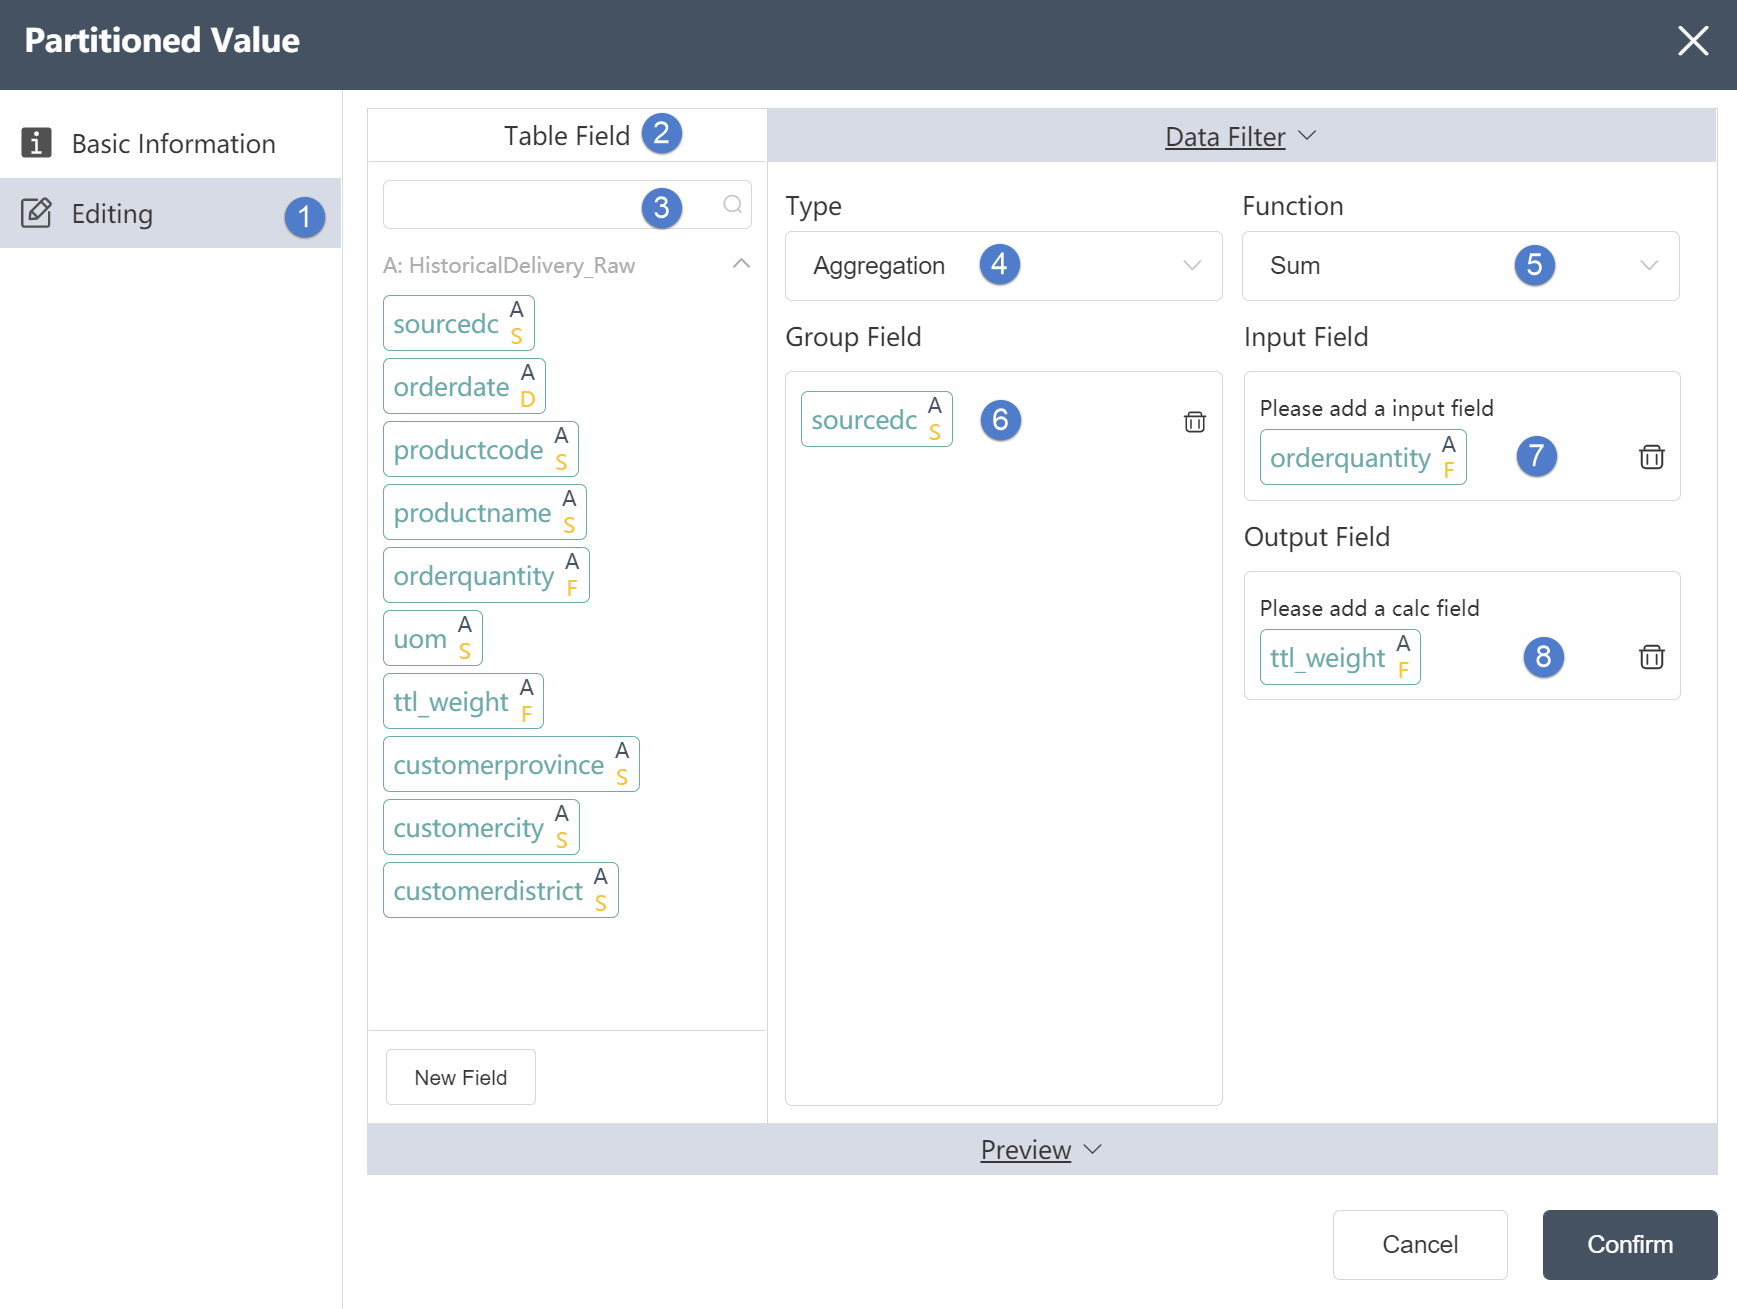
Data Editing Tab:
①Data editing: You can edit the conditions of data checking and the results of editing the output table on this interface.
②Table field: After editing the data, you can see the defined table field and field type in the data output tab.
③Search box: You can search for the desired field in the search box, which is suitable for the situation where there are too many table fields and cannot be found immediately.
④Data operation: Data processing for grouping fields, the default Aggregation refers to grouping aggregation, and options such as Rank (grouping sorting) and Running Total (grouping sorting aggregation) are available in the drop-down selection box.
⑤Output function: Calculate according to the grouping field, and the calculation formula depends on the content of the output function. If the data operation chooses Agg (aggregation), the output function can choose Percent of Sum, Sum, Count, Max, Min; if the data operation chooses Rank (grouping and sorting aggregation), the output function can choose Ordinal (the sorting method is 1, 2 , 3, 4...), Competition (sorted by 1, 1, 1, 4...), Dense (sorted by 1, 1, 1, 2...). If the data operation selects Running Total (cumulative total), the output function can select Running Total (number) or Running Percent of Total (percent).
⑥ Grouping field: refers to the field to be grouped, which can be selected in the table field.
⑦Input field: refers to the field to be calculated.
⑧ Output field: refers to the field where the calculation result is stored.
# Select Action

# Node Function
Select some or all fields of one or more tables under the current node group; the results can be written to a new table, written to an existing table (optionally empty before writing), and generated views; supports multiple association types , including inner association (intersection), left association, right association, union; supports configuring the type of output fields (including adding new fields).
Basic Information Tab
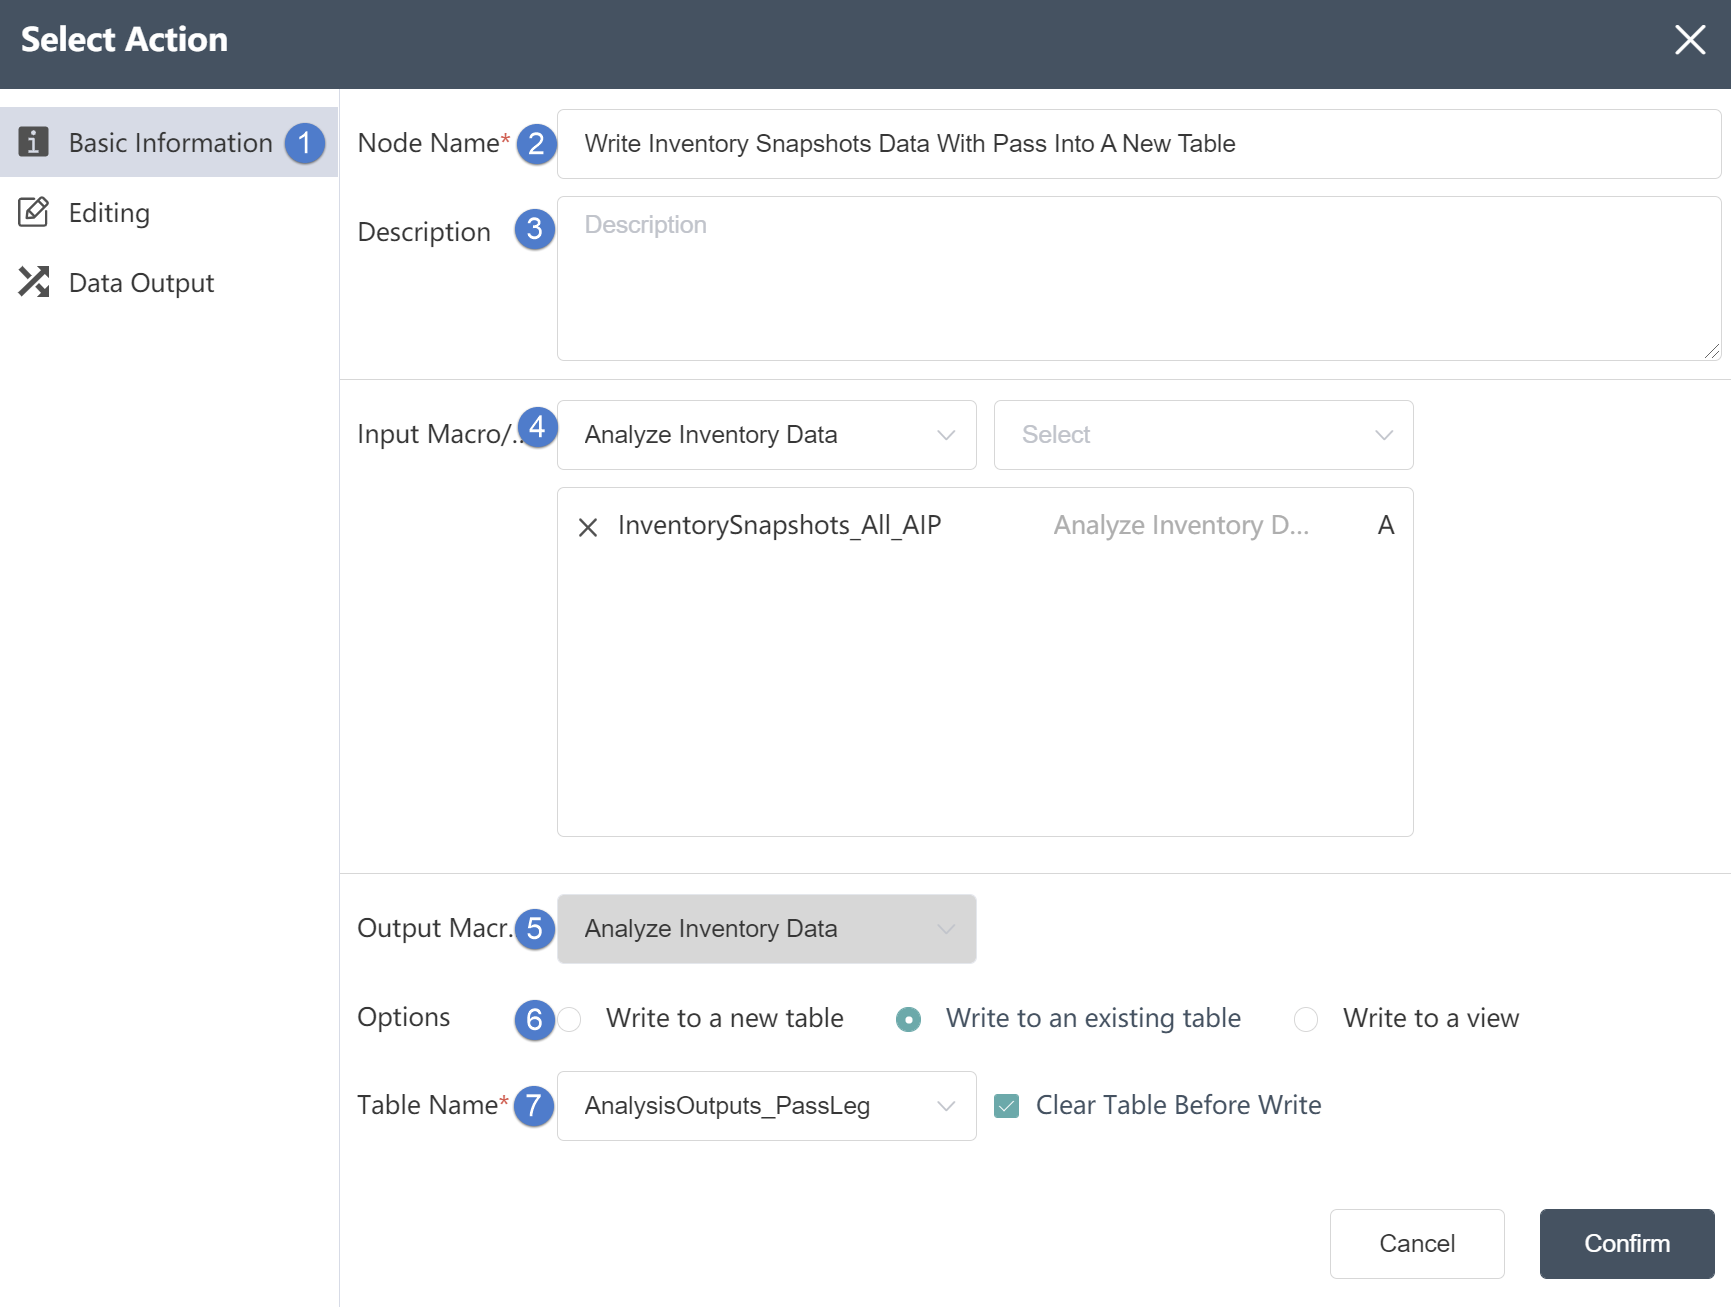
①Basic Information Tab: select this item to edit the basic information of the node
②Node name: Display the name of the node on the canvas.
③Node description: The custom description of the node function, displayed when the node information button is clicked on the canvas.
④ Input data: You can select multiple tables to determine the data source of the node. The data source must be the data source of the database connection node in the same node group.
⑤ Output data: cannot be changed.
⑤Write mode: Three options are available. If you choose to write to a new table, a new table will be created to store the merged content; if you choose to write to an existing table, the merged content will be stored in the table.
⑥Table name: Make sure to select the corresponding table name contained in the connection database.
Data Editing Tab
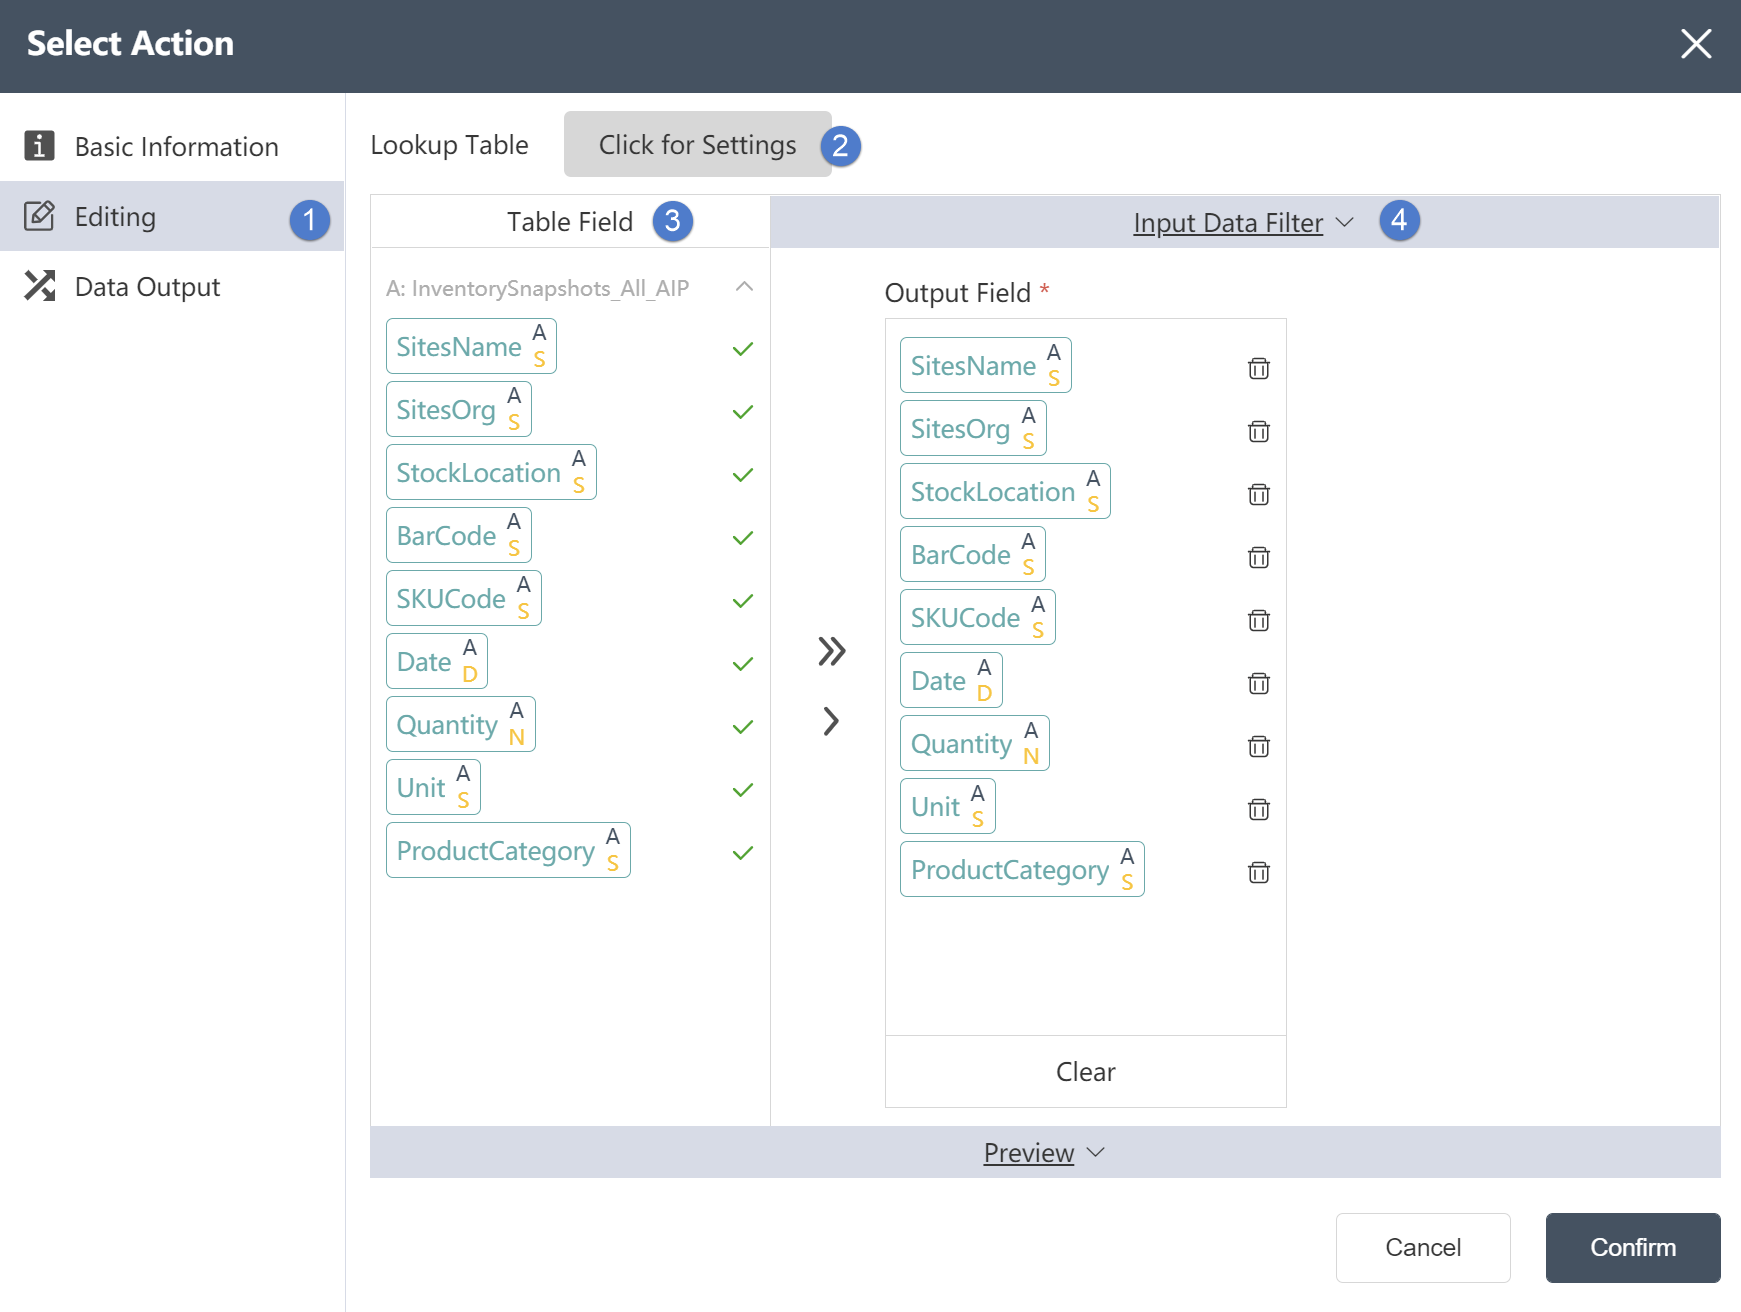
Data Editing Tab:
①In the data editing tab
The merged table fields can be edited.
②Association table: You can choose the association relationship in the association table, such as left association/right association/internal association/external association, etc., and edit the key values associated in the two tables.
③Table Field: In Table Field, you can see the fields and field types contained in the table.
④Output data filtering: You can customize the filtering conditions by filtering expressions, then the associated data is the data that satisfies the filtering conditions. Through the button between the table field and the output data field, you can customize the content of the output data field, including the field type, which can be defined in the output data field.
Data Output Tab
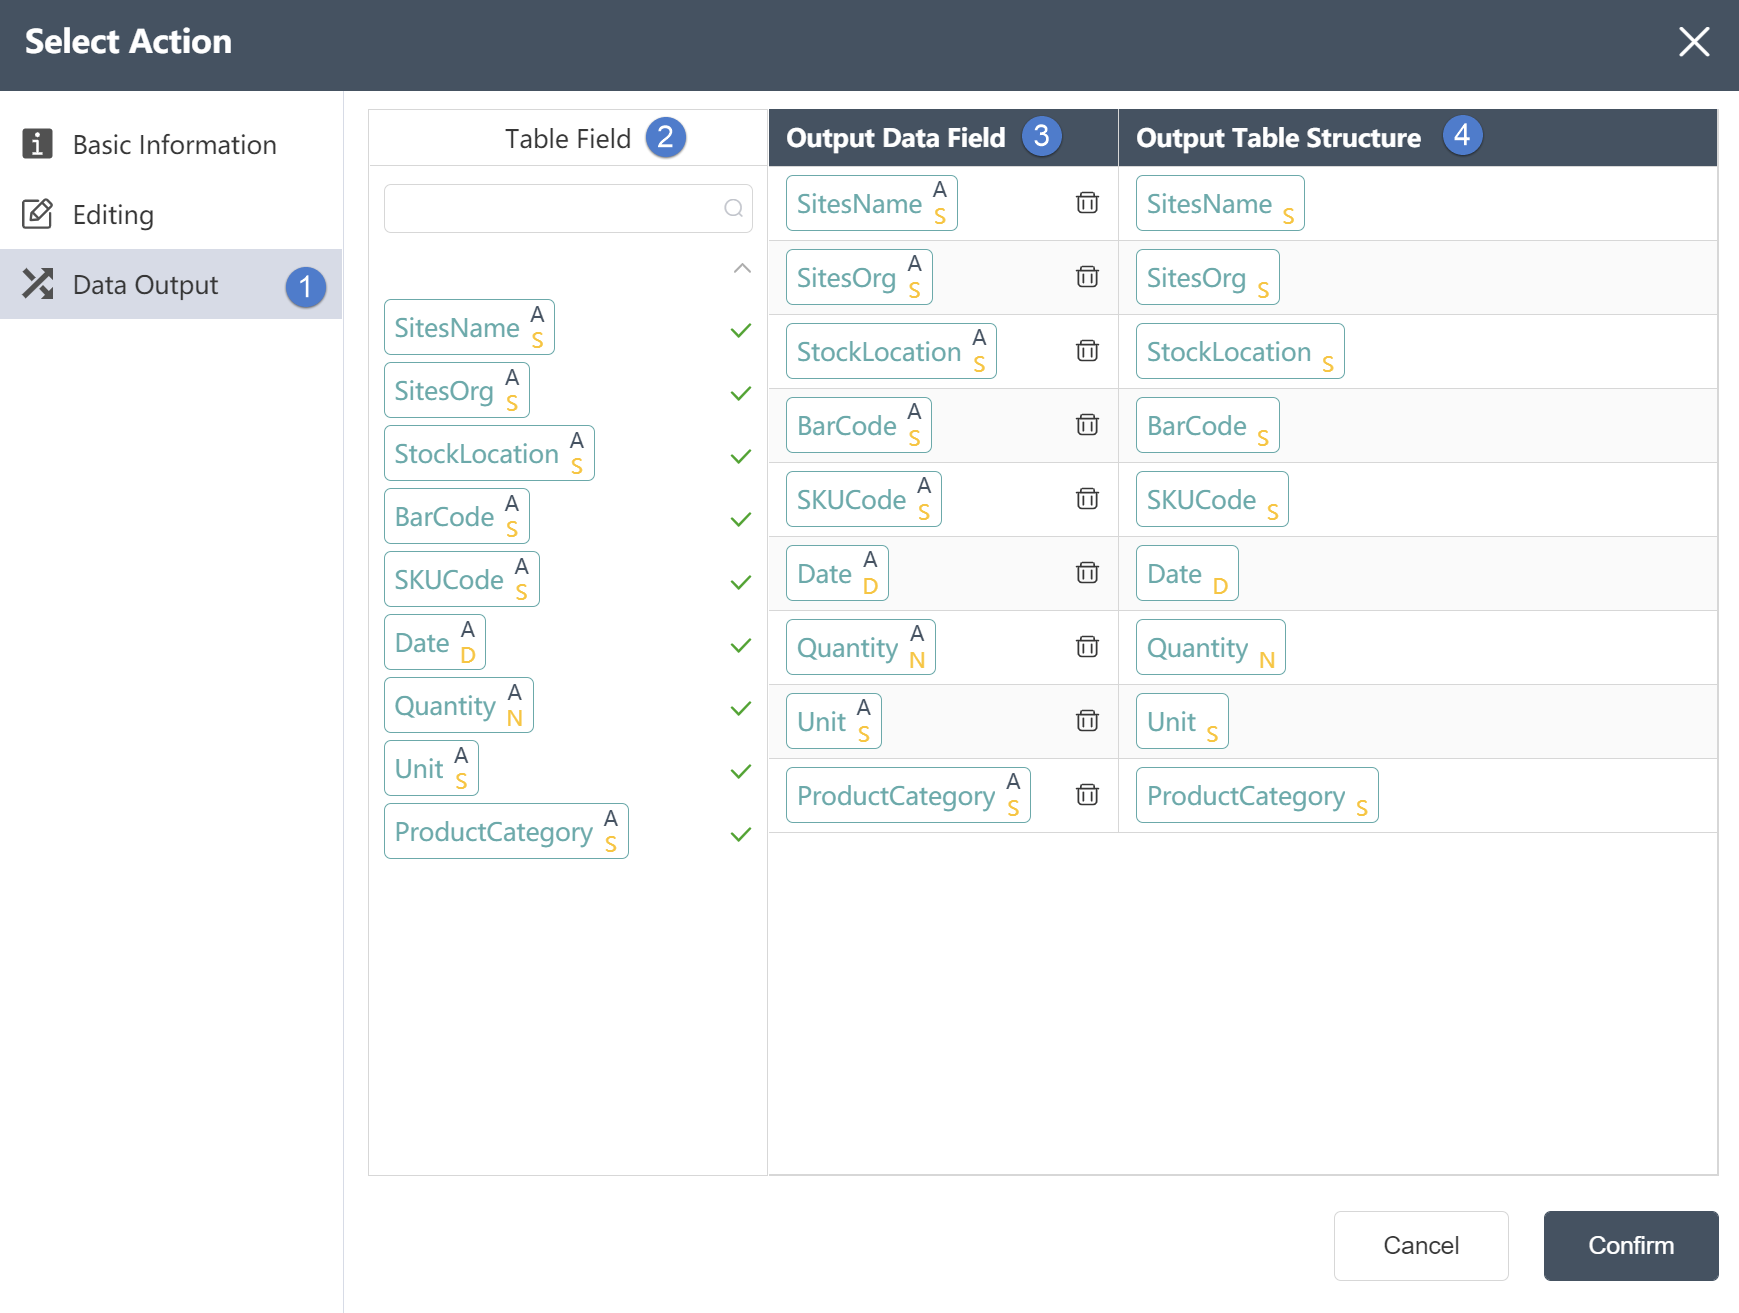
①In the data output tab
You can view the associated table fields.
②Table field: After editing the data, you can see the defined table field and field type in the data output tab.
③ Output data field: Display the column name and data type of the data in the source data table.
④Output table structure: Display the column name and data type of the data in the merged data.
# Table Union

# Node Function
Supports merging of multiple tables under the current node group; the result can be written to a new table, written to an existing table (optionally clear before writing), and generated views; the merge mode can be selected (whether to remove duplicates or not) ;Support to configure the writing relationship between result table fields and multiple input table fields; support to configure the type of output fields (including adding new fields).
Basic Information Tab
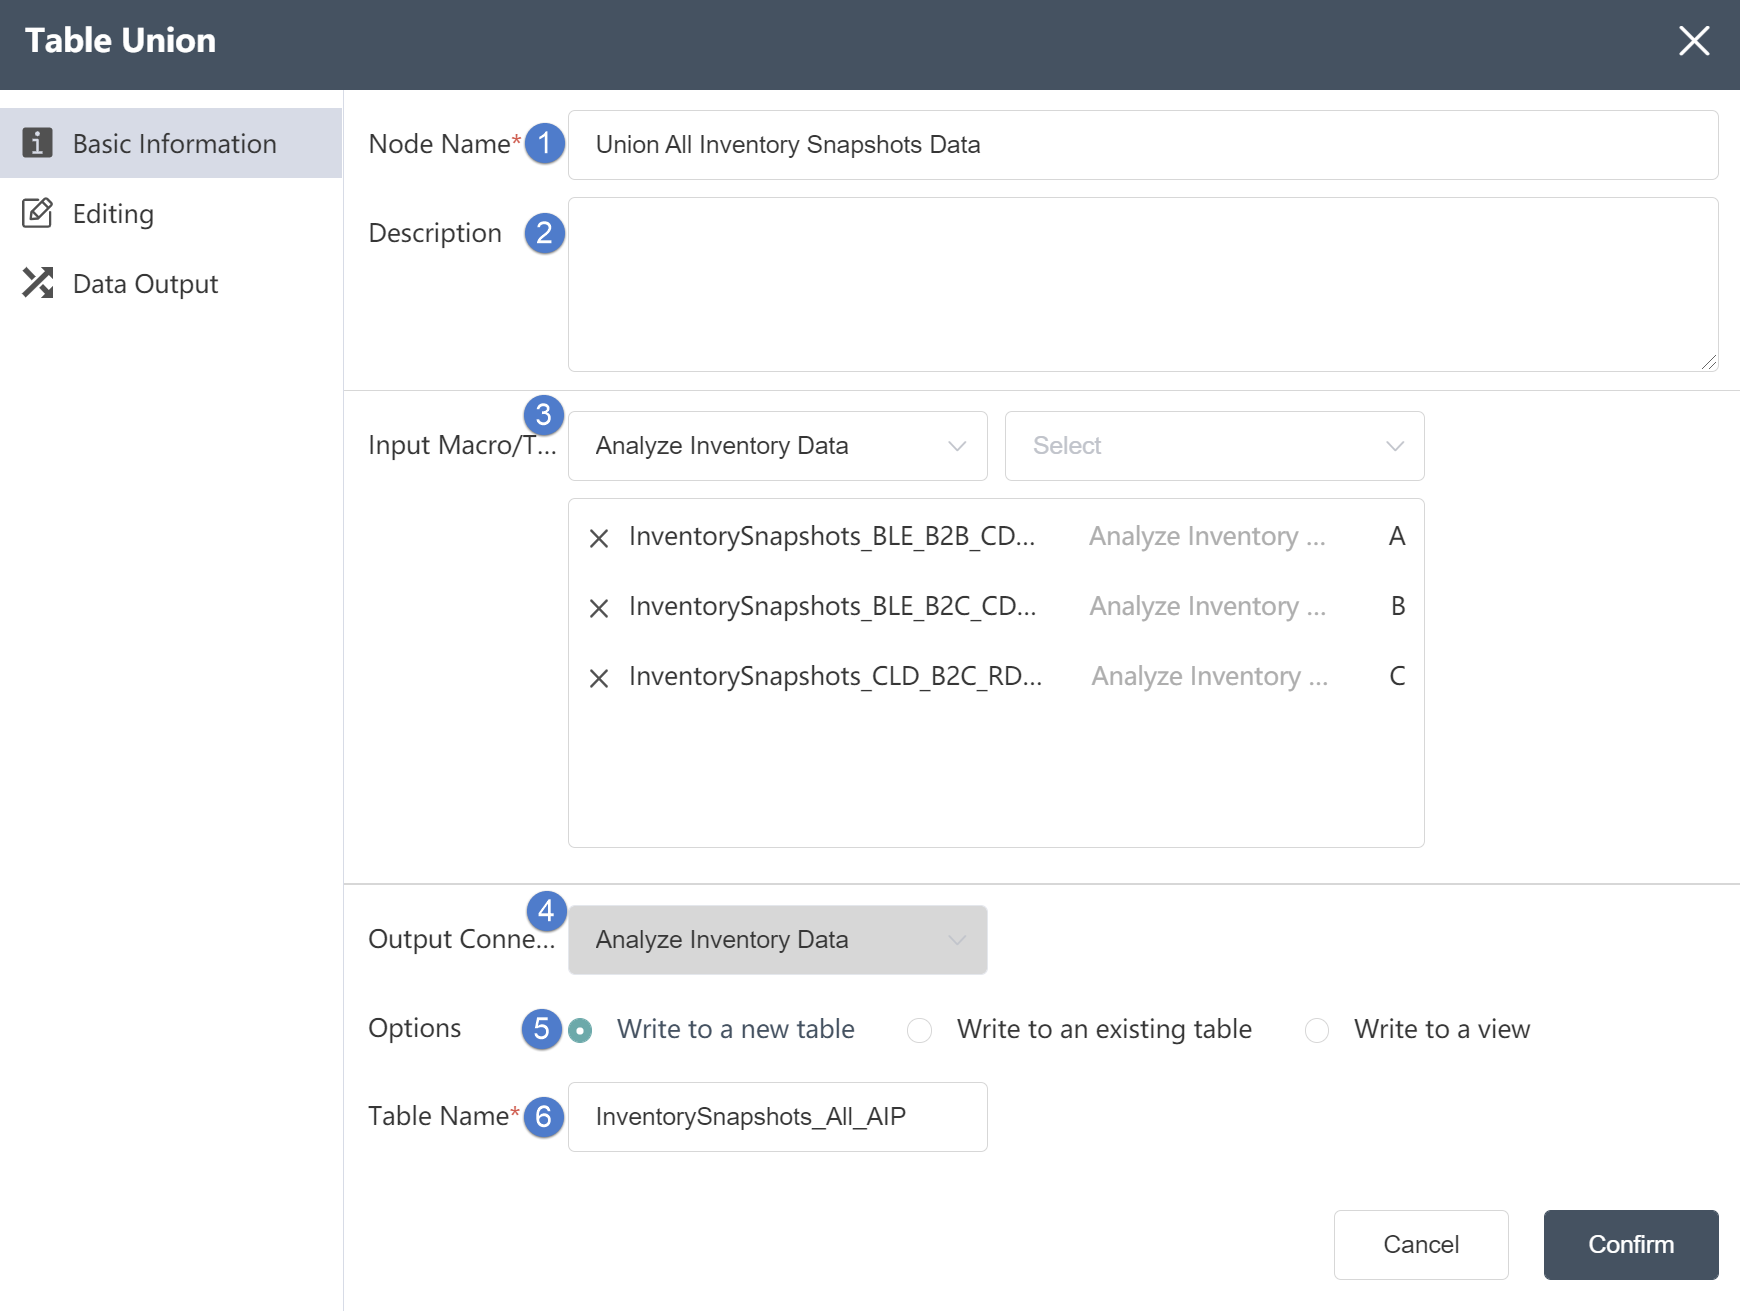
Basic Information tab: select to edit node basic information
①Node Name: Display the name on the canvas to mark the node.
②Node description: The custom description of the node function, displayed when the node information button is clicked on the canvas.
③ Input data: You can select multiple tables to be merged.
④ Output connection: cannot be changed
⑤Write mode: Three options are available. If you choose to write to a new table, a new table will be created to store the merged content; if you choose to write to an existing table, the merged content will be stored in the table.
⑥Table name: Make sure to select the corresponding table name contained in the connection database
Data Editing Tab
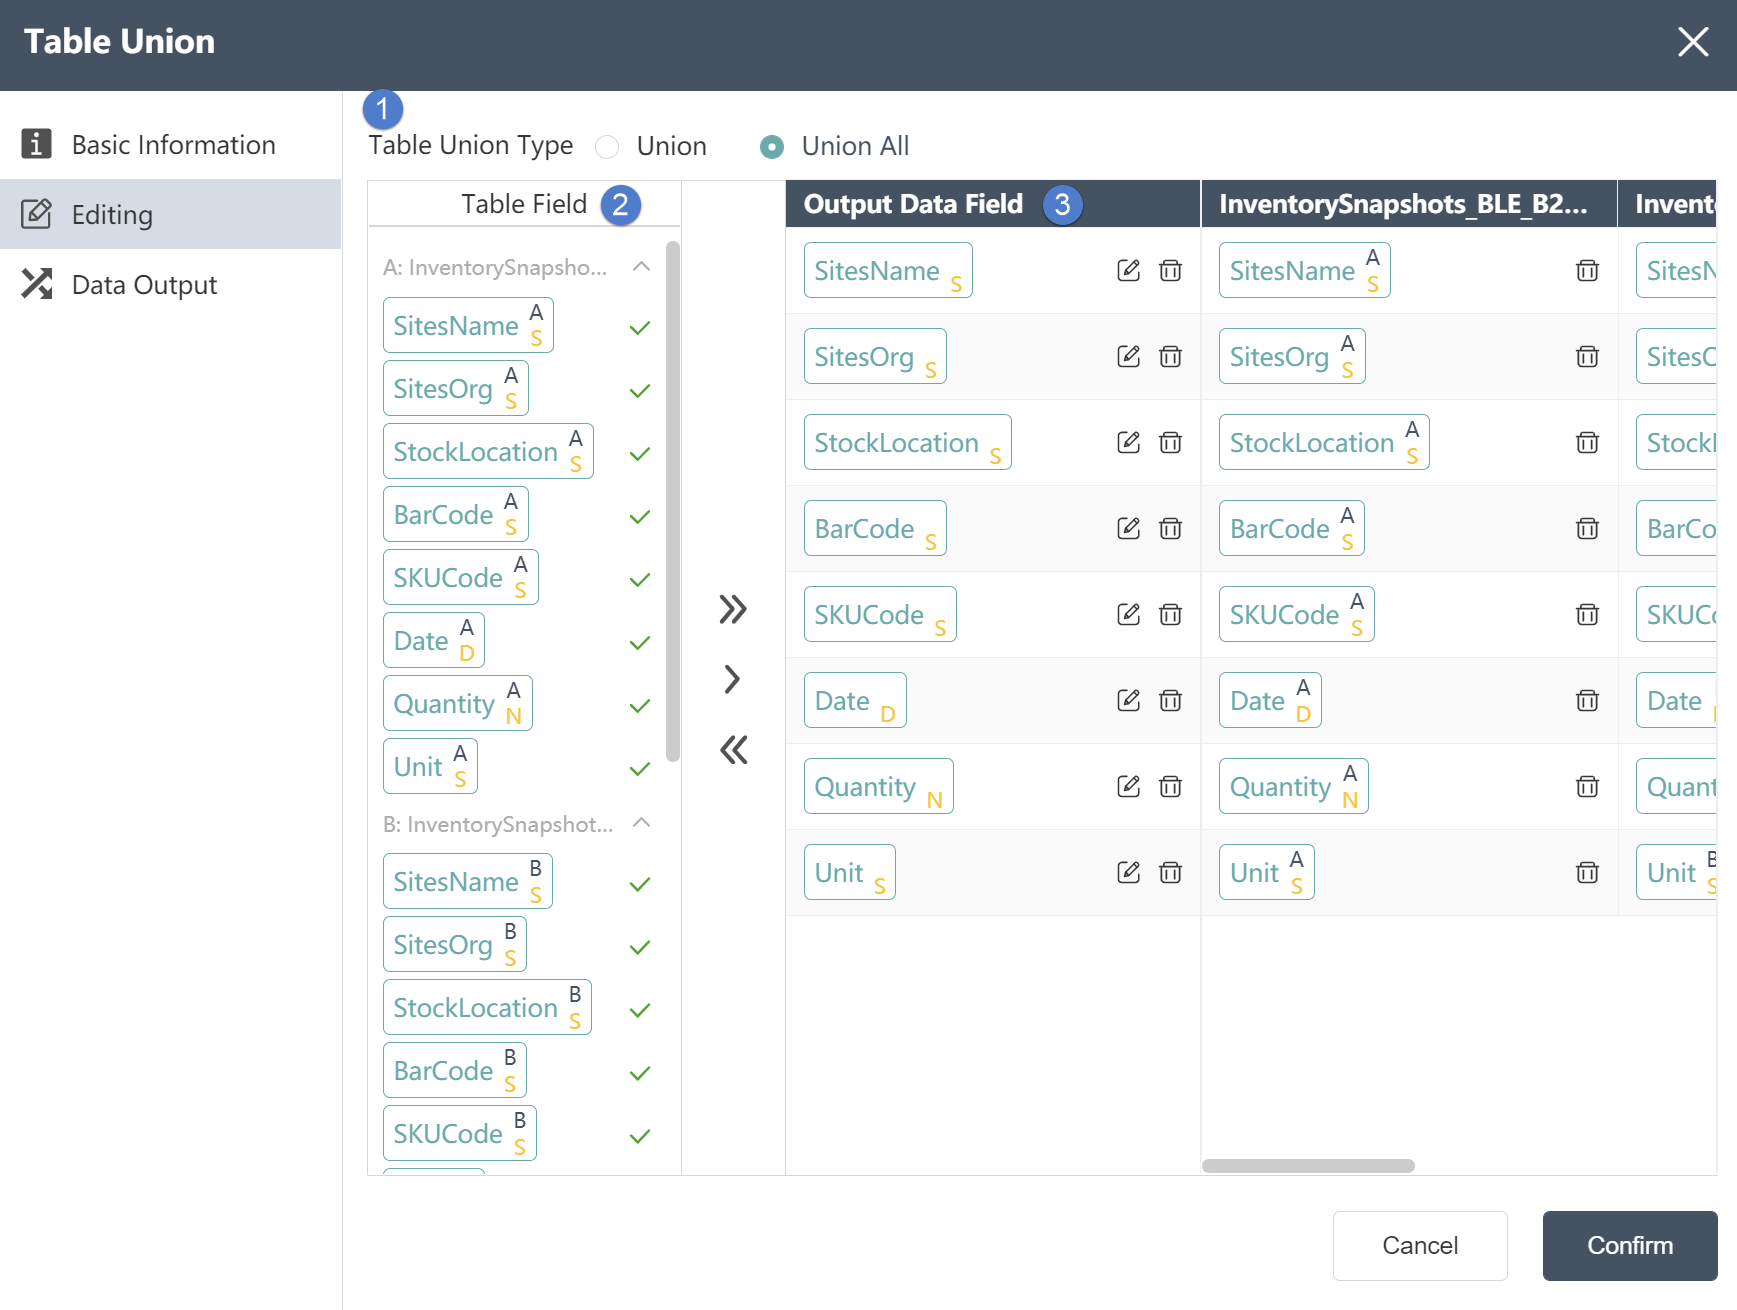
Data Editing Tab:
①Combination mode: Select Union, then duplicate values in multiple tables will be automatically removed when merging tables; Union all will retain duplicate values.
②Table field: In the table field, you can see the fields and field types contained in the table.
③Output data field: The content of the output data field can be customized through the button between the table field and the output data field, including the type of the field can be defined in the output data field.
Data Output Tab
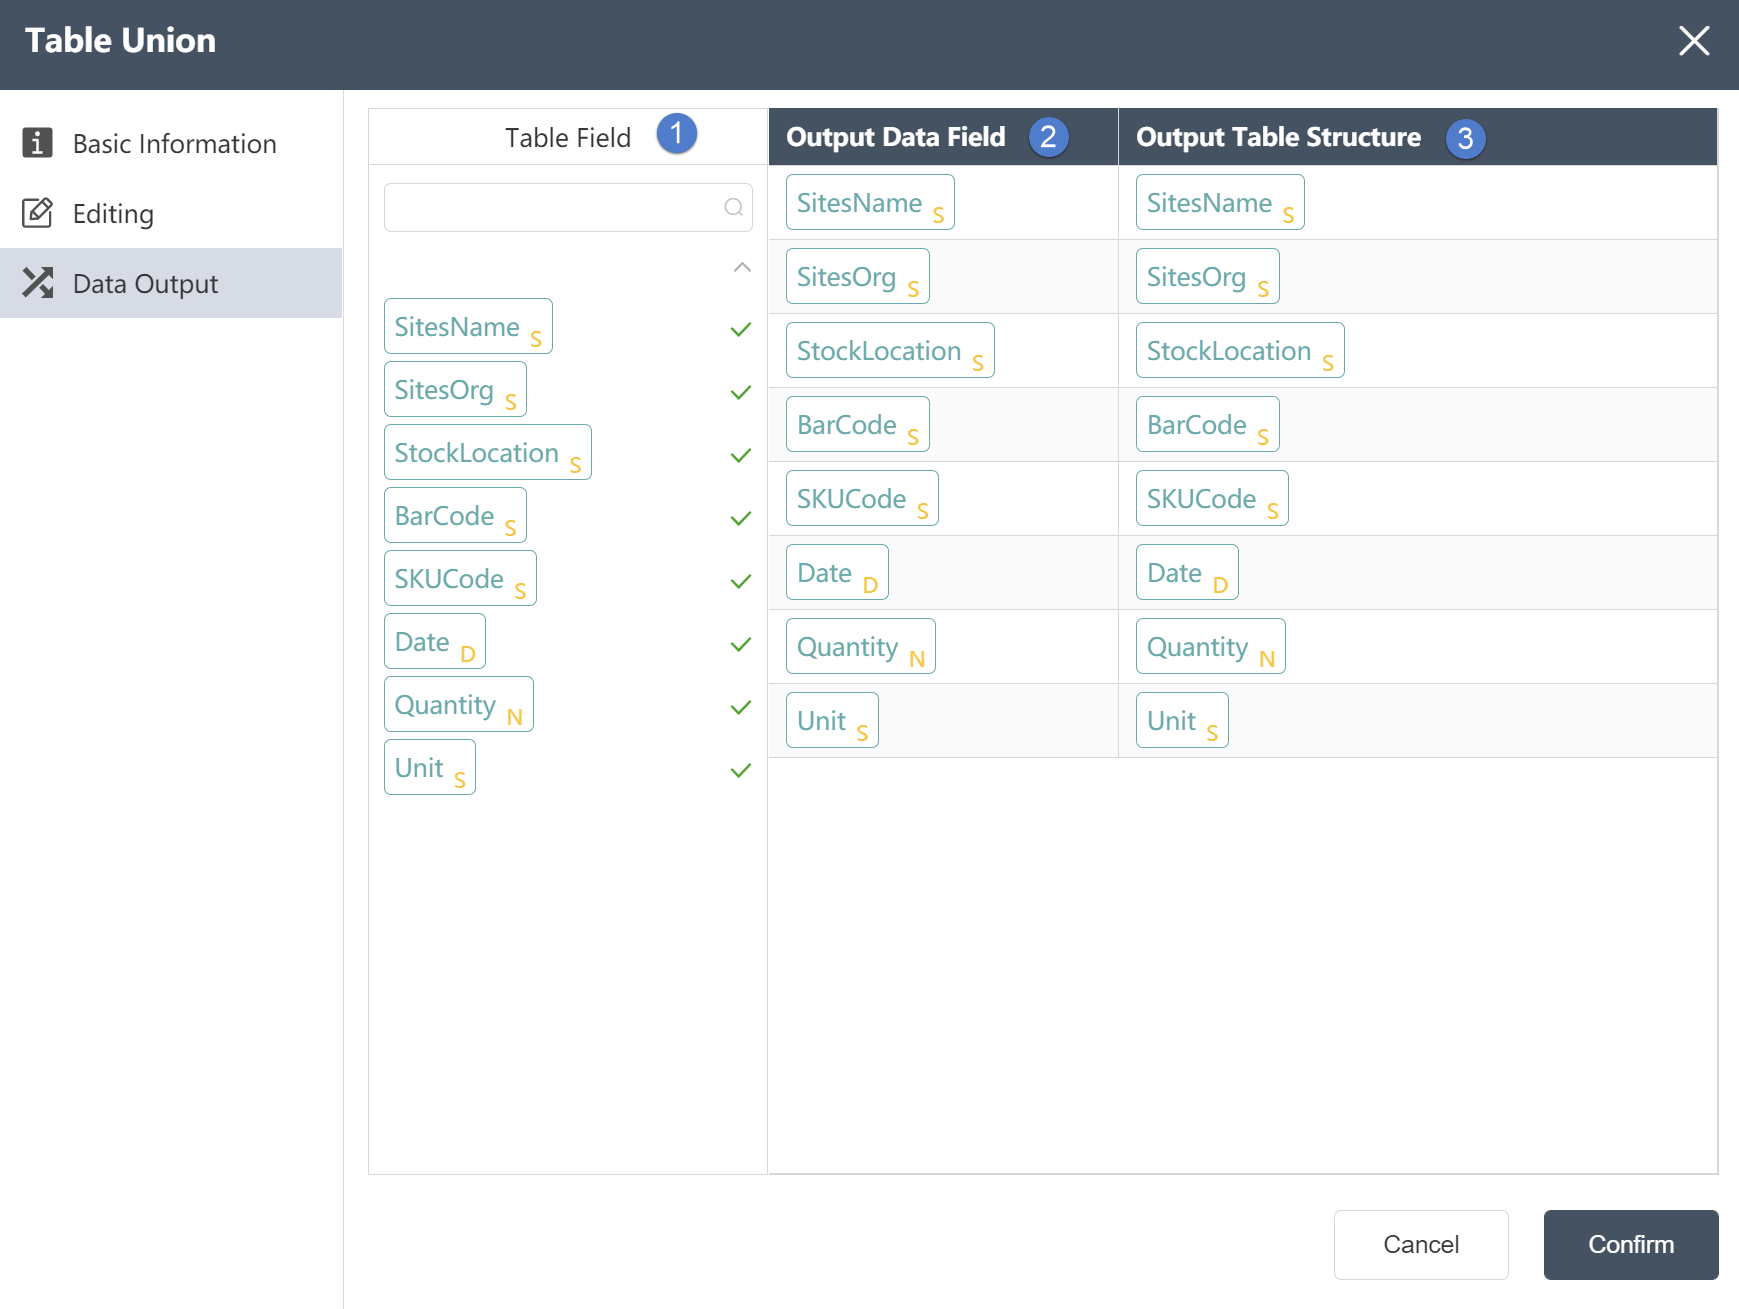
Data Output Tab:
①Table field: After editing the data, you can see the defined table field and field type in the data output tab.
②Output data field: Display the column name and data type of the data in the source data table.
③Output table structure: Display the column name and data type of the data in the merged data.
# Update Action

# Node Function
For the table under the current node group, update the value of the existing field or write the value of the new field; support field update of single-table or multi-table association (multi-table association supports inner association and left association); supports the input of complex expressions And operation; support target field filtering partial data update.
Basic Information Tab
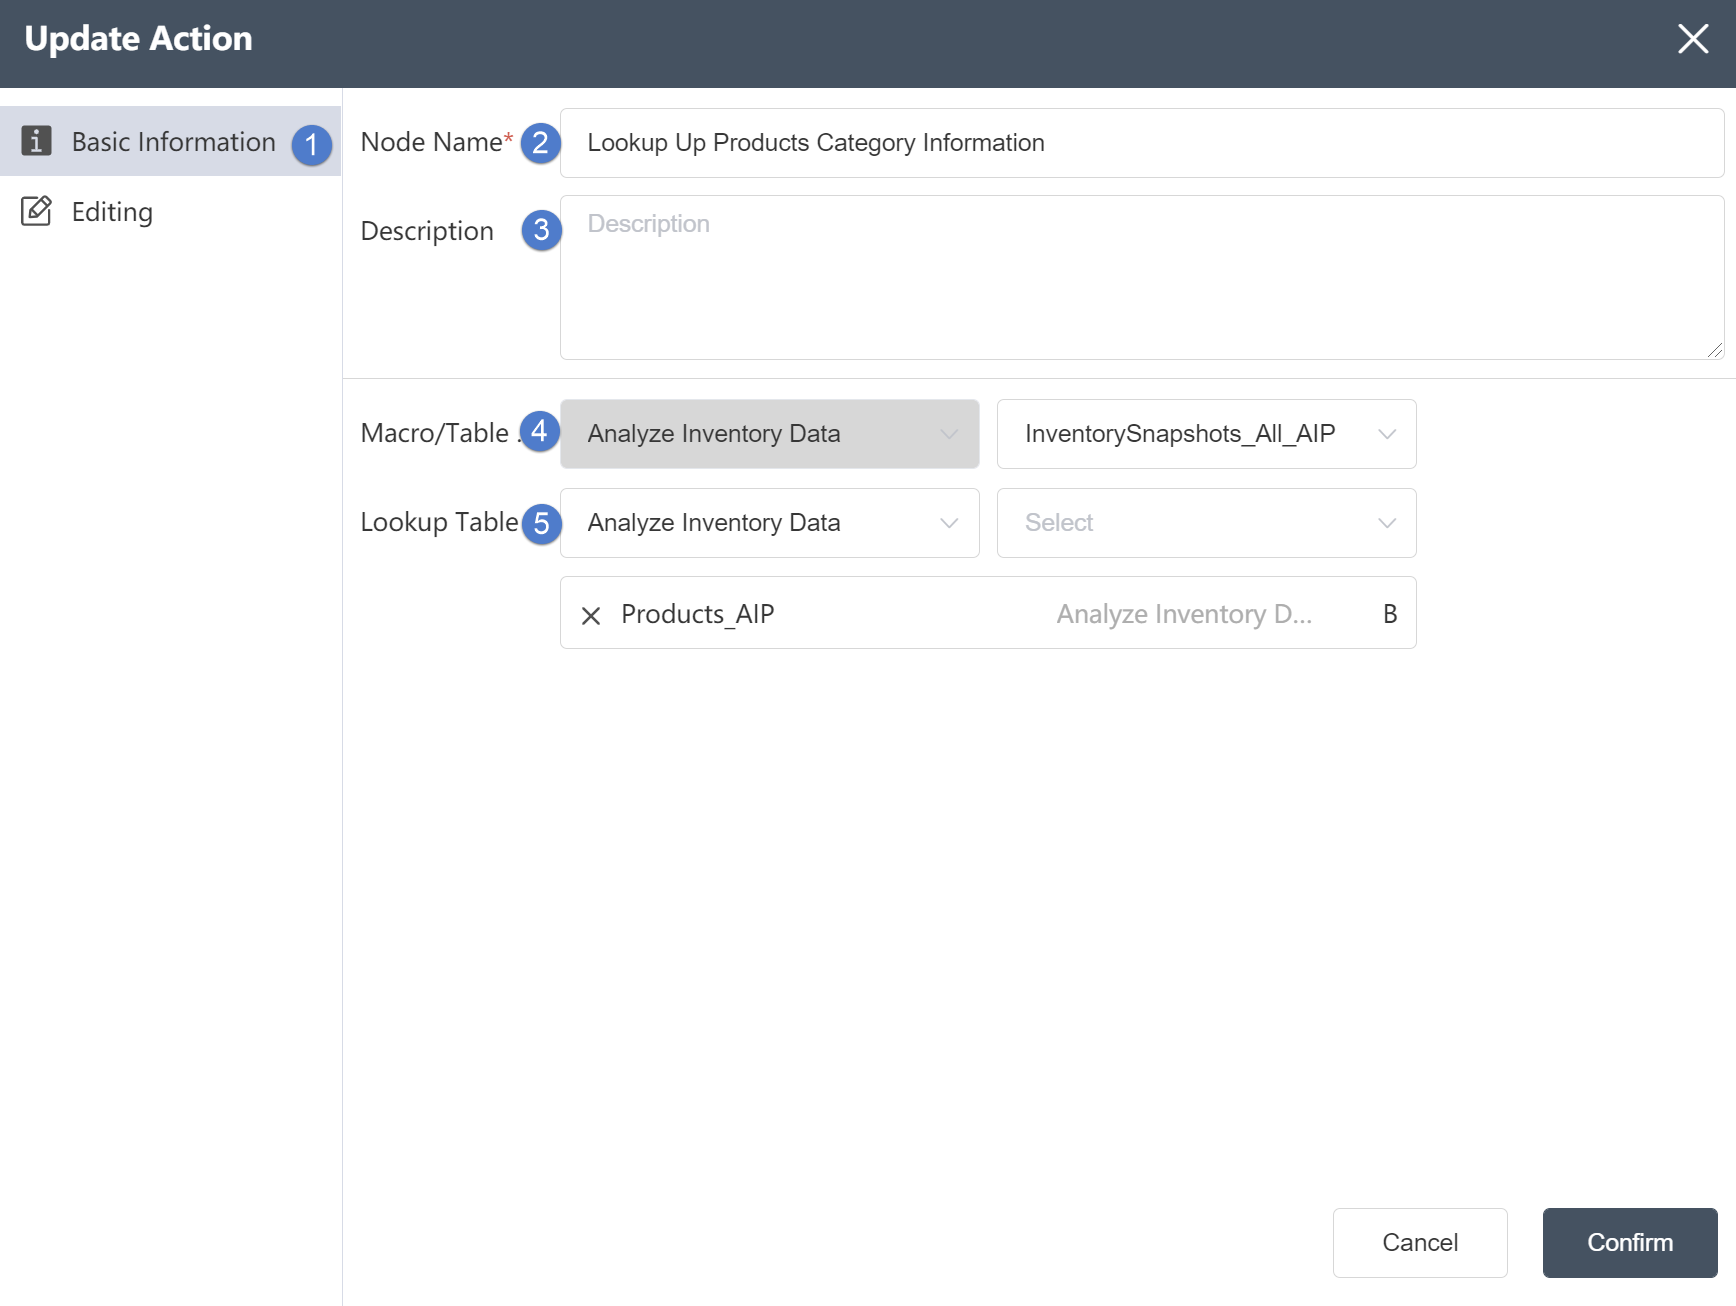
①Basic Information Tab: select this item to edit the basic information of the node
②Node name: Display the name of the node on the canvas.
③Node description: The custom description of the node function, displayed when the node information button is clicked on the canvas.
④Target data: Determine the data source of the node, the target data is the main table, and the data column will be updated on the basis of this table later.
⑤Reference table: The reference table is the table to be associated. After setting the associated data, you can select data update in the reference table.
Data Editing Tab
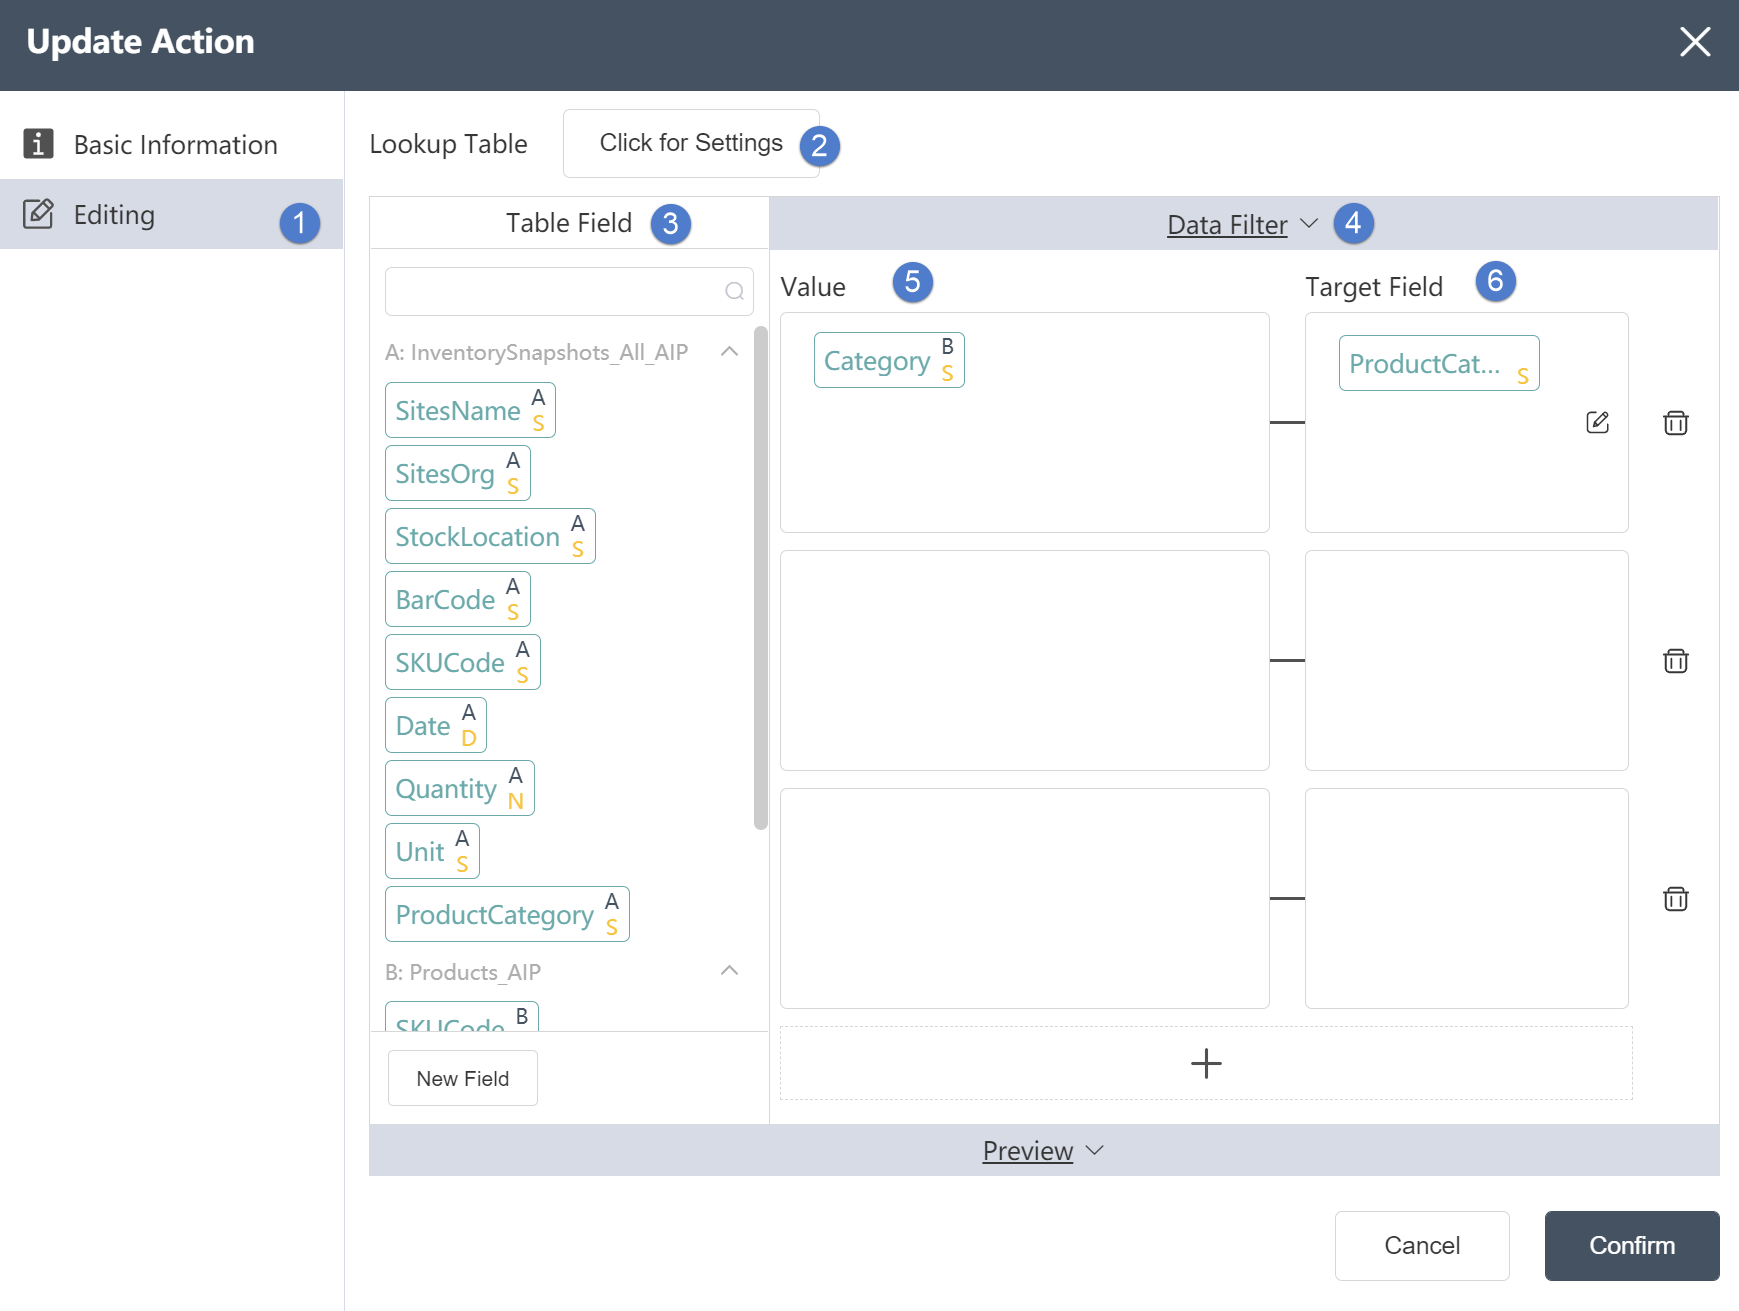
Data Editing Tab:
①In the data editing tab
The merged table fields can be edited.
②Reference table: In the reference table setting, you can select the association relationship and edit the associated key values in the two tables. But you can only select the intersection of the target table and the reference table or take all the rows of the target table.
④Table field: After editing the data, you can see the defined table field and field type in the data output tab.
⑤Assignment: Support selecting a column of data from the reference table as the update column in the target table.
⑥Target field: You can edit the data type and field name of the field if it is a new field.
⑦New field: You can directly drag and drop it as a new field to the target field.
# Weighted Average

# Node Function
Supports the weighted average calculation of the tables under the current node group. Multiply each value by the corresponding weight, then add and sum to get the overall value, then divide by the total number of units.
Basic Information Tab
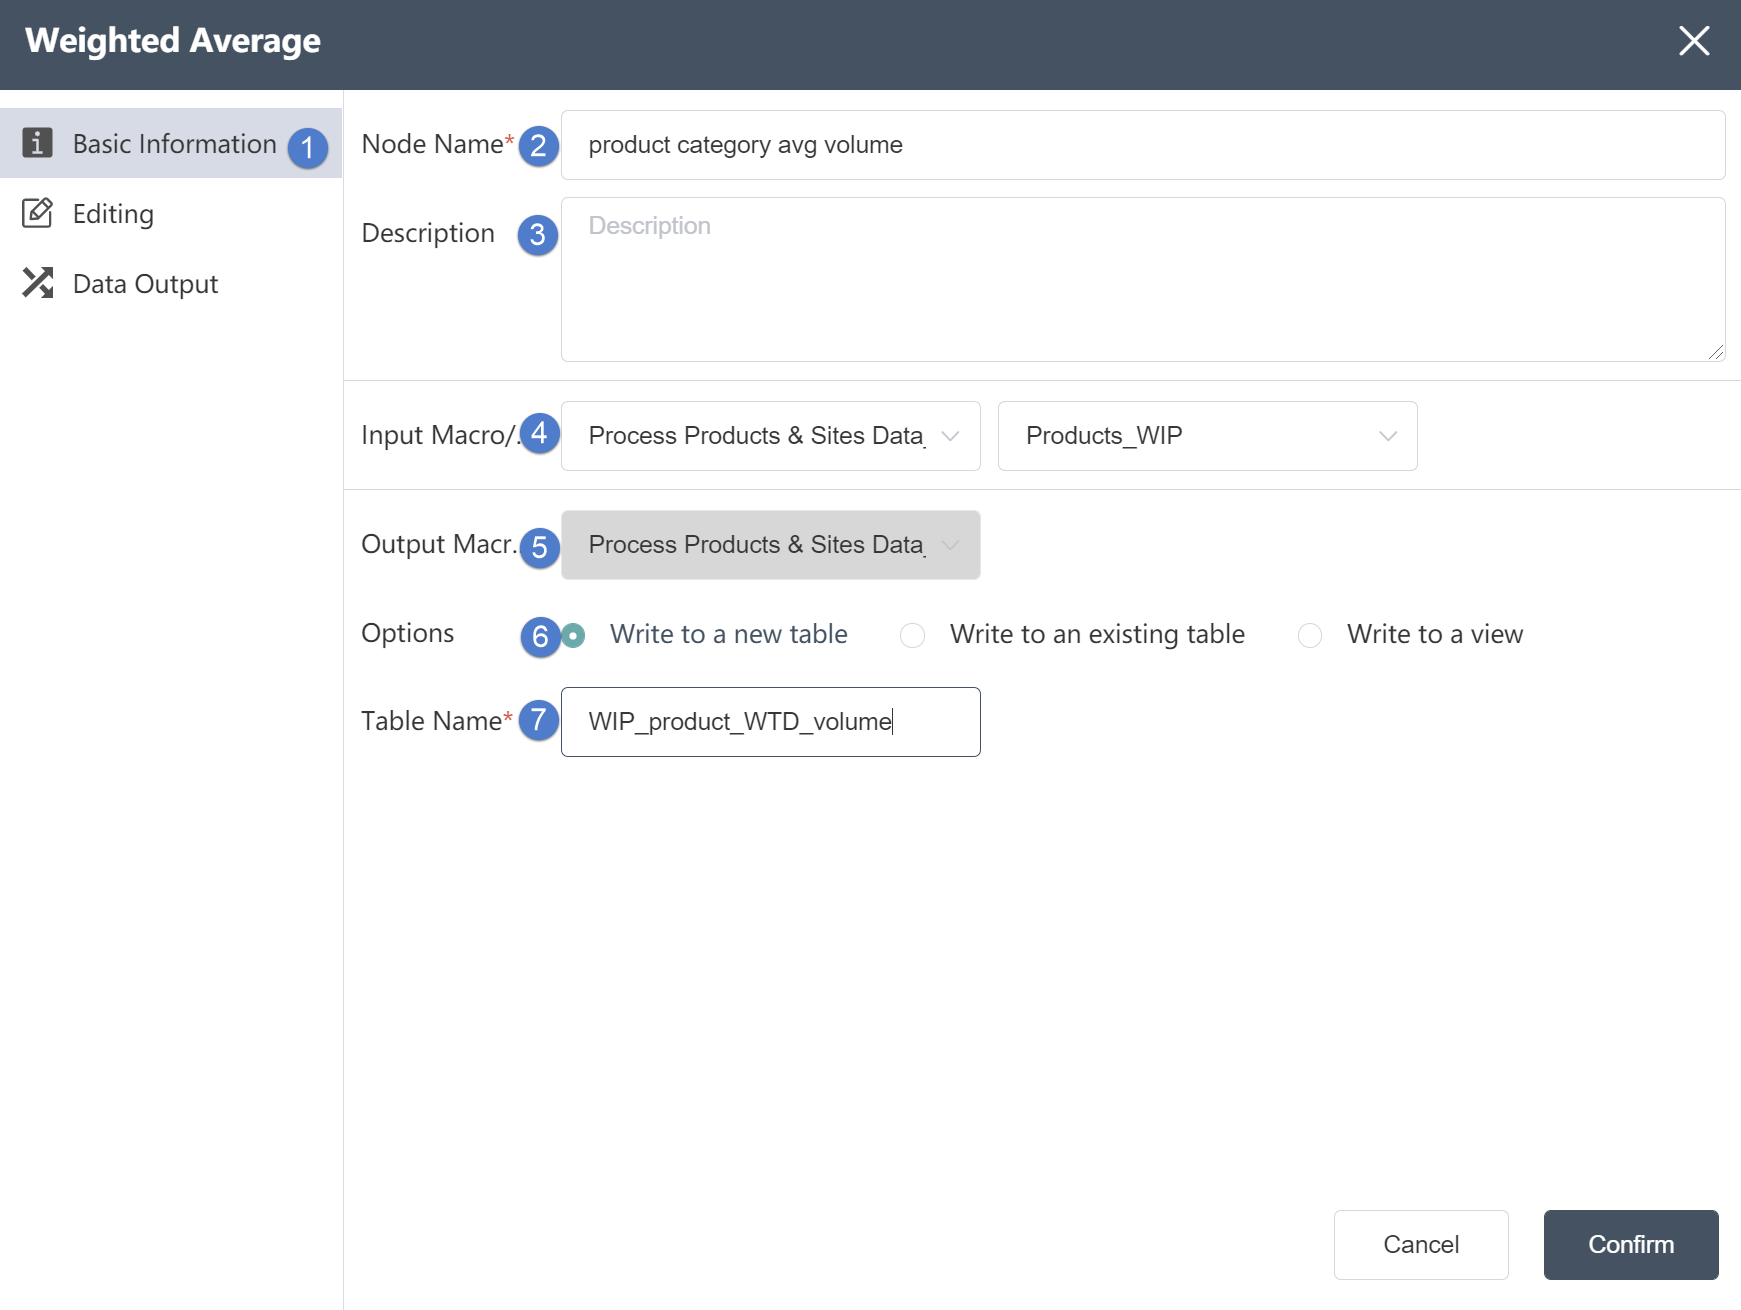
①Basic Information Tab: select this item to edit the basic information of the node
②Node name: Display the name of the node on the canvas.
③Node description: The custom description of the node function, displayed when the node information button is clicked on the canvas.
④ Input connection: Determine the source of node data, you can select the data source of the Excel connection node in the same node group.
⑤ Output connection: not selectable, the default is the temporary database of the current node.
⑥Write mode: write new table by default
⑦Table name: The table name of the data output, the default value is the same as the input sheet name. It can be a new table, but it cannot be an existing table in the current database. When the table already exists, it will prompt "Duplicate table name".
Data Editing Tab
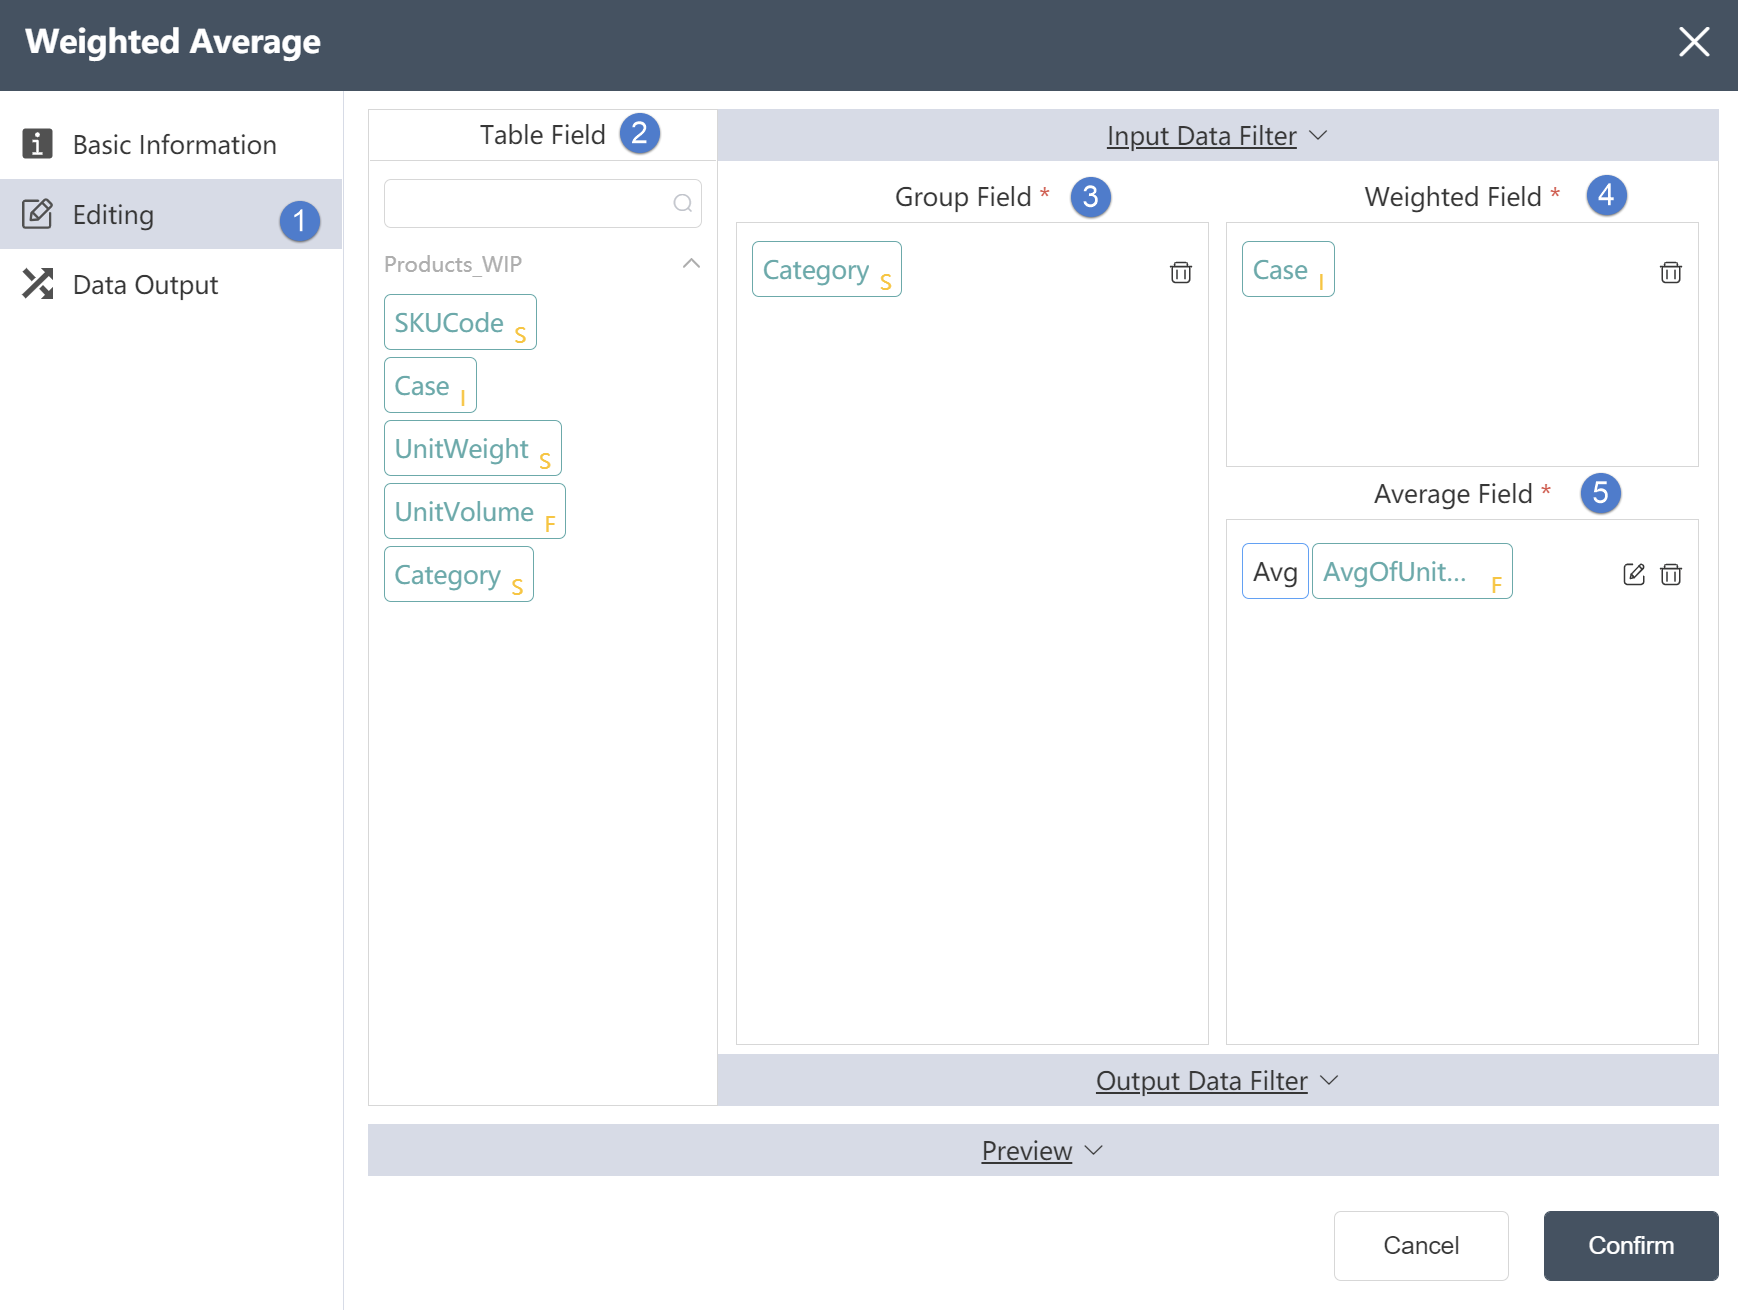
Data Editing Tab:
①Data editing: You can edit the data conditions and edit the results of the output table on this interface.
②Table Fields: After editing the data, you can see the defined table fields and types in the Data Output tab.
③ Grouping field: Select the corresponding grouping field in the table field, and on this basis, the grouping of the weighted average calculation can be realized.
④ Weight field: Select the corresponding weight field in the table field, and the weight of the weighted average calculation can be realized on this basis.
⑤Average field: Select the corresponding weight field in the table field, and the average of the weighted average calculation can be realized on this basis.
Data Output Tab
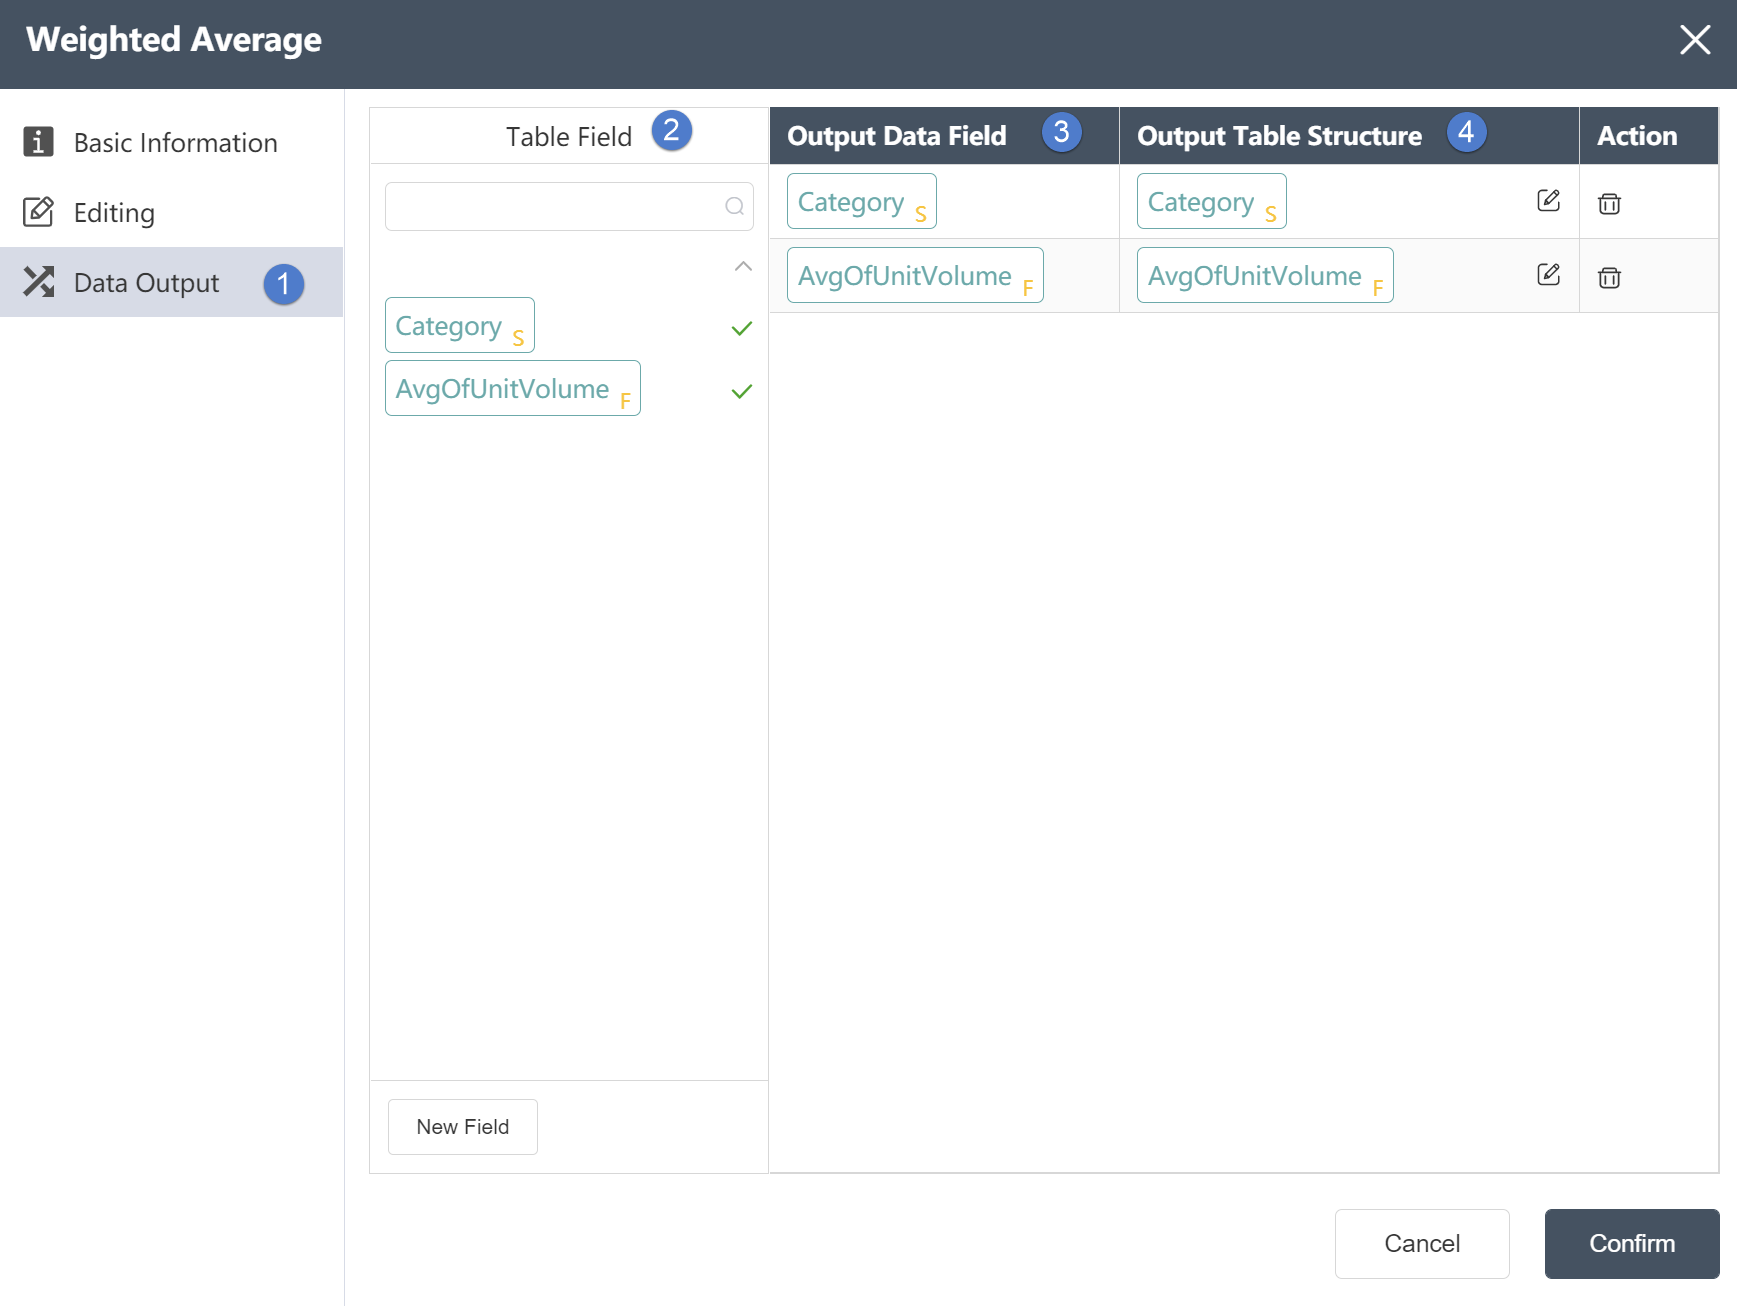
Data Output Tab:
①Data output: After data editing, you can see the defined table fields and field types in the data output tab.
②Table field: After editing the data, you can see the defined table field and field type in the data output tab.
③ Output data field: Display the column name and data type of the data in the source data table.
④Output table structure: Display the column name and data type of the data in the merged data.
# Data Profiling

# Node Function
Quickly implement statistical analysis of multiple field values in the table under the current node group; support analysis of one or more fields in the target table. Analysis items include: Field Name, Field Position, Field Type, Unique Value, Numeric Style, Blank Rows, Null Rows, Non-Null Rows, Alpha-only Rows, Numeric-Only Rows, and Alpha-Numeric Only Number of lines, number of lines with special characters, number of lines with spaces in front, number of lines with spaces after, most value, minimum value, maximum value, minimum length, maximum length
Basic Information Tab
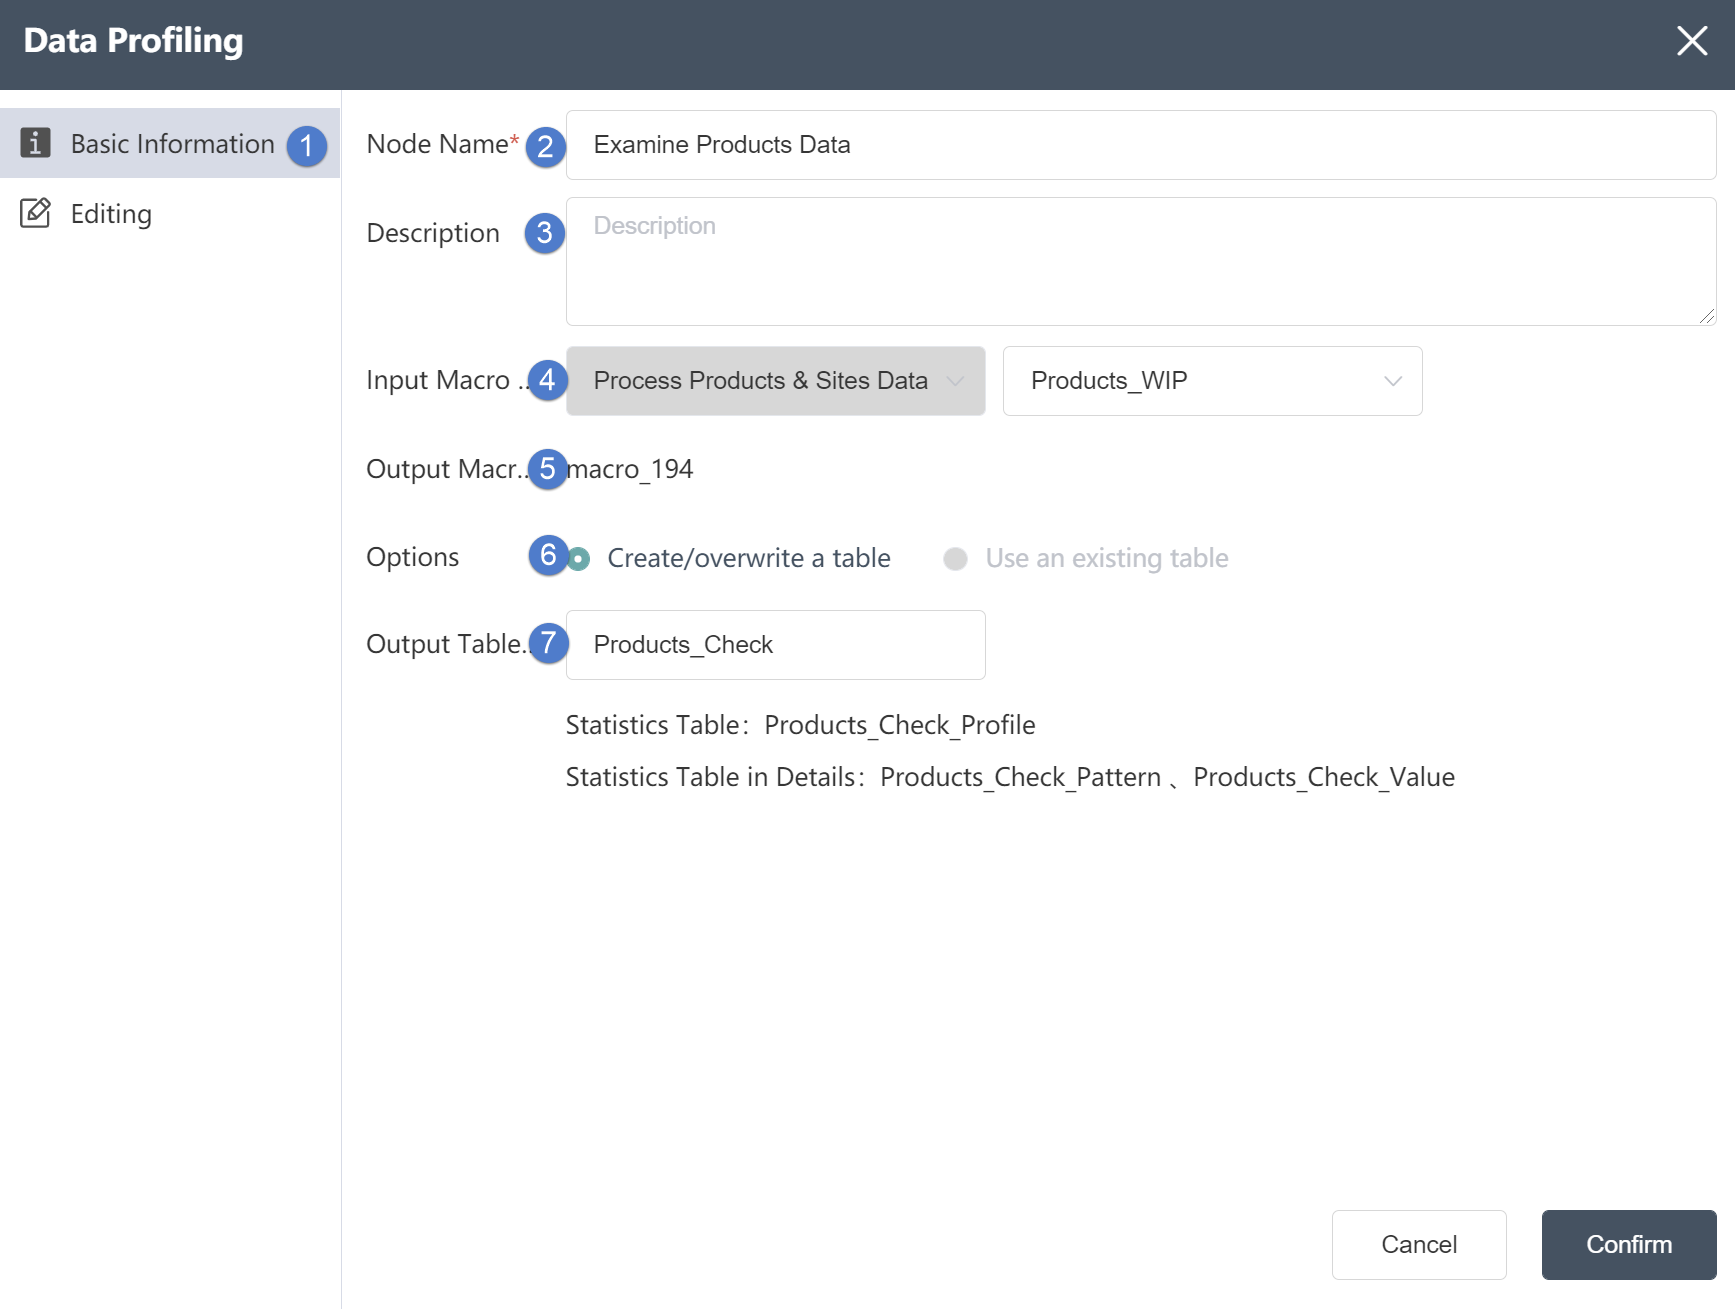
①Basic Information Tab: select this item to edit the basic information of the node
②Node name: Display the name of the node on the canvas.
③Node description: The custom description of the node function, displayed when the node information button is clicked on the canvas.
④ Input connection: Determine the source of node data, you can select the data source of the Excel connection node in the same node group.
⑤ Output connection: not selectable, the default is the temporary database of the current node.
⑥Write mode: write new table by default
⑦Table name: The table name of the data output, the default value is the same as the input sheet name. It can be a new table, but it cannot be an existing table in the current database. When the table already exists, it will prompt "Duplicate table name".
Data Analysis Tab
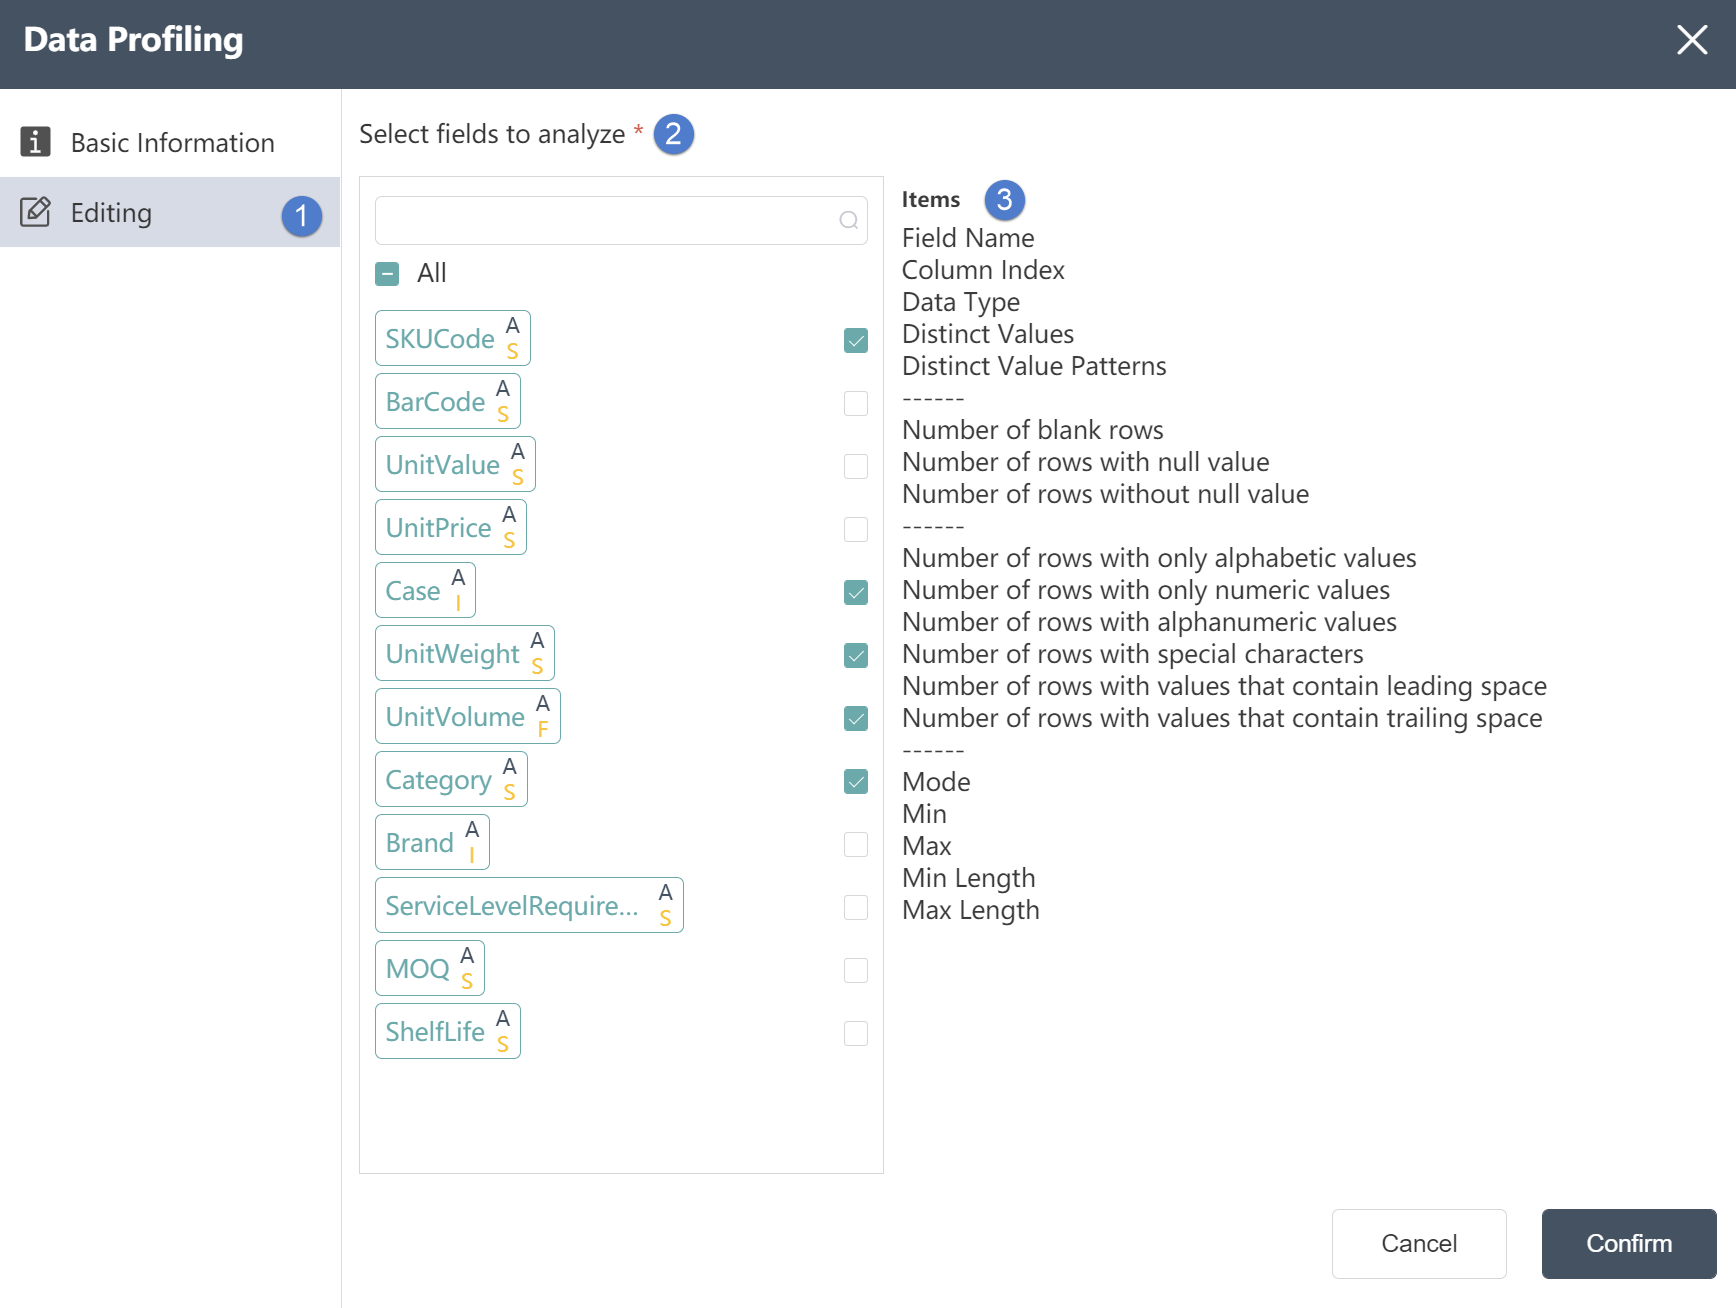
Data Editing Tab:
①In the data editing tab, you can select the corresponding field.
②Select analysis fields: By selecting analysis fields, all imported fields can be selected arbitrarily. After selecting the corresponding fields, these analysis fields can be operated.
③The analysis items are as follows: The analysis items will display the analysis of these fields, such as field name, field location, field type, unique value, numeric style, number of blank lines, number of null lines, number of non-null value lines, number of lines containing only letters , Number of lines with numbers only, Number of lines with letters or numbers only, Number of lines with special characters, Number of lines with spaces before, Number of lines with spaces after, Most number of occurrences, Minimum value, Maximum value, Minimum length, Maximum length.
Output table:
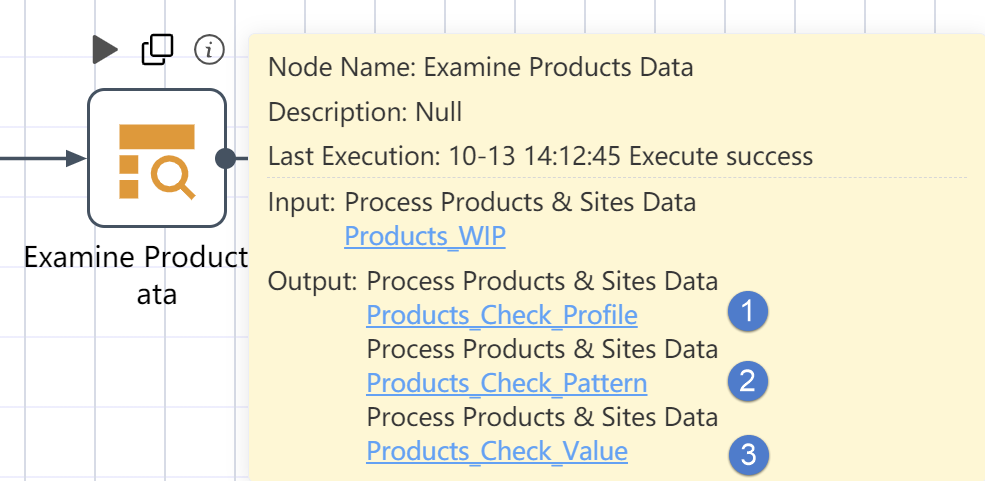
Click ⓘ in the upper right corner of the node to view the results of the output table. There are three tables in total. The name of the table is composed of the original table + Profile/ Pattern/_Value as a suffix.
Profile, field analysis table, the statistical items are as follows:
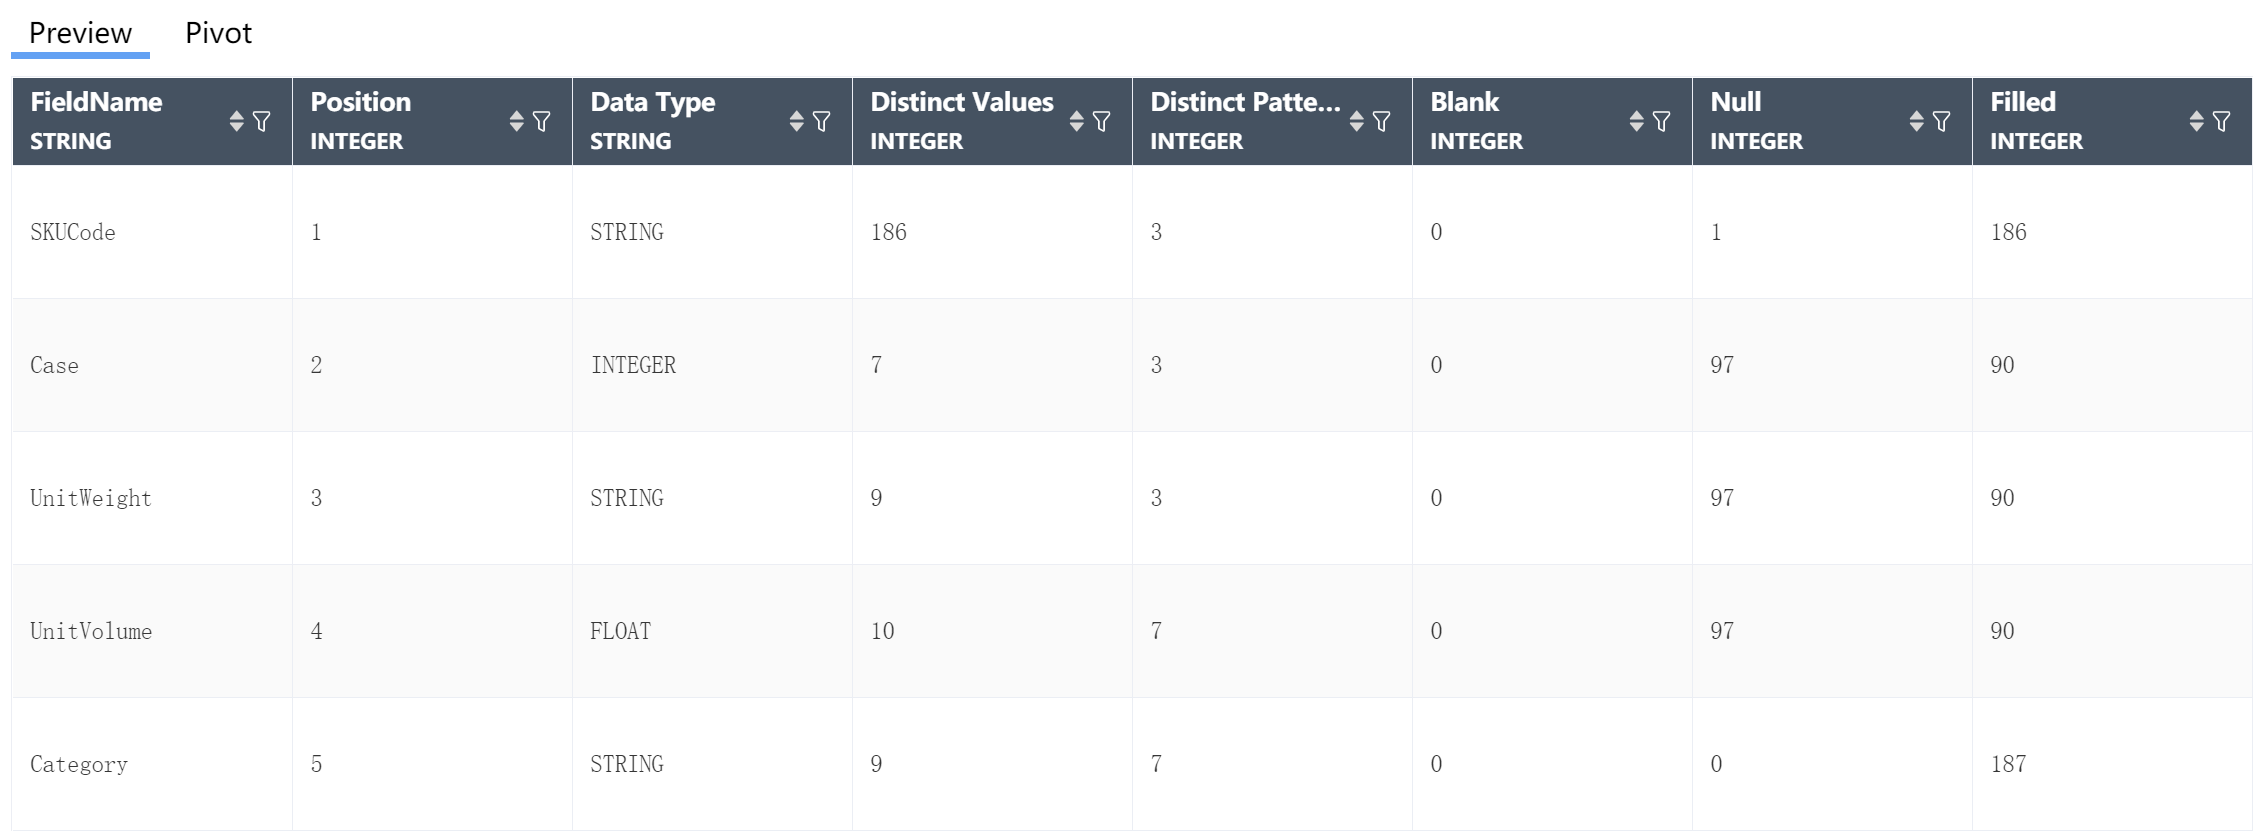
Field Name: field name
Postion: which column of the target table the field is in
DataType: field type
Distinct Values: The field has several distinct values
Distinct Patterns: Field values have several formats
Blank: number of blank lines
Null: Null row count
Filled: the number of rows with values
Letters: Number of lines of data containing only letters
Numbers: the number of lines containing only numbers
Alphanumeric: Number of lines containing only letters or numbers
Special Characters: The number of lines with special characters
Leading Spaces: Number of rows of data preceded by spaces
Trailing Spaces: Number of data lines with trailing spaces
Mode: The most frequent data value in the field
Min: minimum value, only for numbers, dates, not including null values
Max: maximum value, only for numbers, dates, not including null values
LengthMin: minimum length of data
LengthMax: maximum length of data
Pattern, the statistical details of the selected field, the statistical items are as follows:
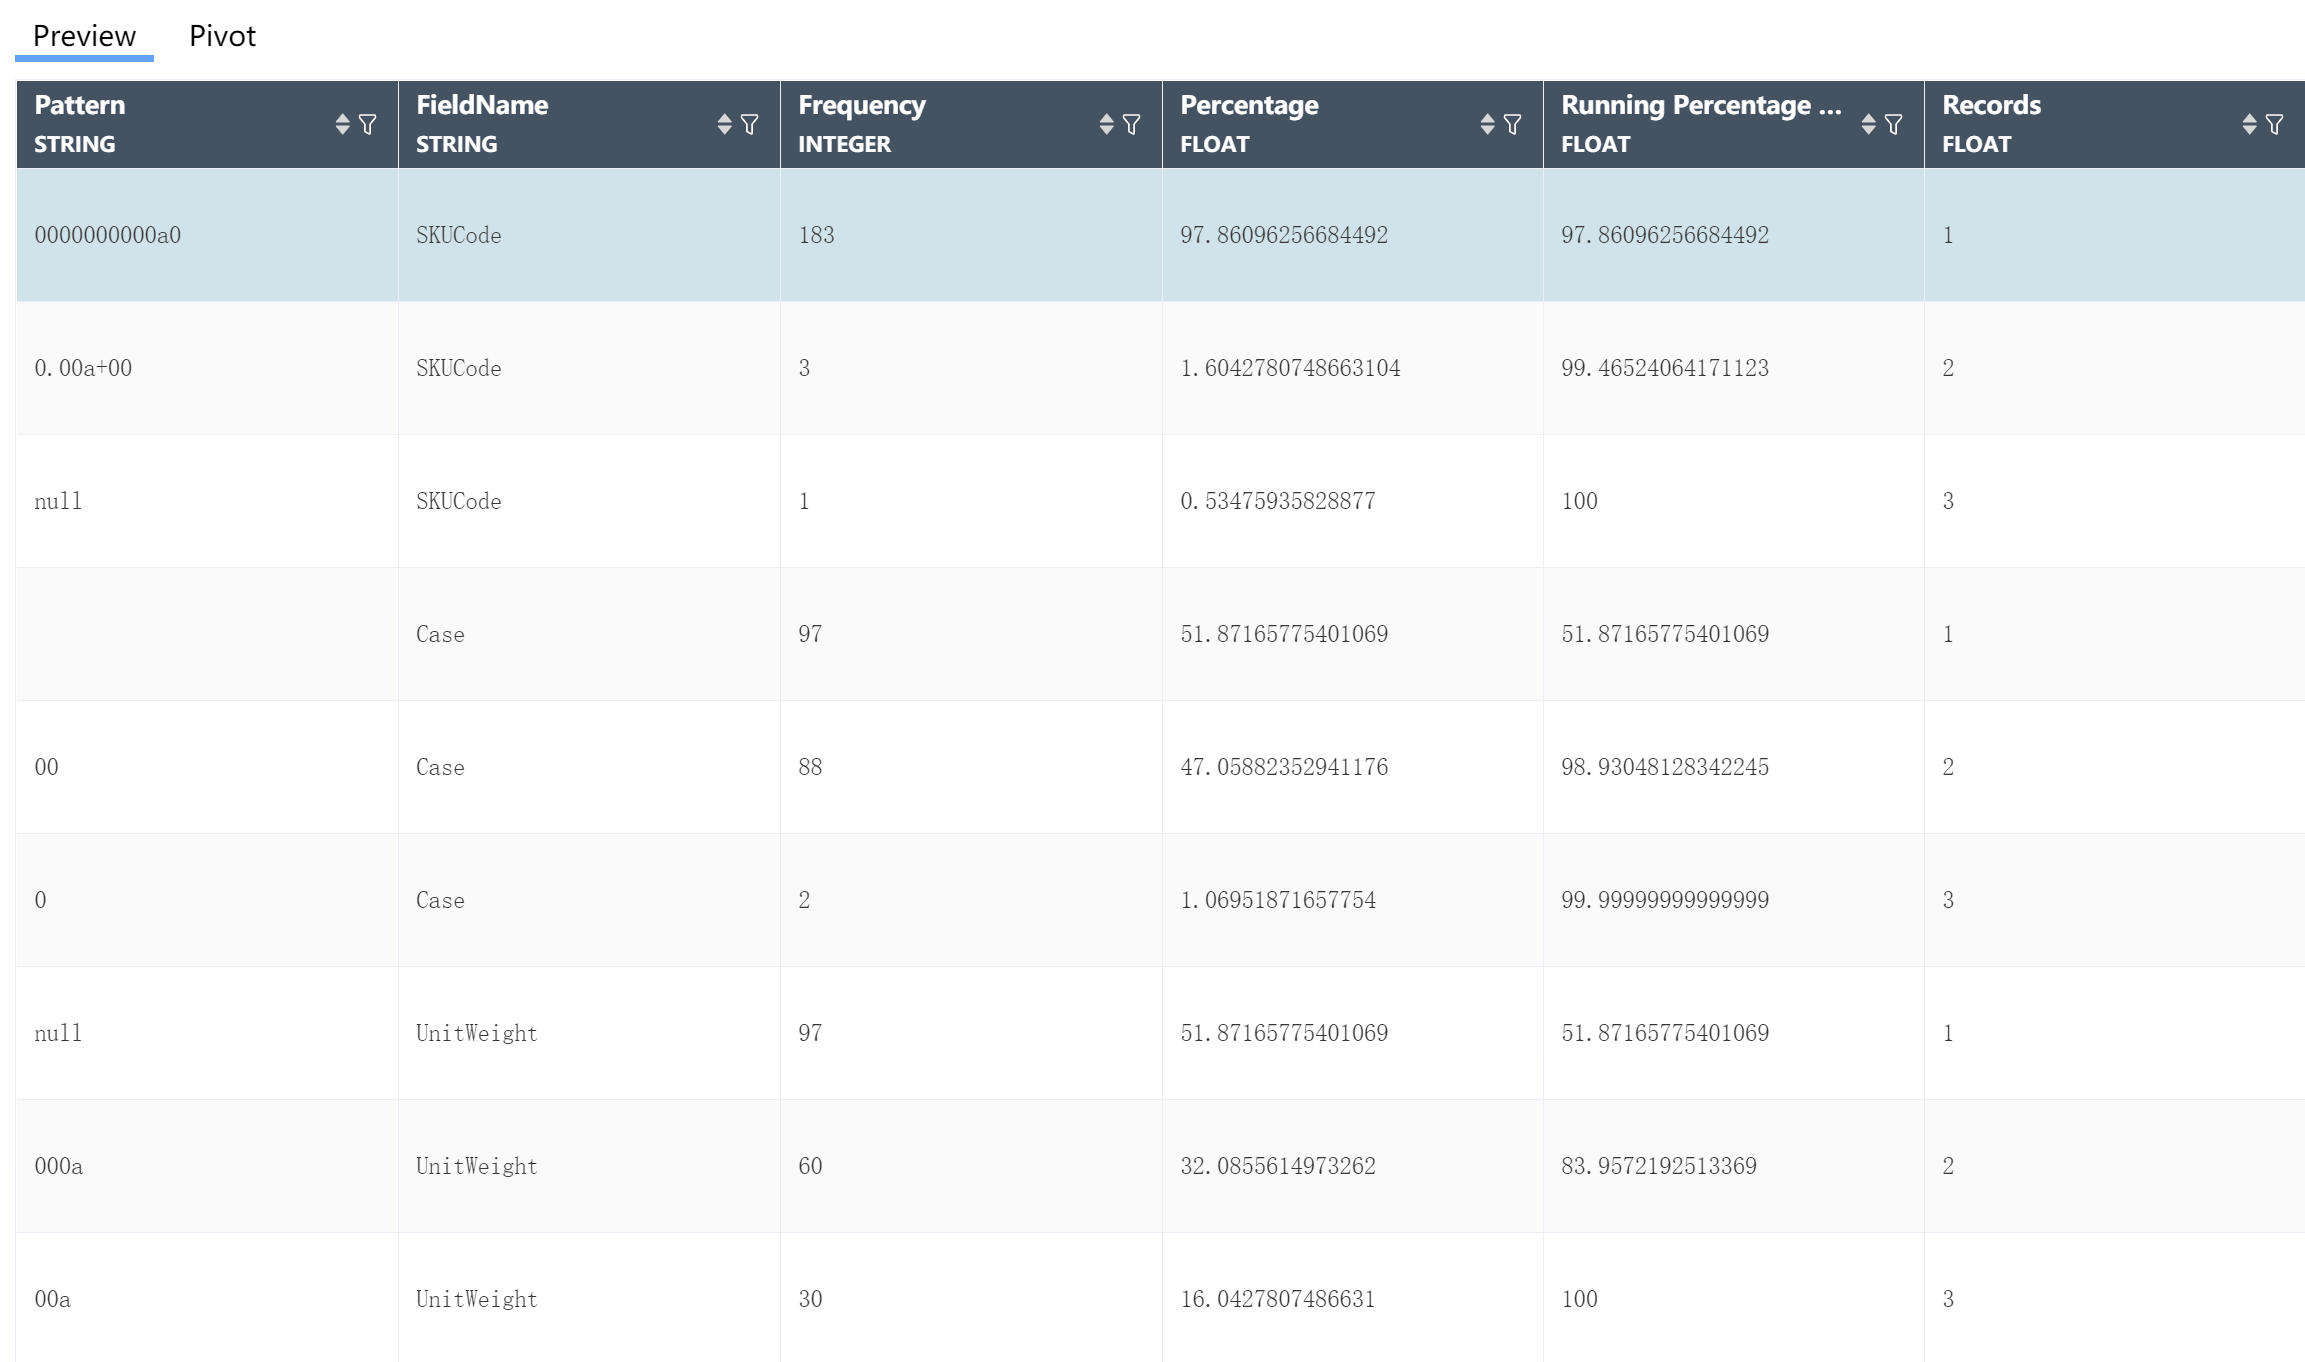
Pattern: Displays the field value format of the selected field, such as: three letters, two digits, etc.
FieldName: The name of the selected field.
Frequency: The number of lines in the field value format for the selected field.
Percentage: The percentage of the selected field's value format.
Running Percentage of Total: The cumulative percentage of the selected field in the value format of this field.
Records: The cumulative ranking of the field value format of the selected field.
Value, field value details table, the statistics are as follows:

FieldName: Field name.
Value: Field value.
Pattern: Field value format type.
Frequency: The number of lines in this field format.
Percentage: The percentage of this field format.
Running Percentage of Total: The cumulative percentage of this field format.
Records: The cumulative ranking of this field format.
# Data Cleaning

# Node Function
For the table under the current node group, perform fast data cleaning on the fields
Basic Information Tab
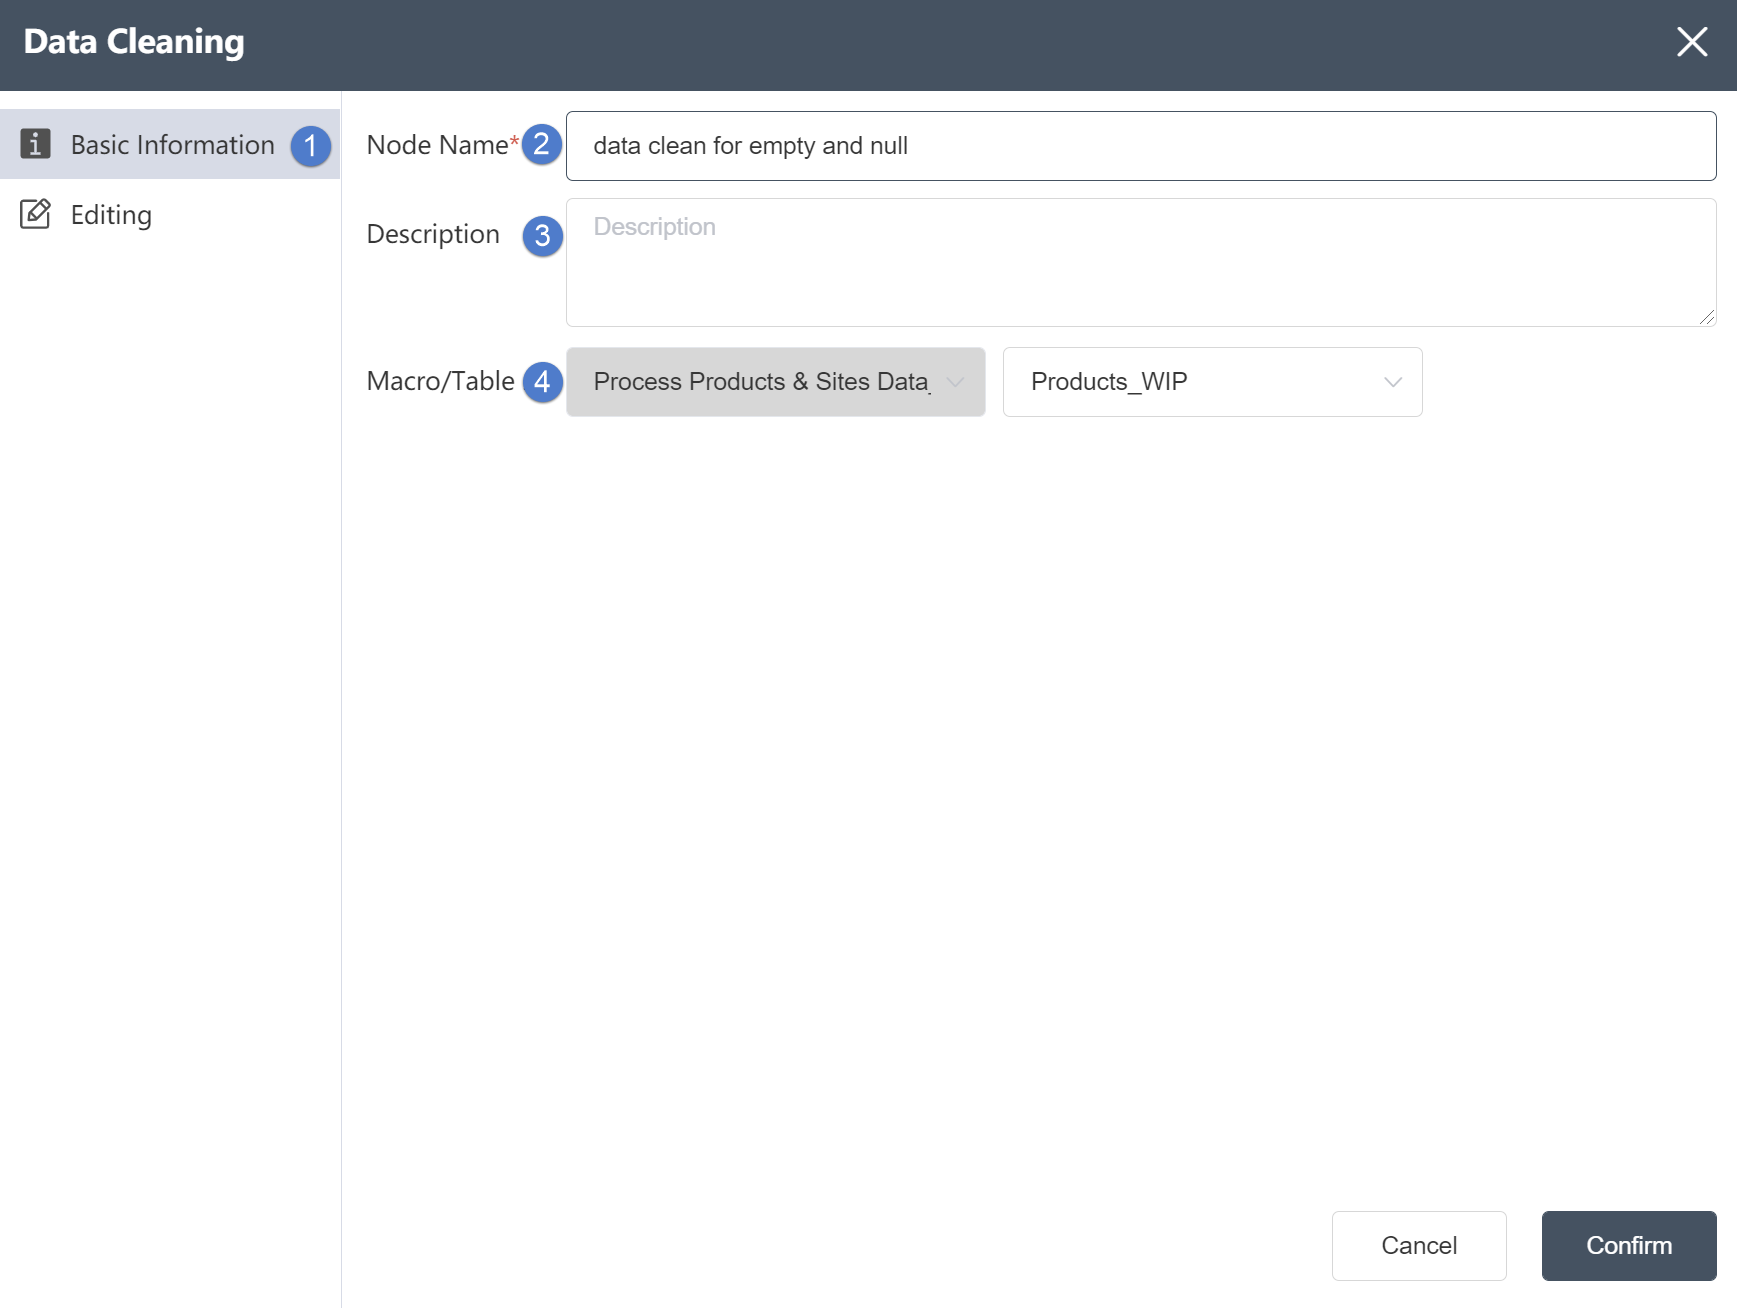
①Basic Information Tab: select this item to edit the basic information of the node
②Node name: Display the name of the node on the canvas.
③Node description: The custom description of the node function, displayed when the node information button is clicked on the canvas.
④Target connection: Determine the data source of the node, the target data is the main table, and then update the data column based on this table.
Data Editing Tab
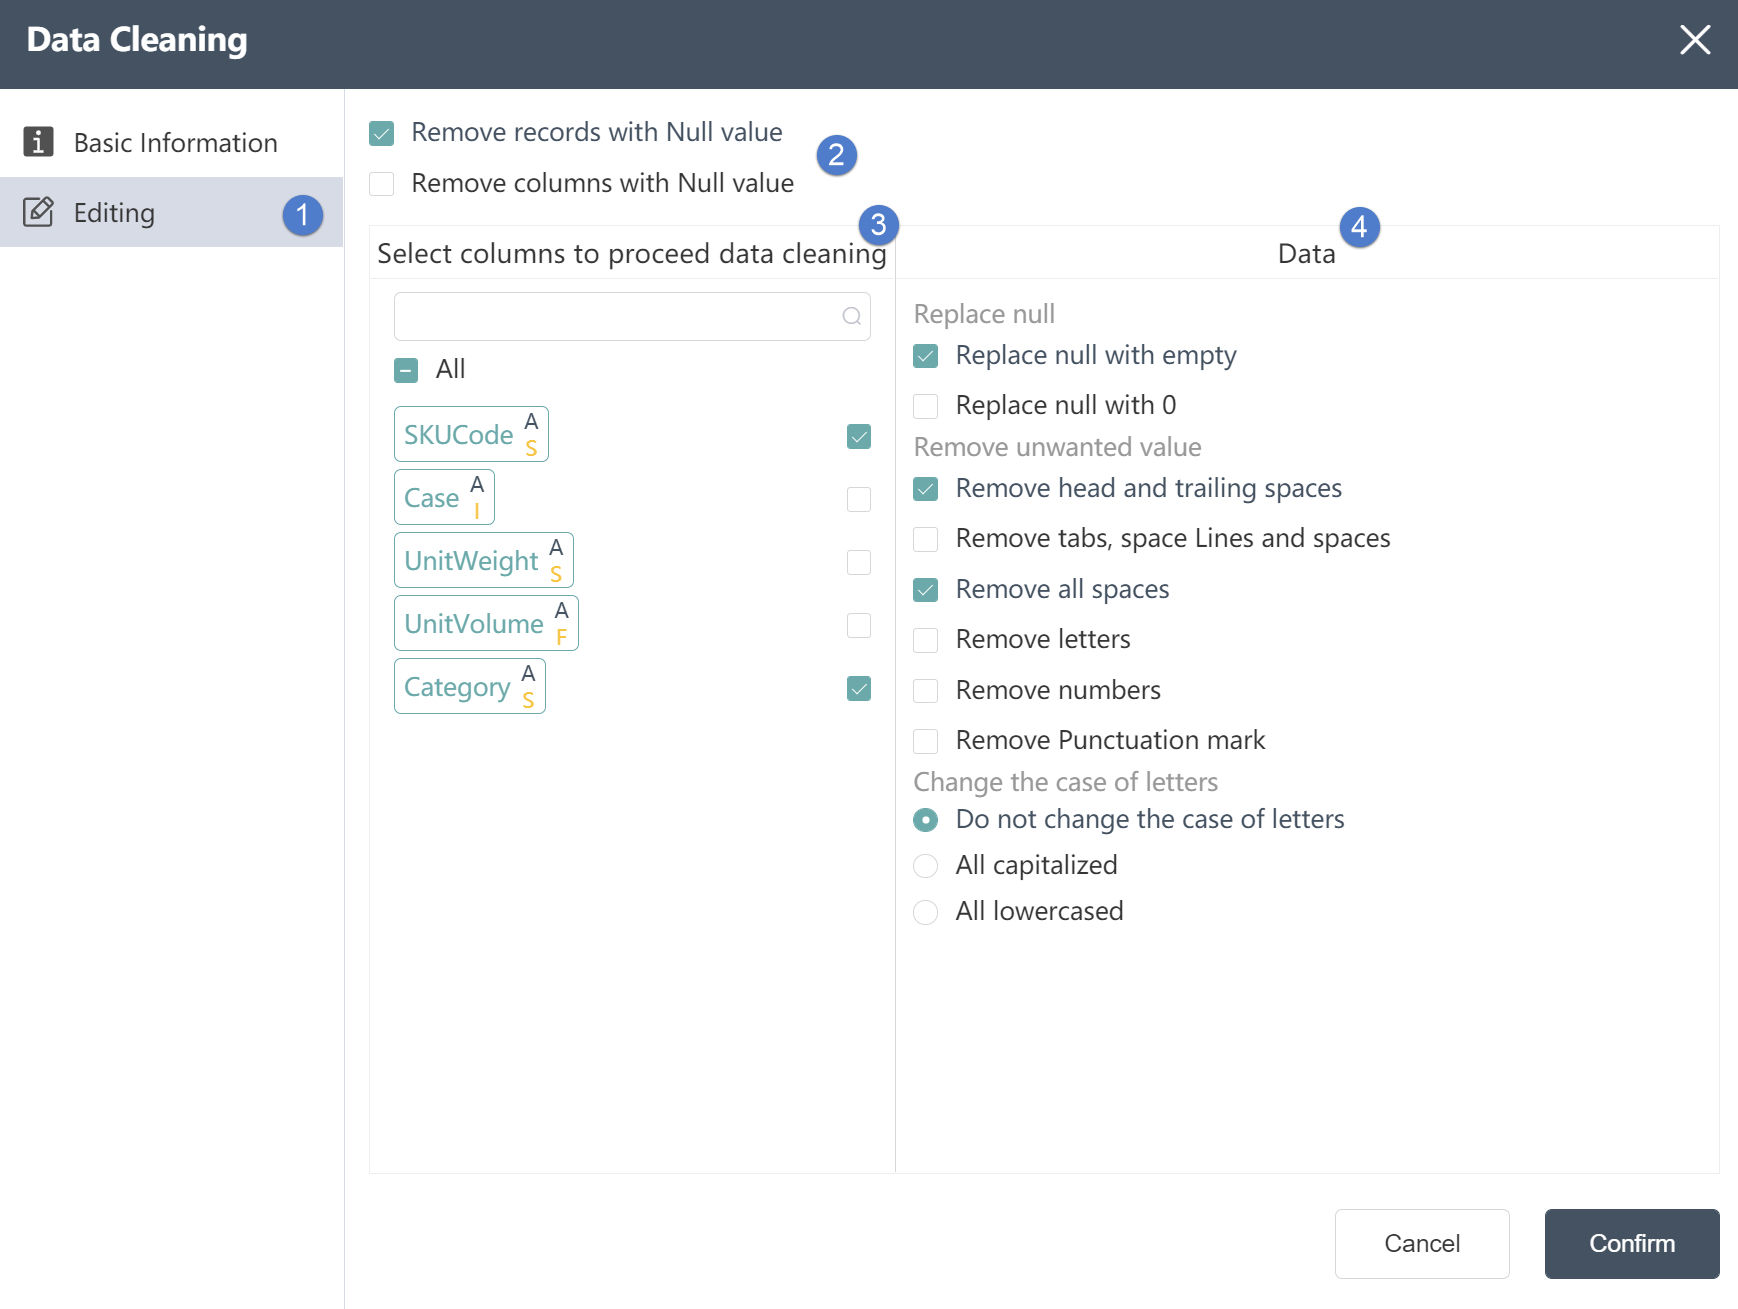
Data Editing Tab:
①Data editing: You can edit the conditions of data checking and the results of editing the output table on this interface.
②Remove Null Values: Select to remove rows containing Null values or remove columns containing Null values.
③Select the field to be cleaned: Select the field to be cleaned among all the imported fields.
④Field cleaning rules: Cleaning items include: remove empty rows, remove empty columns, replace Null values, remove unnecessary characters, modify case, etc.
# Data References

# Node Function
The node supports a variety of functions, such as updating the value of an existing field or writing a new field; it supports multi-table associations and supports internal associations; the filter condition function can assign values to those that meet and do not meet the conditions; it supports filter expressions for input data.
Basic Information Tab
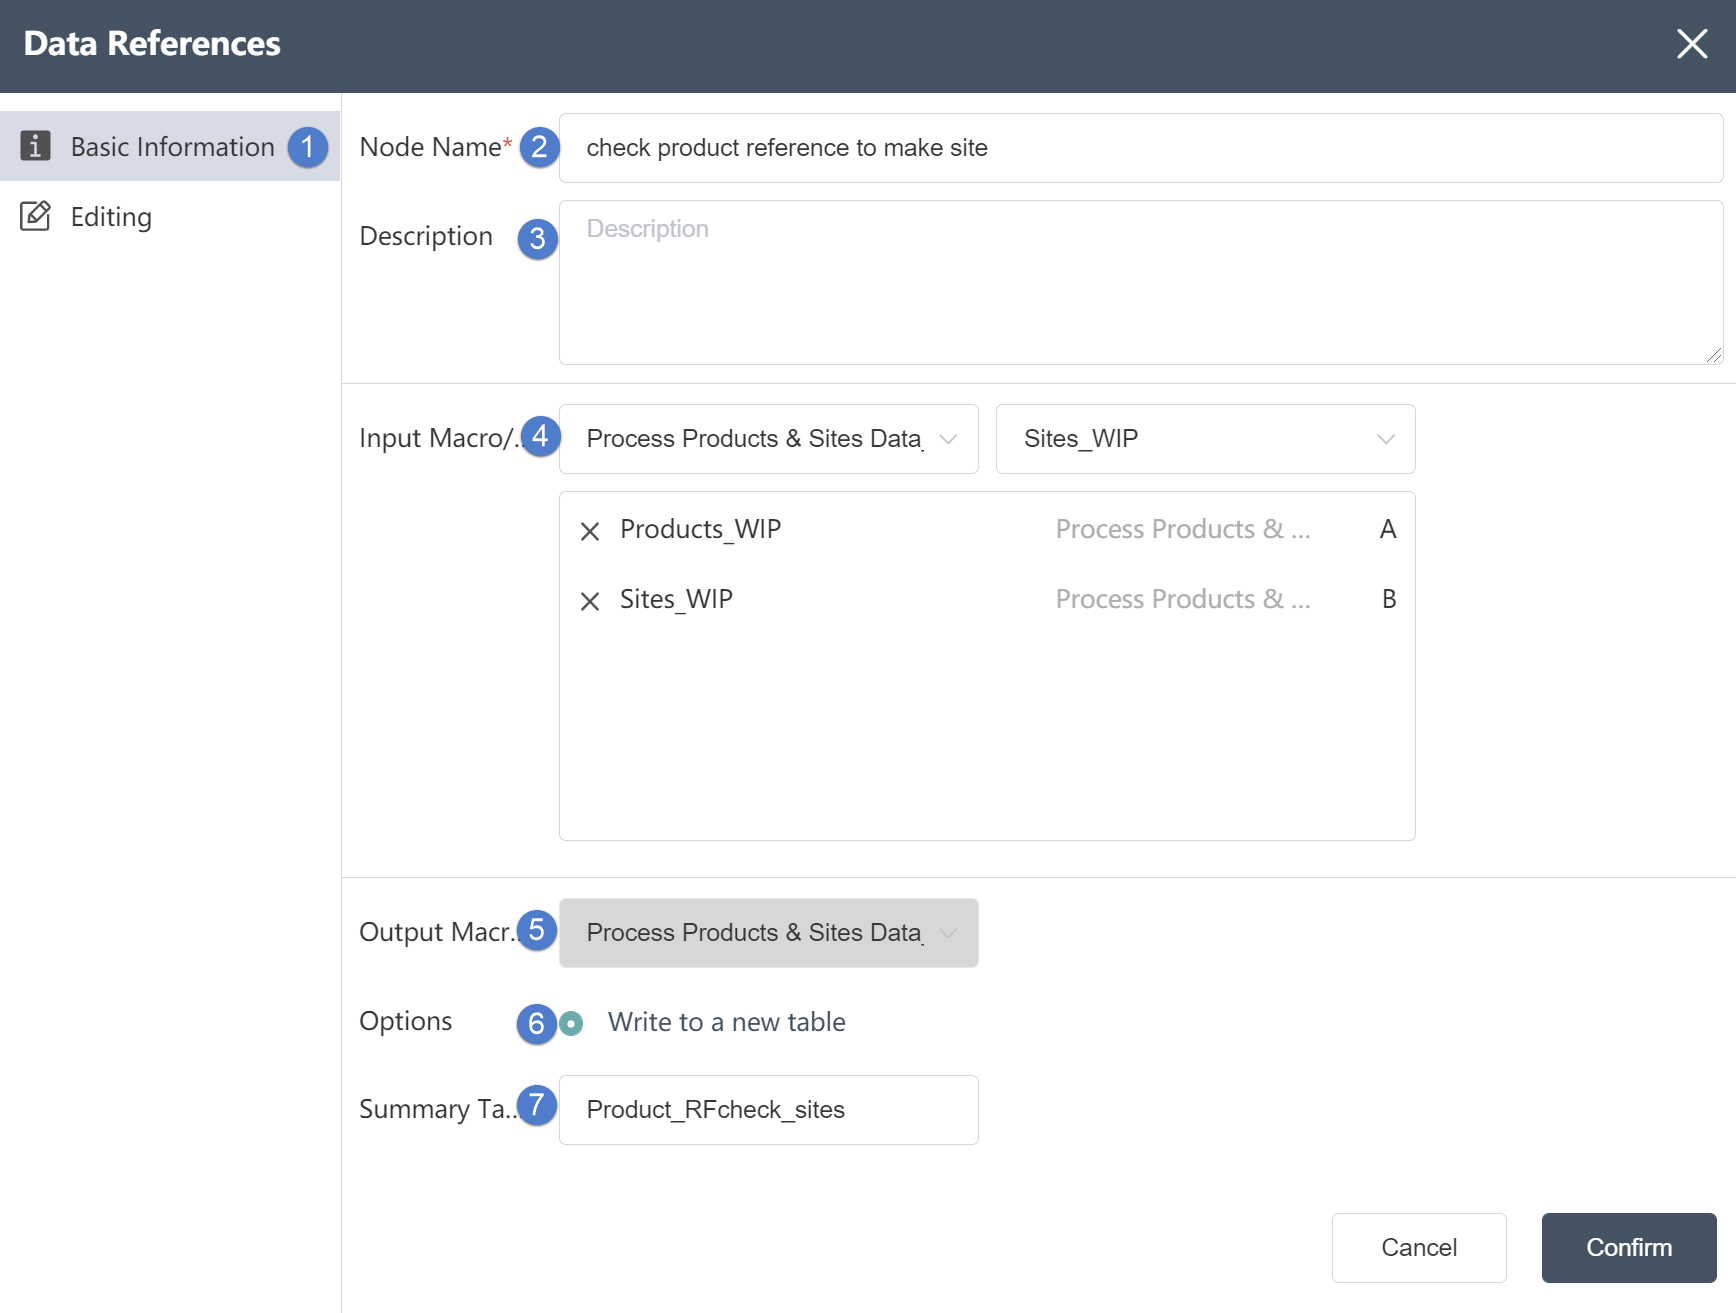
①Basic Information Tab: select this item to edit the basic information of the node
①Double-click/drag the node to the editing area.
②Node name: Display the name of the node on the canvas.
③Node description: The custom description of the node function, displayed when the node information button is clicked on the canvas.
④ Input data: Determine the data source of the node, and select the data source of the database connection node in the same node group.
⑤ Output data: cannot be changed
⑥Write mode: The check result is written to a new table.
⑦Summary table name: The table that stores the inspection results, you need to enter a name.
Data Editing Tab
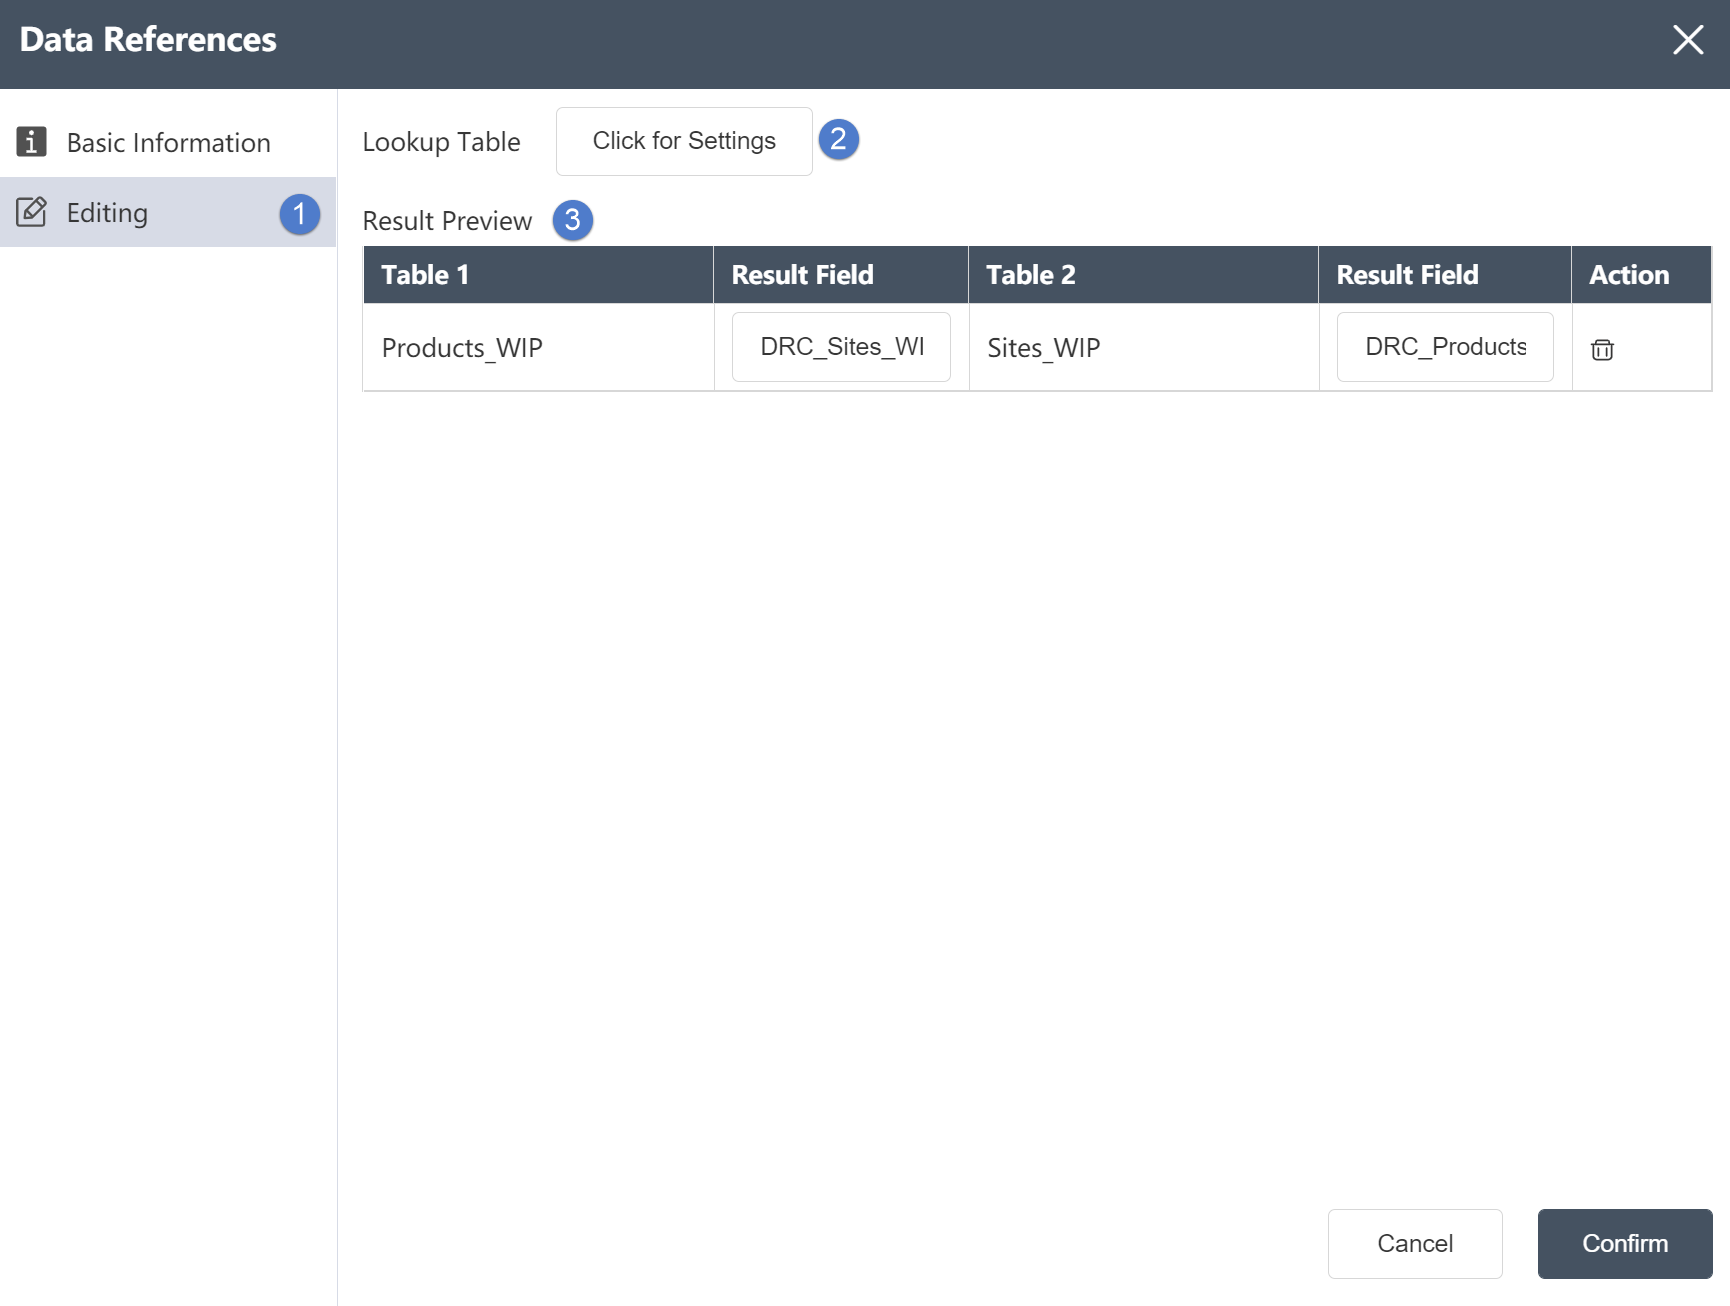
Data Editing Tab:
①Data editing: You can edit the data conditions and edit the results of the output table on this interface.
②Association table: Associative table: You can choose an association relationship in the association table, such as checking both tables, only checking table 1, only checking table 2, or canceling the check, etc., and editing the key values associated with the two tables.
③Output field preview: You can preview the result field in the input data here, and the result field will be automatically updated to the last column of the original table.
As shown in Table 1, after running this node, Table 1 will update a column of verification results, and the field name is the same as the result field name.
# Other Nodes
# Data Logic Control

# Node Function
The filter can judge the specific field in the selected data table with the specified condition by writing the judgment condition, and the judgment result can only be one of true and false. The connection line from the filter to its downstream node can be selected as true or false. When the judgment result is true, it will continue to execute the downstream node of the "true" type connection line. When the judgment result is false, the execution will be "false". "connector to the downstream node connected by the line. Because of this feature, the filter (and similar file filter, table filter) nodes can be used to judge the status of data, files, and tables in the workflow, and execute subsequent processes in a targeted manner.
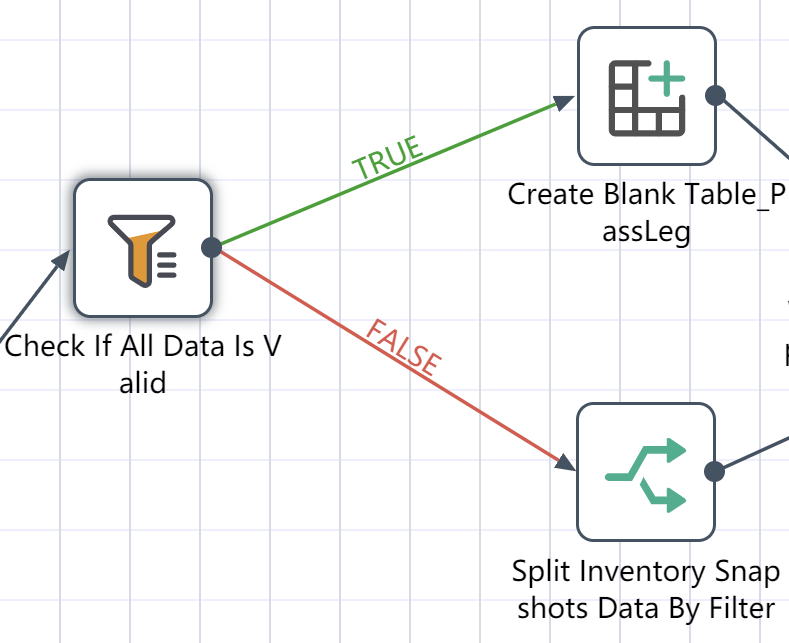
Basic Information Tab
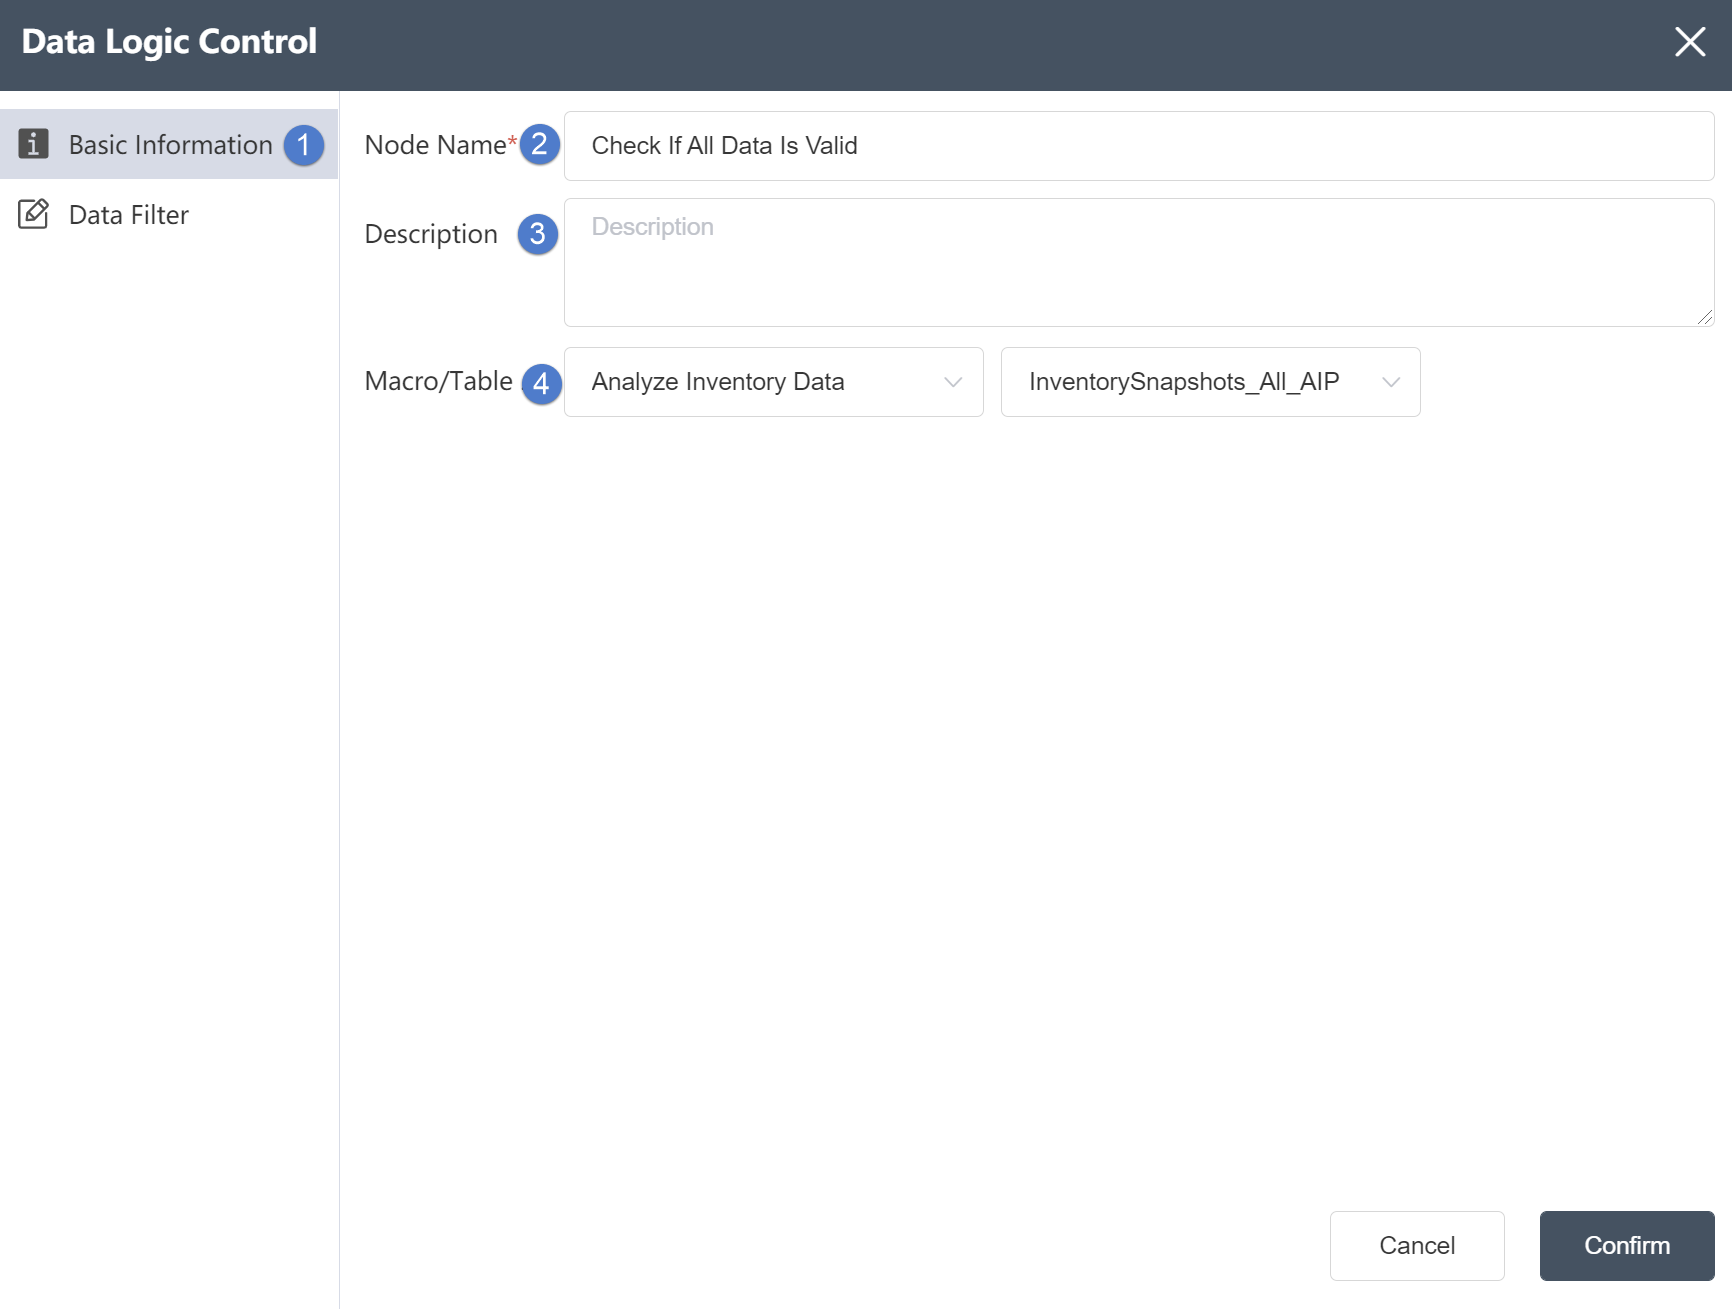
①Basic information tab: select this item to edit the basic information of the node
②Node name: Display the name of the node on the canvas.
③Node description: The custom description of the node function, displayed when the node information button is clicked on the canvas.
④ Input data: determine the data source of the node.
Data Filter Tab

Data Editing Tab:
①Data editing: You can edit the conditions of data checking and the results of editing the output table on this interface.
②By means of screening: (choose one of the four)
"All data rows meet the filter criteria"
"No data rows meet the filter criteria"
"Any data meets the filter criteria"
"Form is empty"
③Input table fields: After editing the data, you can see the defined table fields and field types in the data output tab.
④Search box: You can search the desired field in the search box, which is suitable for the situation that there are too many table fields and cannot be found immediately.
⑤ Input table filter: The input table can be filtered and judged.
⑥Compiling of filter conditions: You can flexibly use functions to customize and edit the filter judgment conditions.
# File Exists Check

# Node Function
Filter the CSV/TXT files that meet the conditions, and connect the True/False line to achieve filtering.
Basic Information Tab
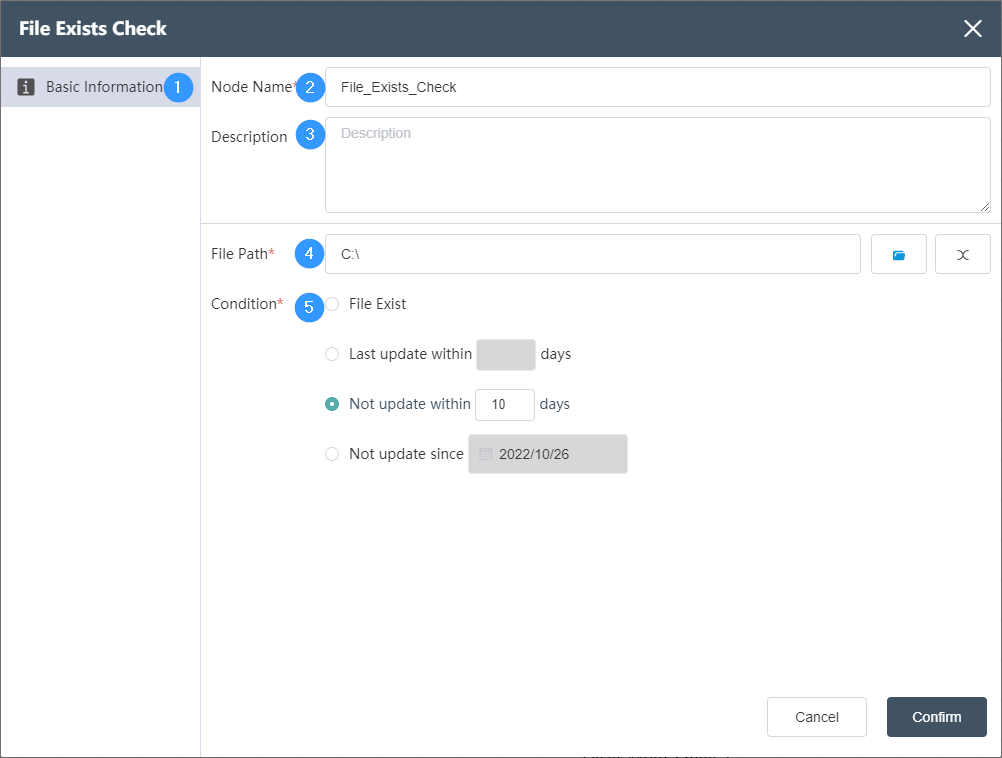
①New Node -> File Filter
②Node name: Display the name of the node on the canvas.
③Node description: The custom description of the node function, displayed when the node information button is clicked on the canvas.
④File path: You can directly find the connected file in the file path
⑤Passing conditions: There are four kinds of filtering for files, the file exists/the last update time is not updated within *days/*days/not updated after *
# Table Exists Check

# Node Function
Filter the table in the Dastro database, verify whether it exists, and connect True/False to achieve filtering.
Basic Information Tab
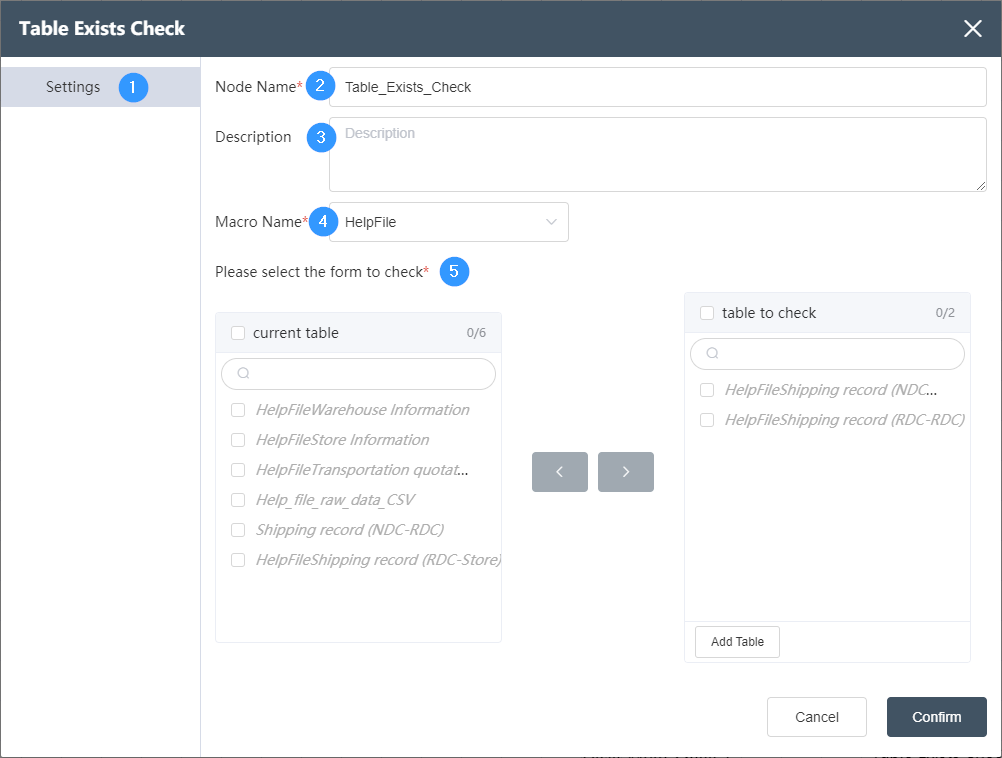
①Basic information tab: select this item to edit the basic information of the node
②Node name: Display the name of the node on the canvas.
③Node description: The custom description of the node function, displayed when the node information button is clicked on the canvas.
④Target data: Determine the data source of the node, and the target data is the name of different node groups.
⑤Select the table to be checked: "Current table" stores all the tables under the node group, and the data table can be checked by storing the table to be checked from the current table to the "table to be checked".
# Data Types, Logical Operators, and Functions
# Type of Data
Optional data types in all node tables, including the following 7:
①STRING (string), a string that expresses such as 'factory', the field length can be a positive integer value, such as 55, and the maximum field length is 65535.
②INTEGER (integer), expressing an integer value such as 102, the range of values that can be expressed is -2,147,483,648 (-2\^-31) to 2,147,485,647 (2\^31-1)
③NUMERIC (number), which can express integers and decimals, and can set the reserved digits for the integer part and the decimal part. The default is 28 digits for integers and 2 digits for decimals.
④FLOAT (floating point number), expressing a decimal value such as 50.1, the range of values that can be expressed is -3.4*E38 to 3.4*E38
⑤BOOLEAN (Boolean value), which is often used for binary judgment of yes and no. It can only take two values: FALSE (false) and TRUE (true).
⑥DATE (date), express the date value such as 2022-08-16.
⑦TIME (time), expressing the time value such as 18:30:59.
# Logical Operator
# AND OR Logic
AND, AND logic, output Boolean value, the two connected logics need to be established at the same time to be true
①Example: (2>1) AND (1>0) output TRUE
OR, or logic, outputs a boolean value, indicating that either of the two logics is true, then true
①Example: (2>1) OR (2>3) output TRUE
# Logical Operators
①Include = (equal to), ≠ (not equal to), + (plus sign), - (minus sign), × (multiplication sign), ÷ (division sign), > (greater than), >= (greater than or equal to), < (less than), <= (less than or equal to), || (or), '()' (parentheses), the same rules as the corresponding mathematical and logical operators.
# Database Operator
- Like, a case-sensitive inclusive match search, for example:
①Exact match, Like A; match string A
②Prefix matching, Like A%, matches all strings such as Apple and Ahead.
③Suffix matching, Like %A, matches all strings such as Factory_A and Product_A.
④ Fuzzy matching, Like %A%, matches all strings such as DAAS and FACTORY.
- NotLike, case-sensitive does not contain match searches, examples are as follows:
①Exact match, NotLike A; match a string that is not A
②Prefix matching, NotLike A%, matches all strings that do not contain the A prefix.
③Suffix matching, NotLike %A, matches all strings that do not contain the A suffix.
④ Fuzzy matching, NotLike %A%, matches all strings that do not contain A.
- iLike, similar to the usage of Like, contains case-insensitive search for matches, examples are as follows:
①Exact match, iLike A; match strings A and a
②Prefix matching, iLike A%, matches all strings such as apple and Ahead.
③Suffix matching, iLike %A, matches all strings such as Factory_a and Product_A.
④ Fuzzy matching, iLike %A%, matches all strings such as DAAS and Factory.
- Not_iLike, similar to the usage of NotLike, does not contain a case-insensitive match search, the example is as follows:
①Exact match, Not_iLike A; match strings that are not A or a
②Prefix matching, Not_iLike A%, matches all strings that do not contain A or a prefix.
③Suffix matching, Not_iLike %A, matches all strings that do not contain A or a suffix.
④ Fuzzy matching, Not_iLike %A%, matches all strings that do not contain A or a.
# Other
①Empty, which means empty string, equivalent to ''
# Function
| serial number | function name | Number of parameters | function | Example |
|---|---|---|---|---|
| 1 | Abs | 1 | Returns the absolute value of the parameter | ABS(-17.4)=17.4 |
| 2 | Acos | 1 | Returns the arc cosine of the argument | Acos(0)=π/2=90° |
| 3 | Asin | 1 | Returns the arc sine of the argument | Asin(1)=π/2=90° |
| 4 | Atan | 1 | Returns the arctangent of the argument | Atan(1)=π/4=45° |
| 5 | Cbrt | 1 | Returns the cube root of the argument | Cbrt(27)=3 |
| 6 | Ceil | 1 | round up the parameter | Ceil(-4.5)=-4 |
| 7 | Cos | 1 | Returns the cosine of the argument | Cos(pi()/2)=0° |
| 8 | DateDiff | 3 | Returns the difference between two dates - the third parameter is the difference unit | DateDiff('2022-02-22', '2022-02-23', 'hour')=24 |
| 9 | DateRollupMonth | 1 | Return time to the first day of the current month | DateRollupMonth('2022-02-22')='2022-02-01' |
| 10 | DateRollupYear | 1 | Return time to the first day of the current year | DateRollupYear('2022-12-22')='2022-01-01' |
| 11 | Degrees | 1 | Convert radians to degrees | Degrees(0.5)≈28.648 |
| 12 | Exp | 1 | Returns the natural exponent of the argument | Exp(1)≈2.718 |
| 13 | Floor | 1 | round down the parameter | Floor(-4.5)=-5 |
| 14 | IsNotNull | 1 | Check if a field is not empty | IsNotNull(Field)=true |
| 15 | IsNull | 1 | Check if a field is empty | IsNull(Field)=false |
| 16 | Left | 2 | Intercept the N characters from the left of the string and return | Left('Tom',2)='To' |
| 17 | Ln | 1 | Returns the natural logarithm of the argument | Ln(2)≈0.693 |
| 18 | Log | 2 | Returns the logarithm of the specified base | Log(2,64)=6 |
| 19 | Lower | 1 | Convert parameter to all characters lowercase | Lower('Tom')='tom' |
| 20 | Ltrim | 2 | Remove the longest string containing only characters from the beginning of the string string | Ltrim('zzzytrim','xyz')='trim' |
| twenty one | LtrimBlank | 1 | Removes all spaces from the left of the string string | Ltrim(' trim')='trim' |
| twenty two | Mod | 2 | remainder of the parameter | Mod(9,4)=1 |
| twenty three | Pi | 0 | return pi constant | Pi()≈3.1415 |
| twenty four | Power | 2 | Raise the base to the power of the exponent | Pow(2,3)=8 |
| 25 | Radians | 1 | convert angle to radian | Radians(45)≈0.785 |
| 26 | Random | 0 | Randomly generate a decimal between 0.0 and 1.0 | Random()=0.25 |
| 27 | Replace | 3 | Replace a substring in a string with another string | Replace('Tom','om','im')='Tim' |
| 28 | Right | 2 | Intercept the N strings on the right side of the string and return | Right('Tom',2)='om' |
| 29 | Round | 2 | Rounding up to N decimal places | Round(4.52,1)=4.5, Round(4.58,1)=4.6 |
| 30 | RoundInt | 1 | rounding to an integer | RoundInt(4.42)=4, RoundInt(4.88)=5 |
| 31 | Rtrim | 2 | Remove the longest string of the warranty character from the end of the string | Rtrim('trimxxxxx','x')='trim' |
| 32 | RtrimBlank | 1 | Removes all spaces from the right of the string string | Rtrim('trim')='trim' |
| 33 | Sign | 1 | Returns the sign of the argument (-1,0,+1) | Sign(-1.2)=-1, Sign(2.2)=1 |
| 34 | Sin | 1 | Returns the sine of the argument | Sin(pi()/2)=1 |
| 35 | Sqrt | 1 | Returns the square root of the argument | Sqrt(9)=3 |
| 36 | Strlen | 1 | Returns the character length of the parameter | Strlen('tom')=3 |
| 37 | Strpos | 2 | Find the position of a substring | Strpos('tom','t')=1 |
| 38 | SubString | 3 | Intercept N characters starting from the M-th character in the middle of the string and return | Substring('Tommy',2,3)='omm' |
| 39 | Tan | 1 | Returns the tangent of the argument | Tan(pi()/4)=1 |
| 40 | ToChar | 1 | Convert other types of data to strings | ToChar(125)='125' |
| 41 | ToDate | 2 | convert string to date | ToDate('05 Dec 2000', 'DD Mon YY')=2000-12-05 |
| 42 | ToNumber | 1 | convert string to number | ToNumber('125.1')=125.1 |
| 43 | ToTimeStamp | 2 | Convert string to timestamp | ToTimeStamp('05 Dec 2000', 'DD Mon YY')=2000-12-05 00:00:00.000000 +00:00 |
| 44 | Trunc | 2 | Number truncated to N decimal places | Trunc(4.58,1)=4.5 |
| 45 | TruncInt | 1 | truncate numbers towards zero | TruncInt(4.65)=4 |
| 46 | Upper | 1 | Convert parameters to all uppercase characters | Upper('Tom')='TOM' |
← Tutorial