# Tutorial
# Why use DASTRO®?
With the increasing amount of data in enterprises, 60% of enterprises believe that the challenge of data is huge, and enterprises increasingly need a software that can process data in various storage forms.
# What is DASTRO®?
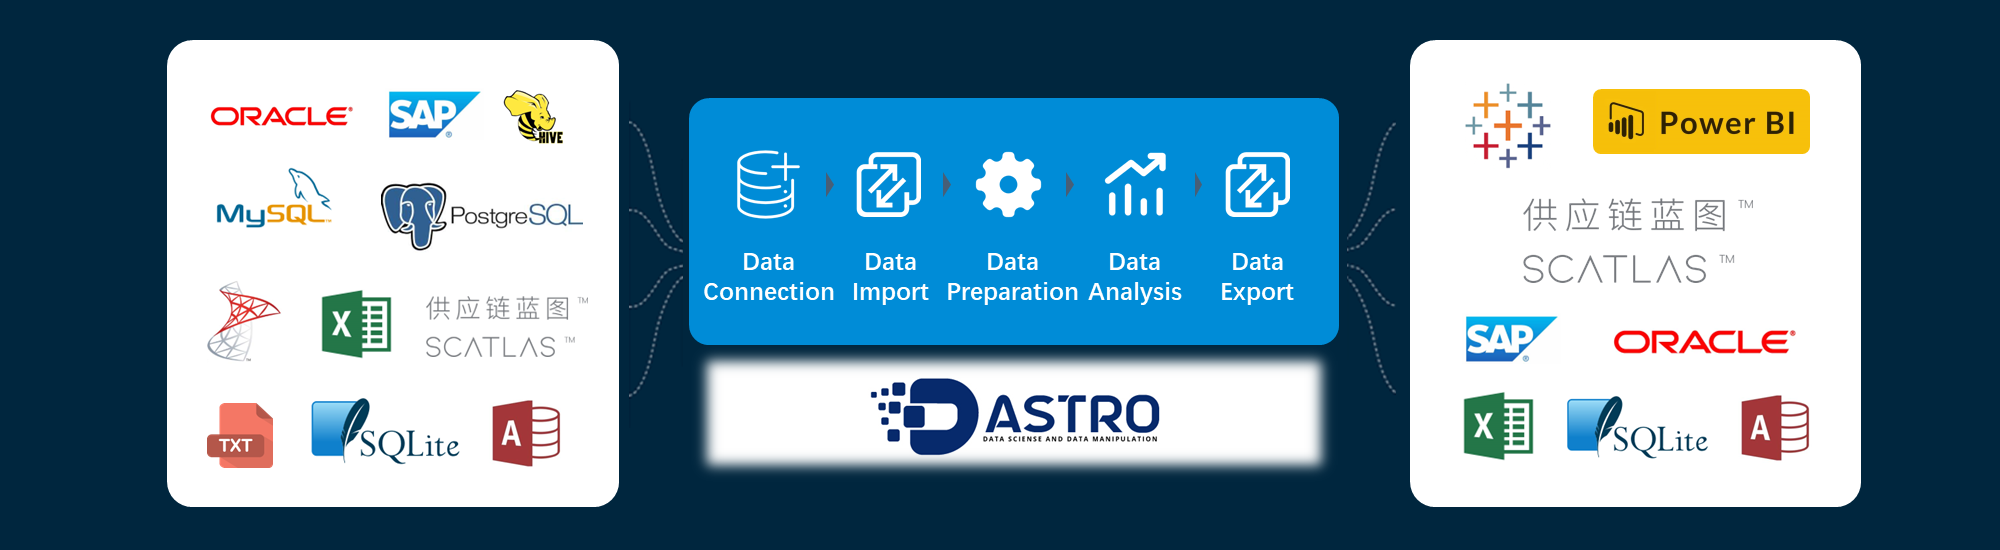
DASTRO® is an integrated, zero-code, process-based, cloud-based, and highly compatible data standardization platform.
- Integration: Integrate data from different data sources in one platform
- Zero code: Zero code handles large amounts of data with ease
- Process-based: solidify the data analysis and processing process, which can be reused
- Cloud collaboration: support the operation of multi-privileged users on the cloud
- High compatibility: data analysis results are output to business systems or modeling analysis
# Who will use DASTRO®?
# What can DASTRO® do?
DASTRO® can:
- Complete complex data preparation, analysis, and processing processes by dragging and dropping buttons to connect data islands of enterprises
- Manage both online and offline data through one platform
- Quickly analyze and identify problem data to gain insight into the business value behind big data
- People from multiple departments can use a set of data work processes together in the cloud. At the same time, it can ensure the security of the authority of the department data
- Each data processing step can be automatically executed through the management of timed tasks. thus matching business cycles
- From after-sales training to Q&A, the DASTRO® platform is backed by experienced technical support staff.
The following will introduce the powerful functions of DASTRO® from actual business scenarios.
# Common usage scenarios of Dastro
- Business scene
A petrochemical company was considering using the SCATLAS® optimization model to re-plan its distribution network following its recent acquisitions.
- data challenge
The size of the data exceeds the upper limit of the company's current analytical tools (such as Access and Excel). The company's existing planners do not have the skills to use the database.
- DASTRO® Solutions
Blue Fortune consultants create DASTRO® workflows by implementing projects and deliver them to planners. The client's planner can easily create complex models with DASTRO® and adapt them to future modeling needs.
# How to use DASTRO®?
This section will introduce a simple case. You need to follow the steps marked by ①②... step by step to create node groups, add nodes, and combine workflows, and gradually learn to use DASTRO®.
# Case Study: Organizing Supply Chain Data with DASTRO®
Company D approached Lanxing to optimize its supply chain using SCATLAS® modeling. Since the data input of SCATLAS® requires a fixed format, the raw data of the supply chain is processed so that it can be input into SCATLAS®.
# Raw data download
# Introduction to raw data
The operations team collected the following operational data:
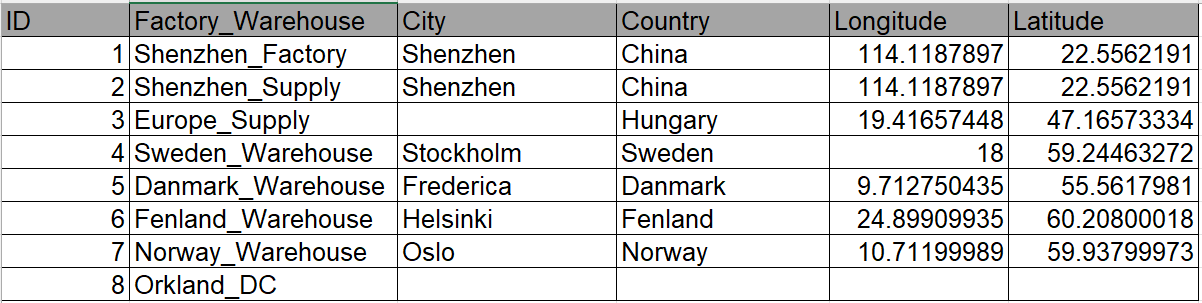
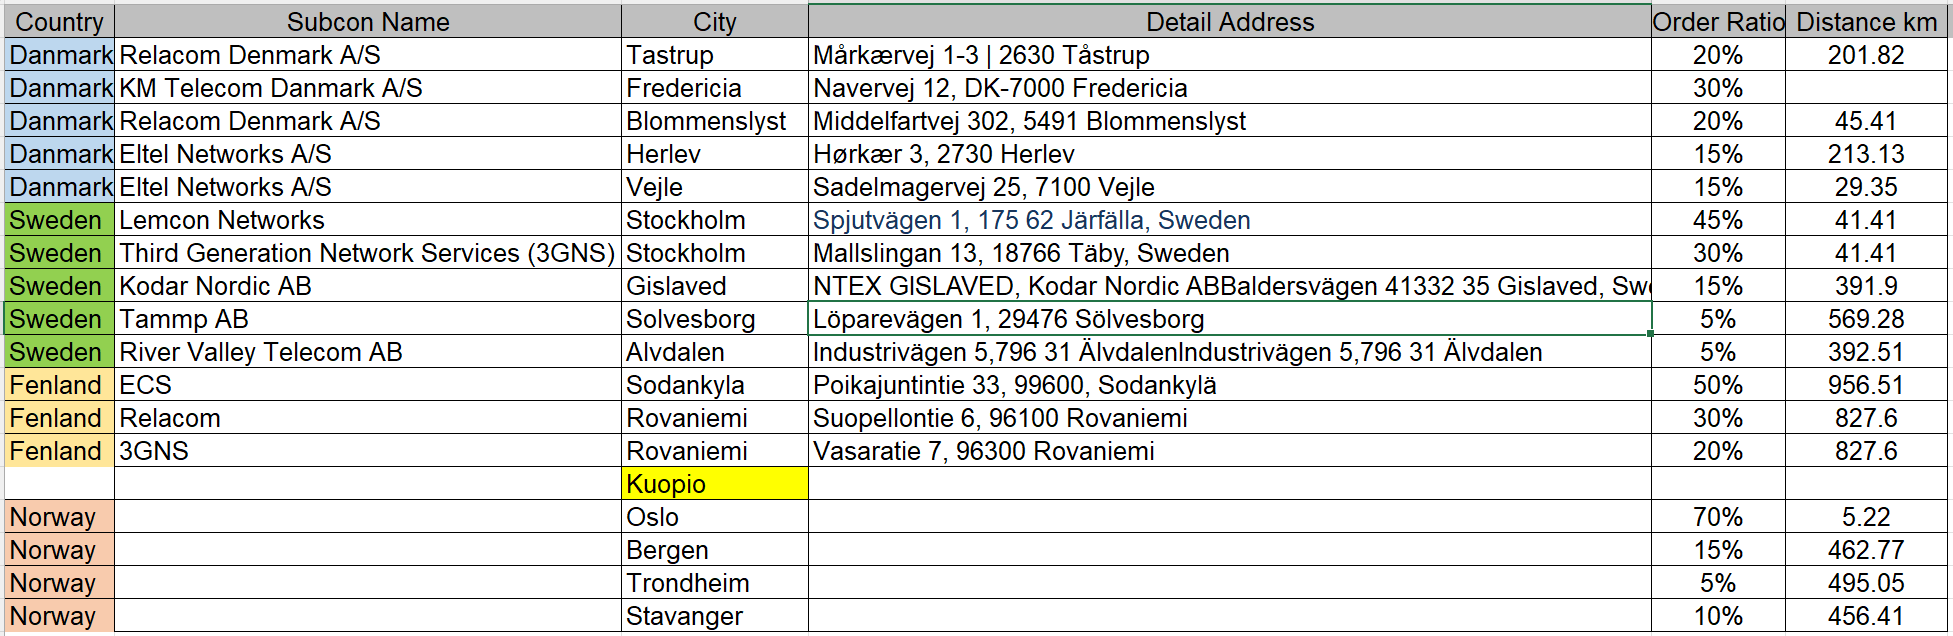
site
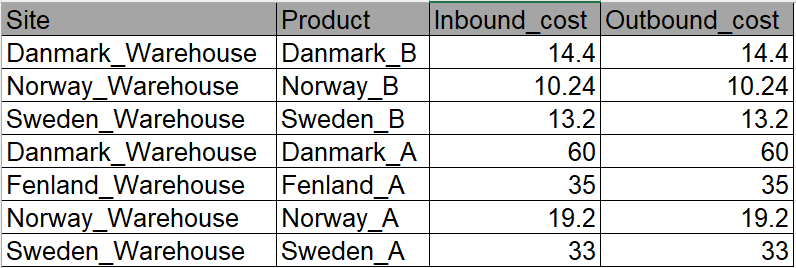
Inbound and outbound costs
Demand by month
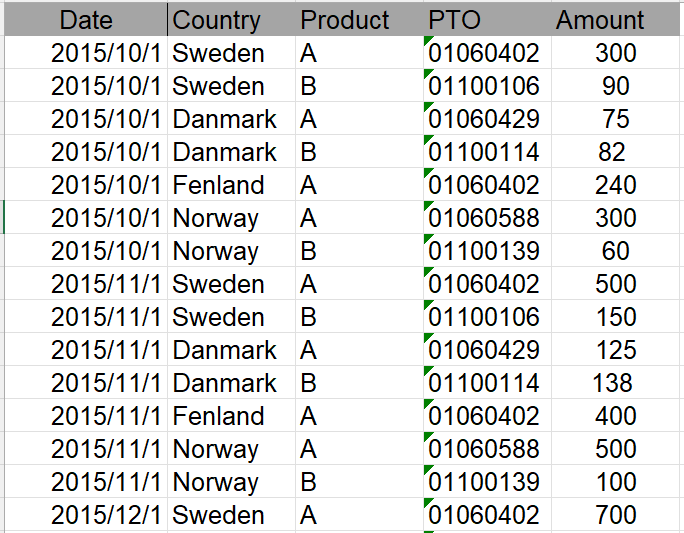
The demand ratio of agencies
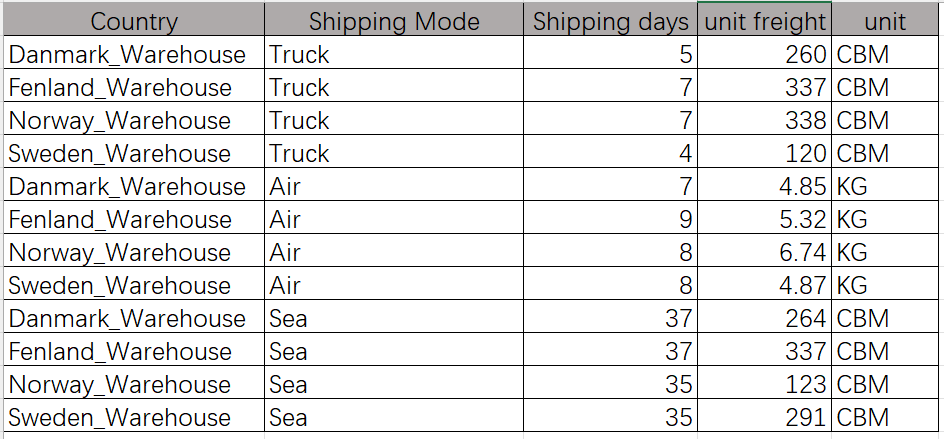
International shipping cost
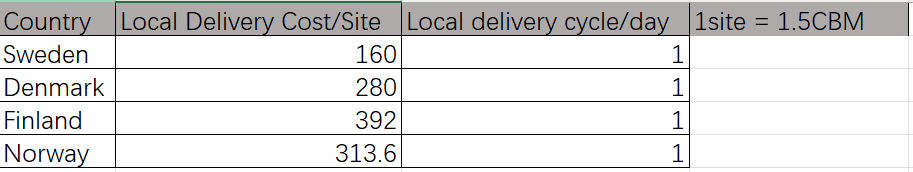
Local shipping cost
# DASTRO® Workflow
After obtaining the original data, if we manually process the data, we usually need to perform repetitive and process-based operations such as checking whether the data can be verified against each other, removing empty rows in the data, and replacing typos. But in DASTRO®, you only need to set up a workflow to process batch data with one click.
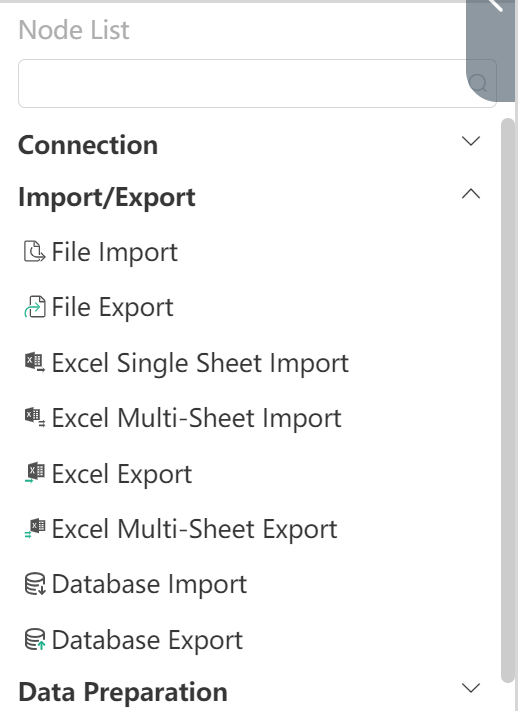
Workflow is the data processing process of the entire project, and the data processing can be automatically completed by clicking and running. The workflow is often divided into the following major steps: data import, data preprocessing, data cleaning and analysis, and exporting to SCATLAS®. Each large step is equivalent to a node group  . Each node group contains multiple nodes, and a node is a specific small step, such as connecting to Excel
  , connecting to a database
  , deleting rows
  , merging tables
  , conditional updates
  , etc.
# New workflow:
- Click the "+" in the upper right corner of the workflow in the navigation bar

- Enter the workflow name in the pop-up window: New Workflow_Nordic
- Click to confirm
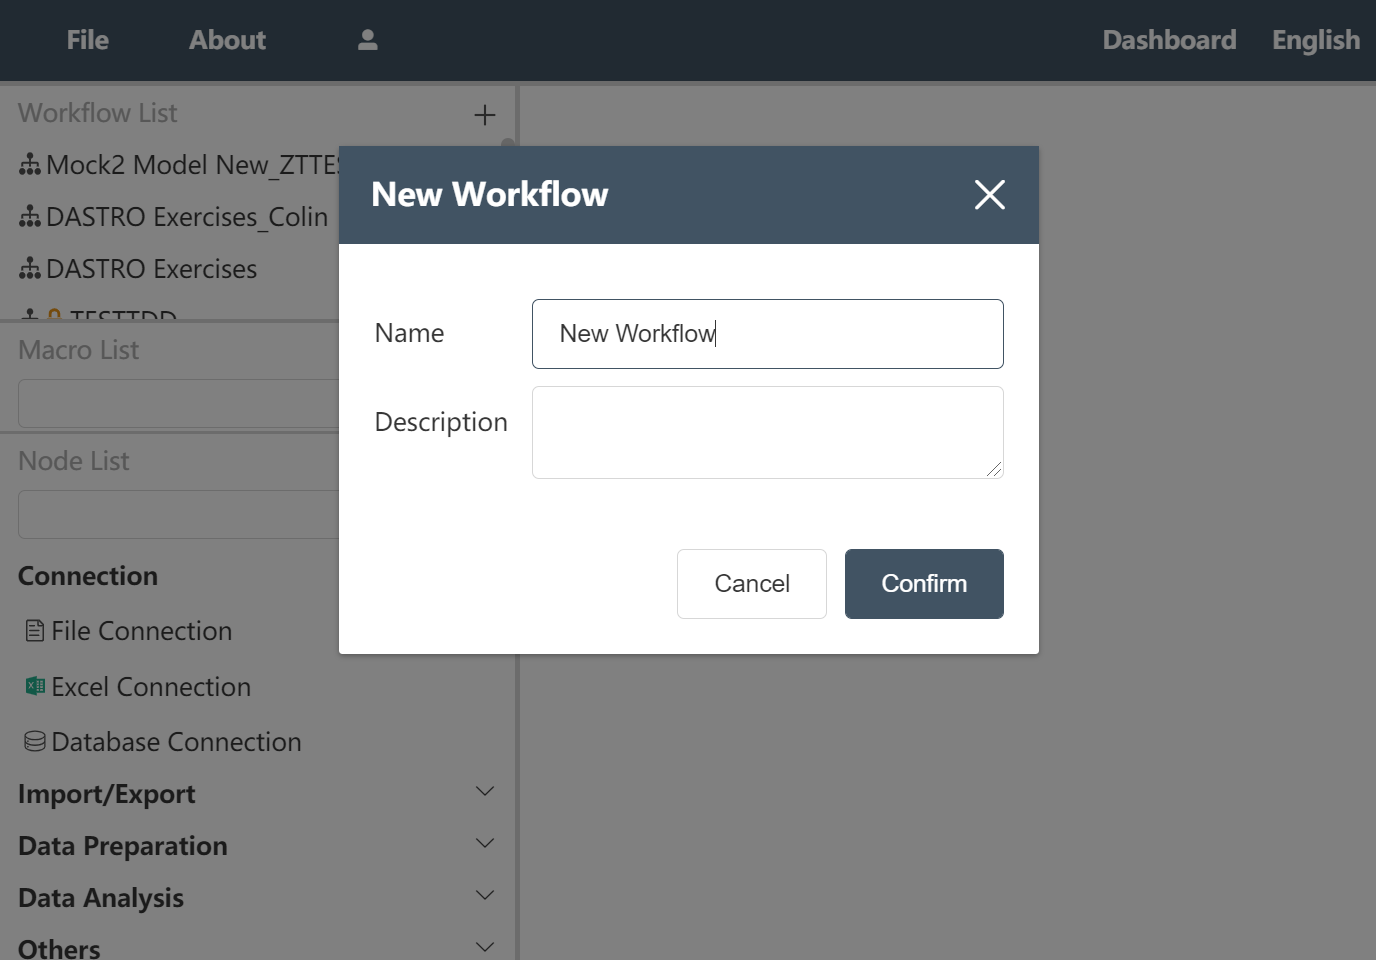
Figure 2.1 New workflow
After the operation is completed, the interface will jump to the canvas of the workflow "New Workflow_Nordic Four Countries".
# Create a new node group and wire it up:
Click the "+" in the upper right corner of the navigation bar node group

- Enter the node group name in the pop-up window: -Facility data import preprocessing
Click to confirm
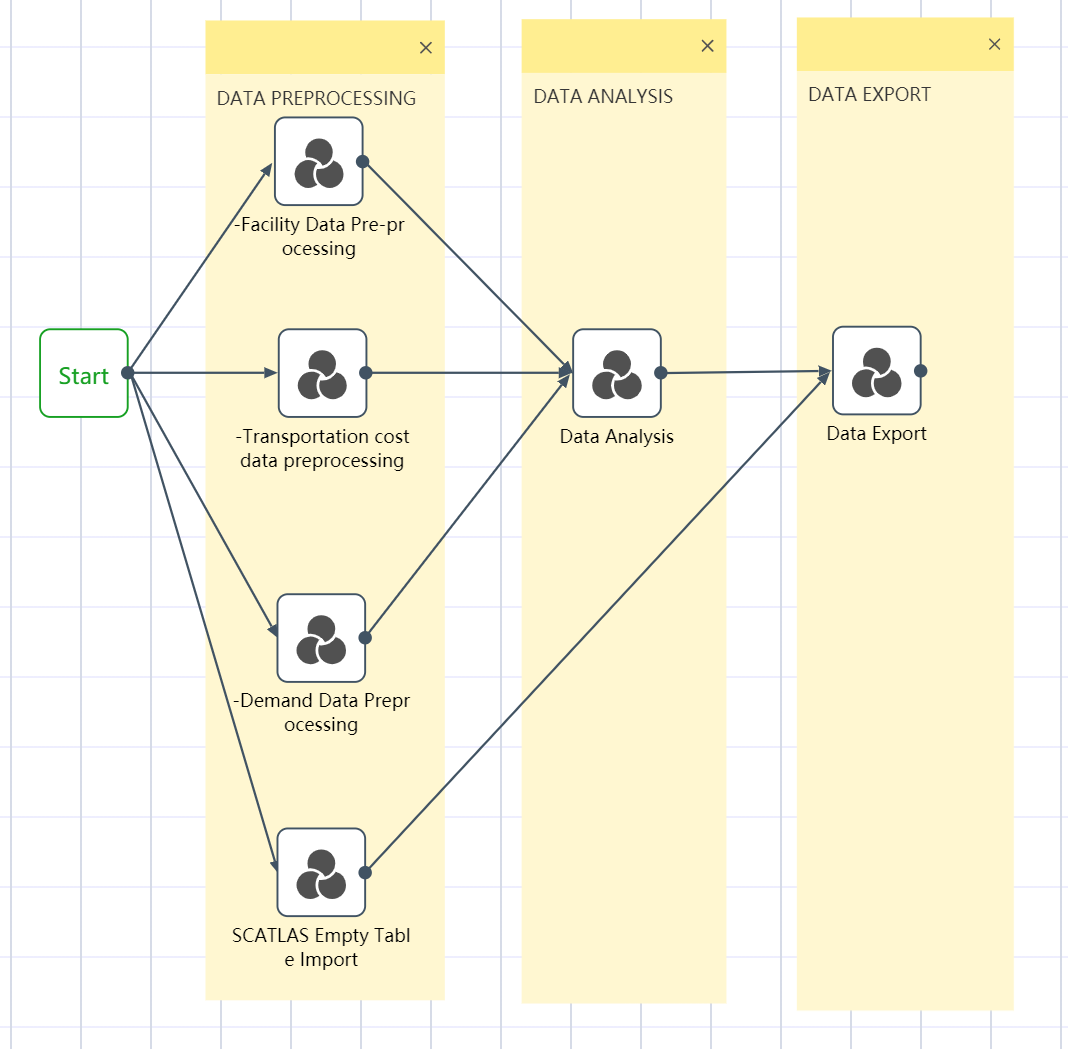
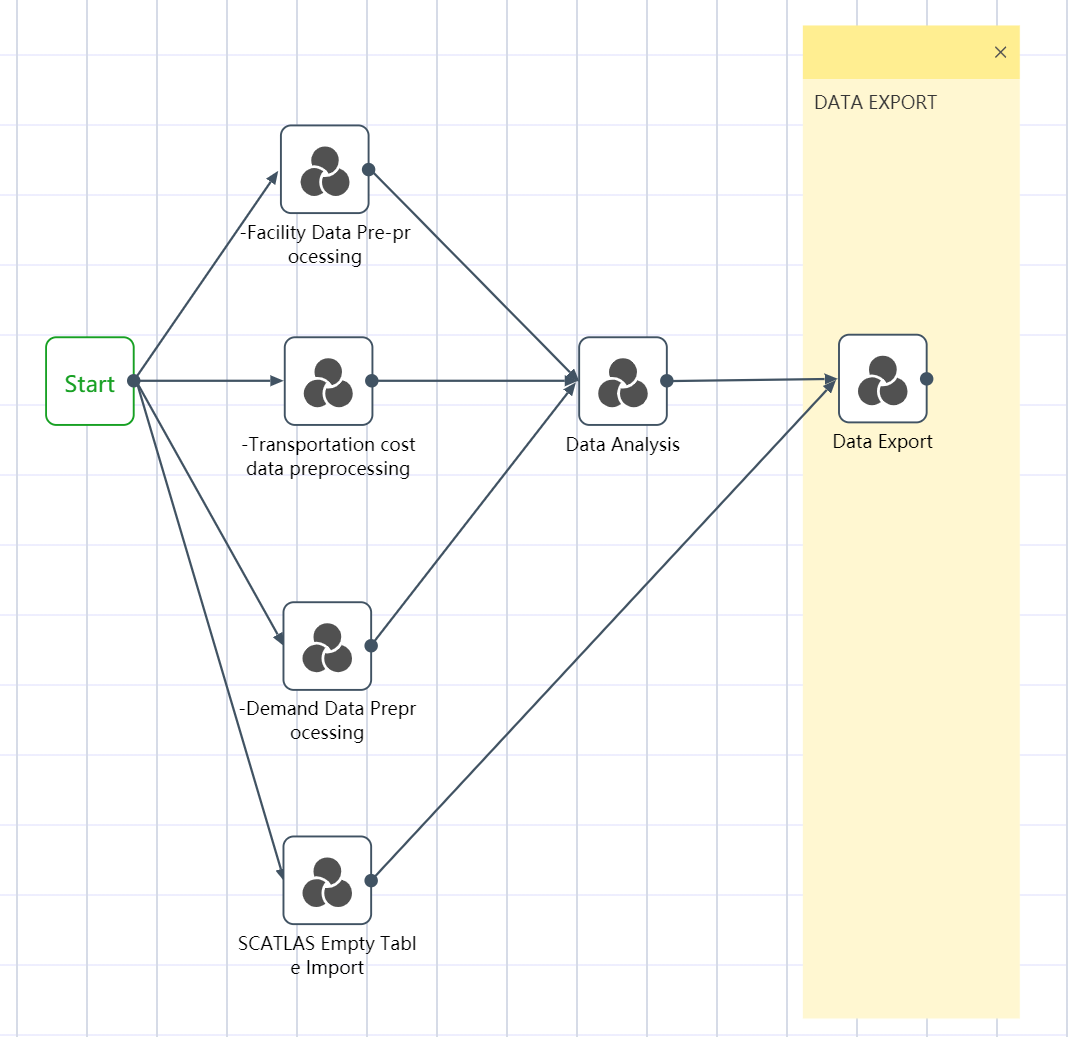
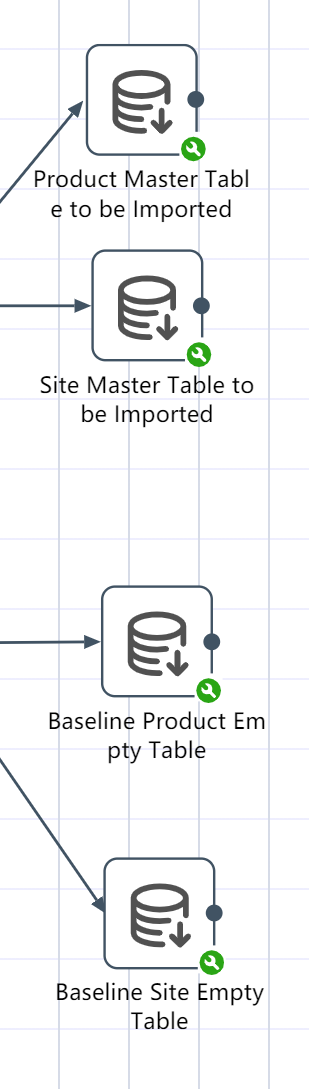
All six node groups are established by the methods of ①~③: Facility data import and preprocessing; transportation quotation data import and preprocessing; demand forecast data import and preprocessing; SCATLAS empty table import; data sorting and analysis; data export to SCATLAS
Drag from the previous node group to the next node group to create a flow line
Click the Execute button in the upper right corner of the workflow canvas
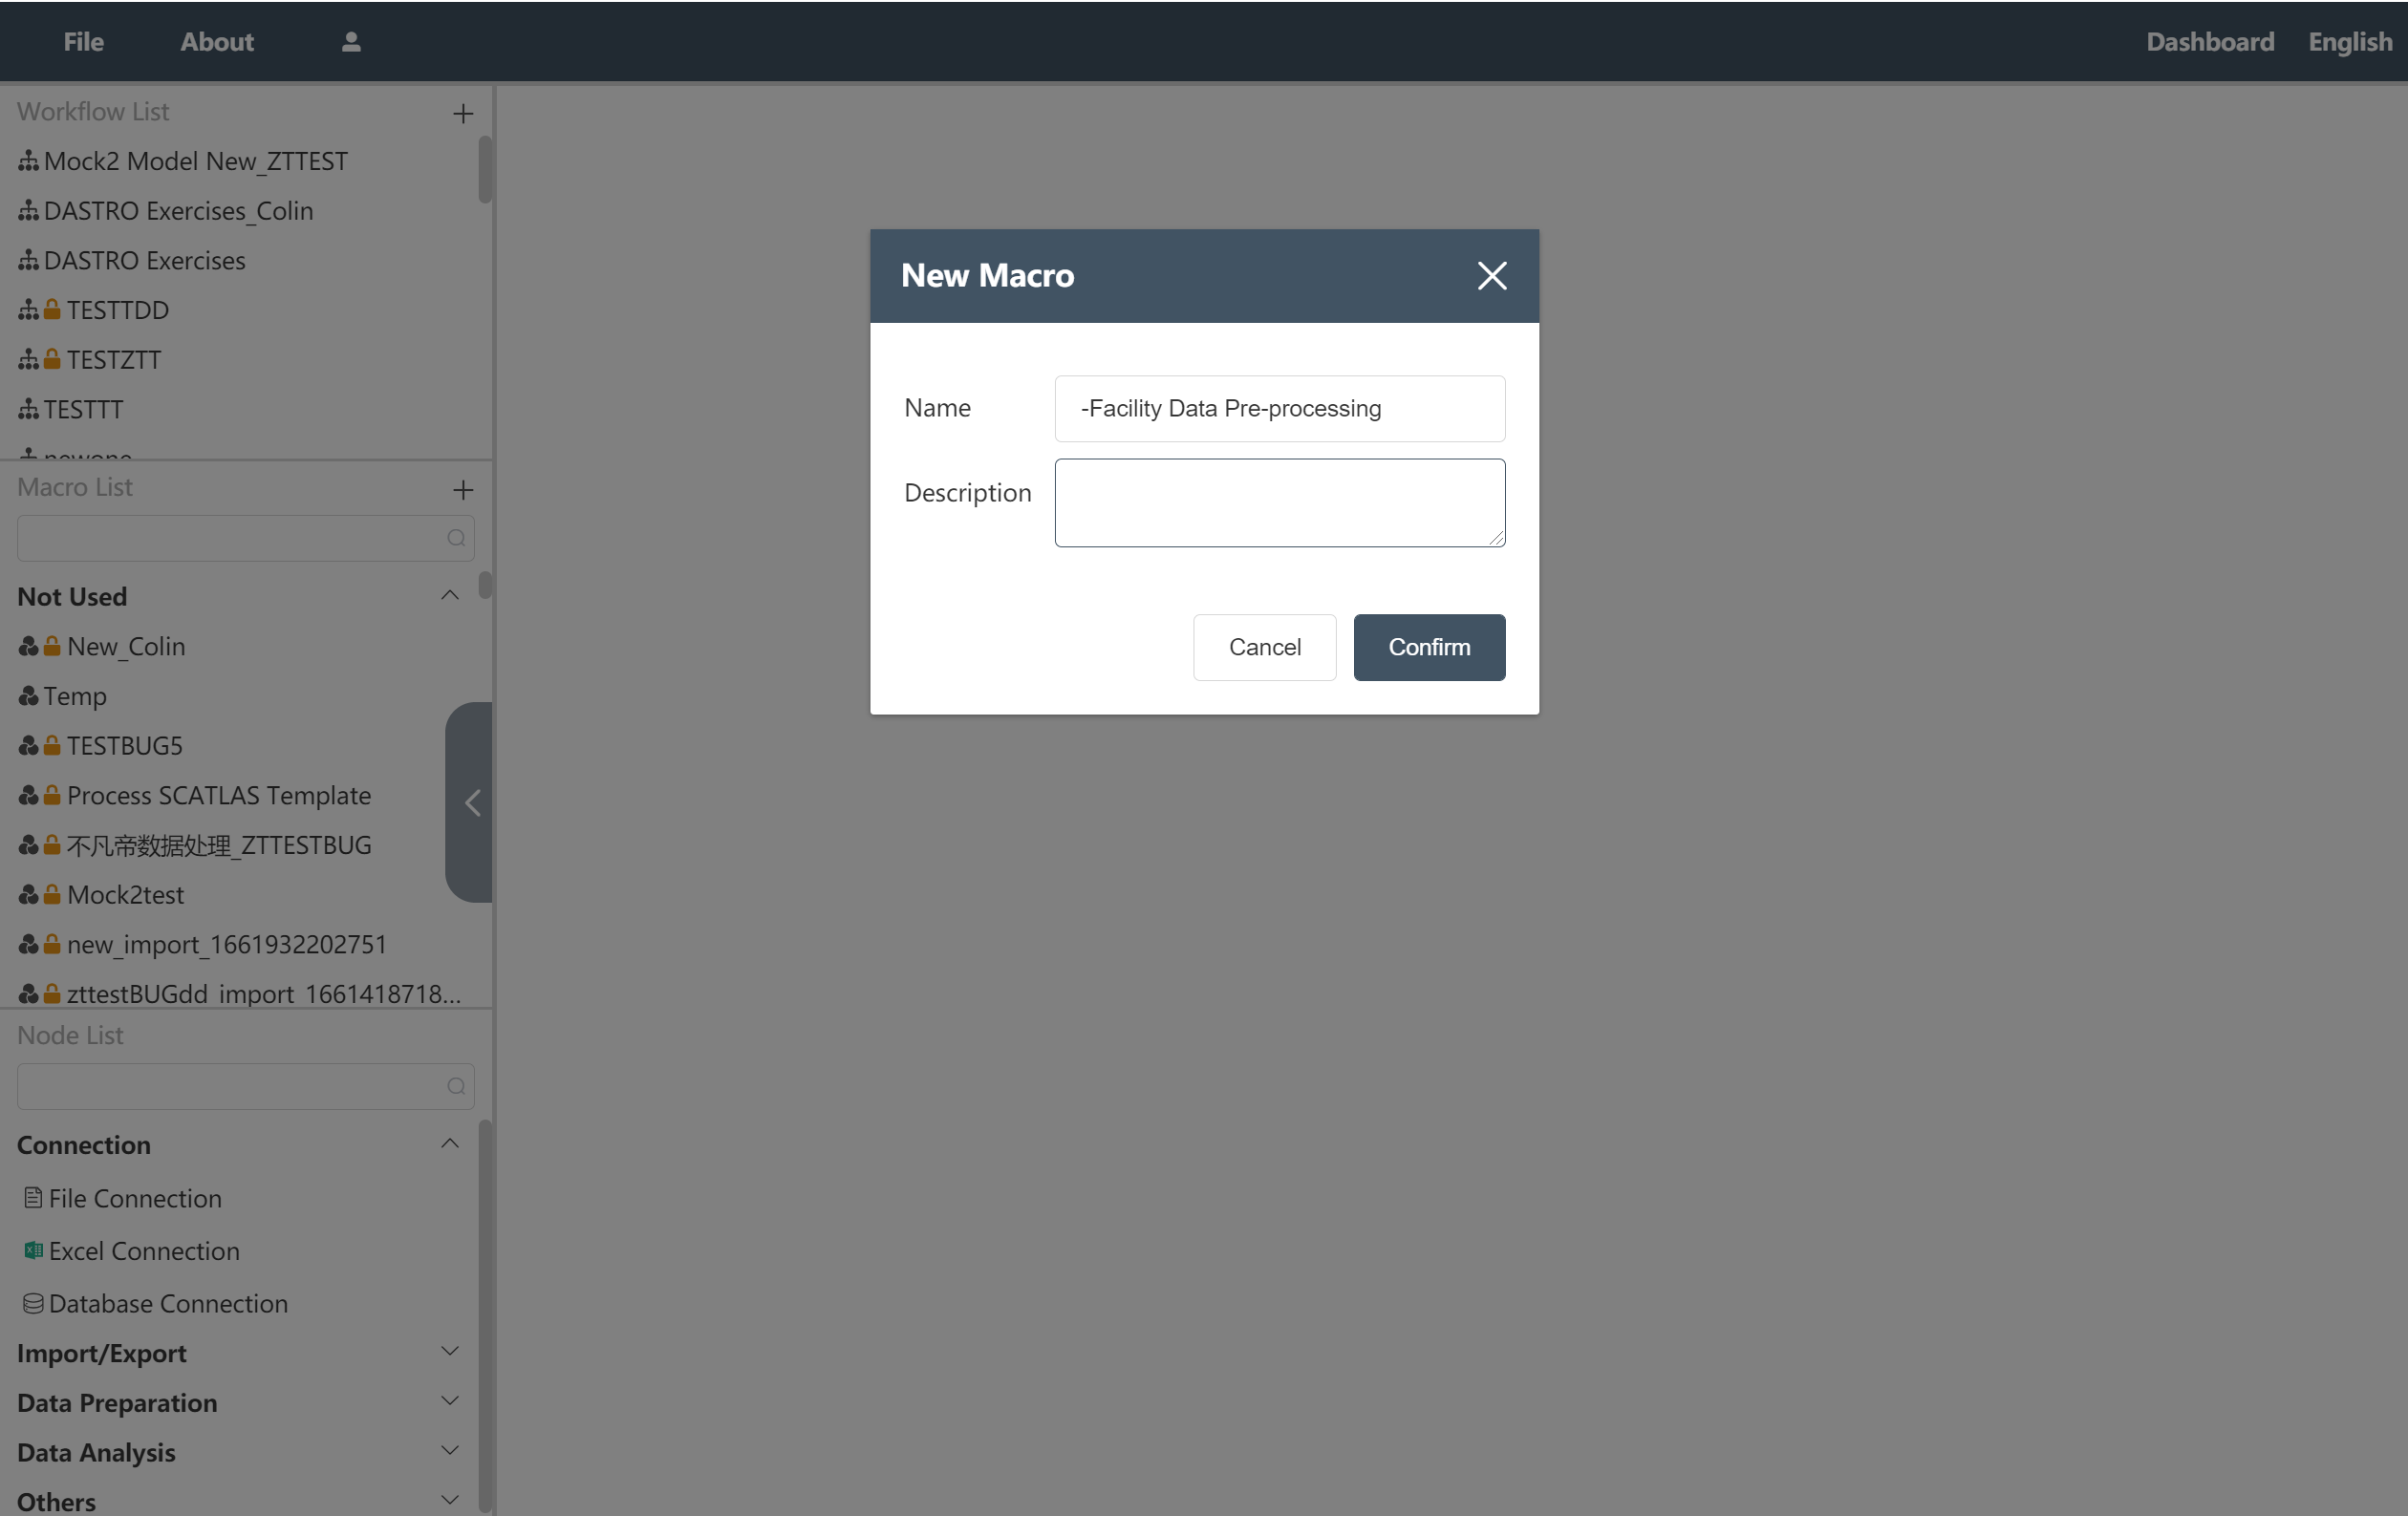
Figure 2.2 Create a new node group
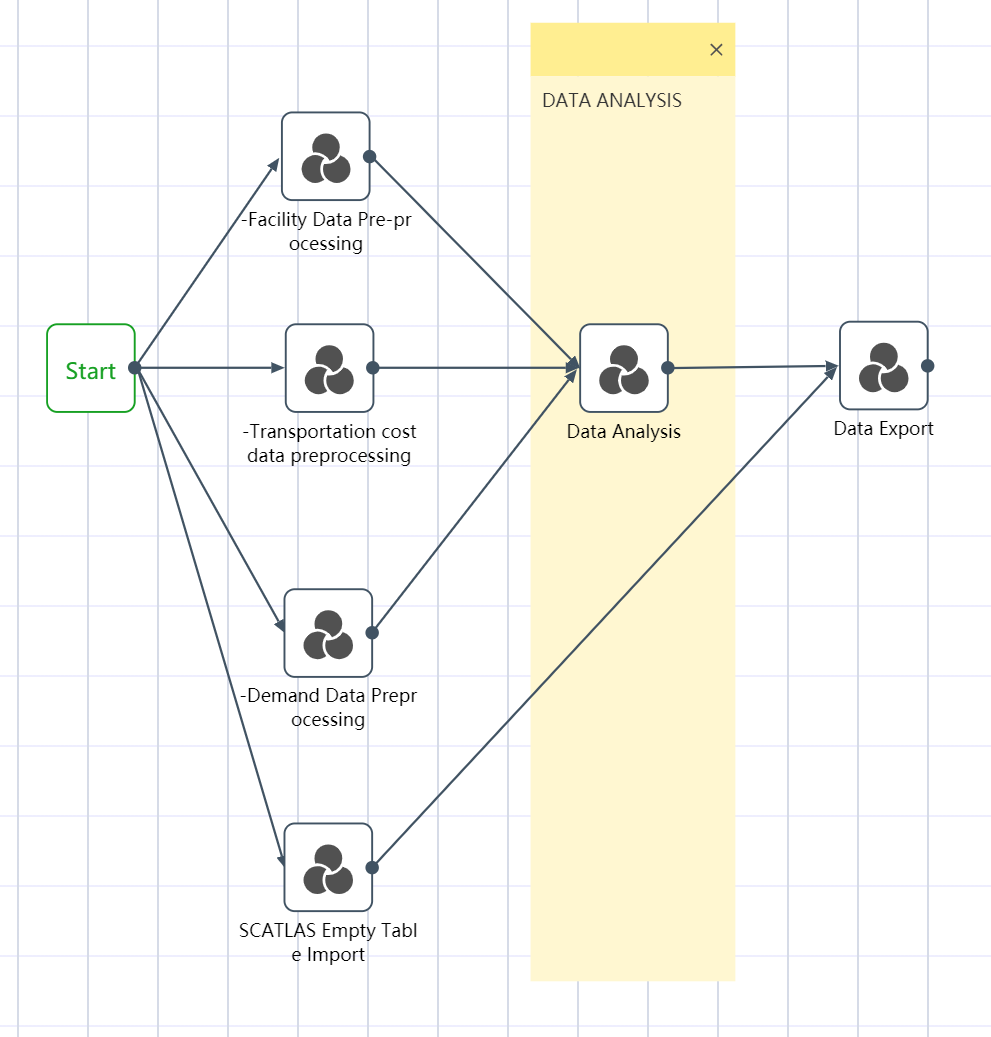
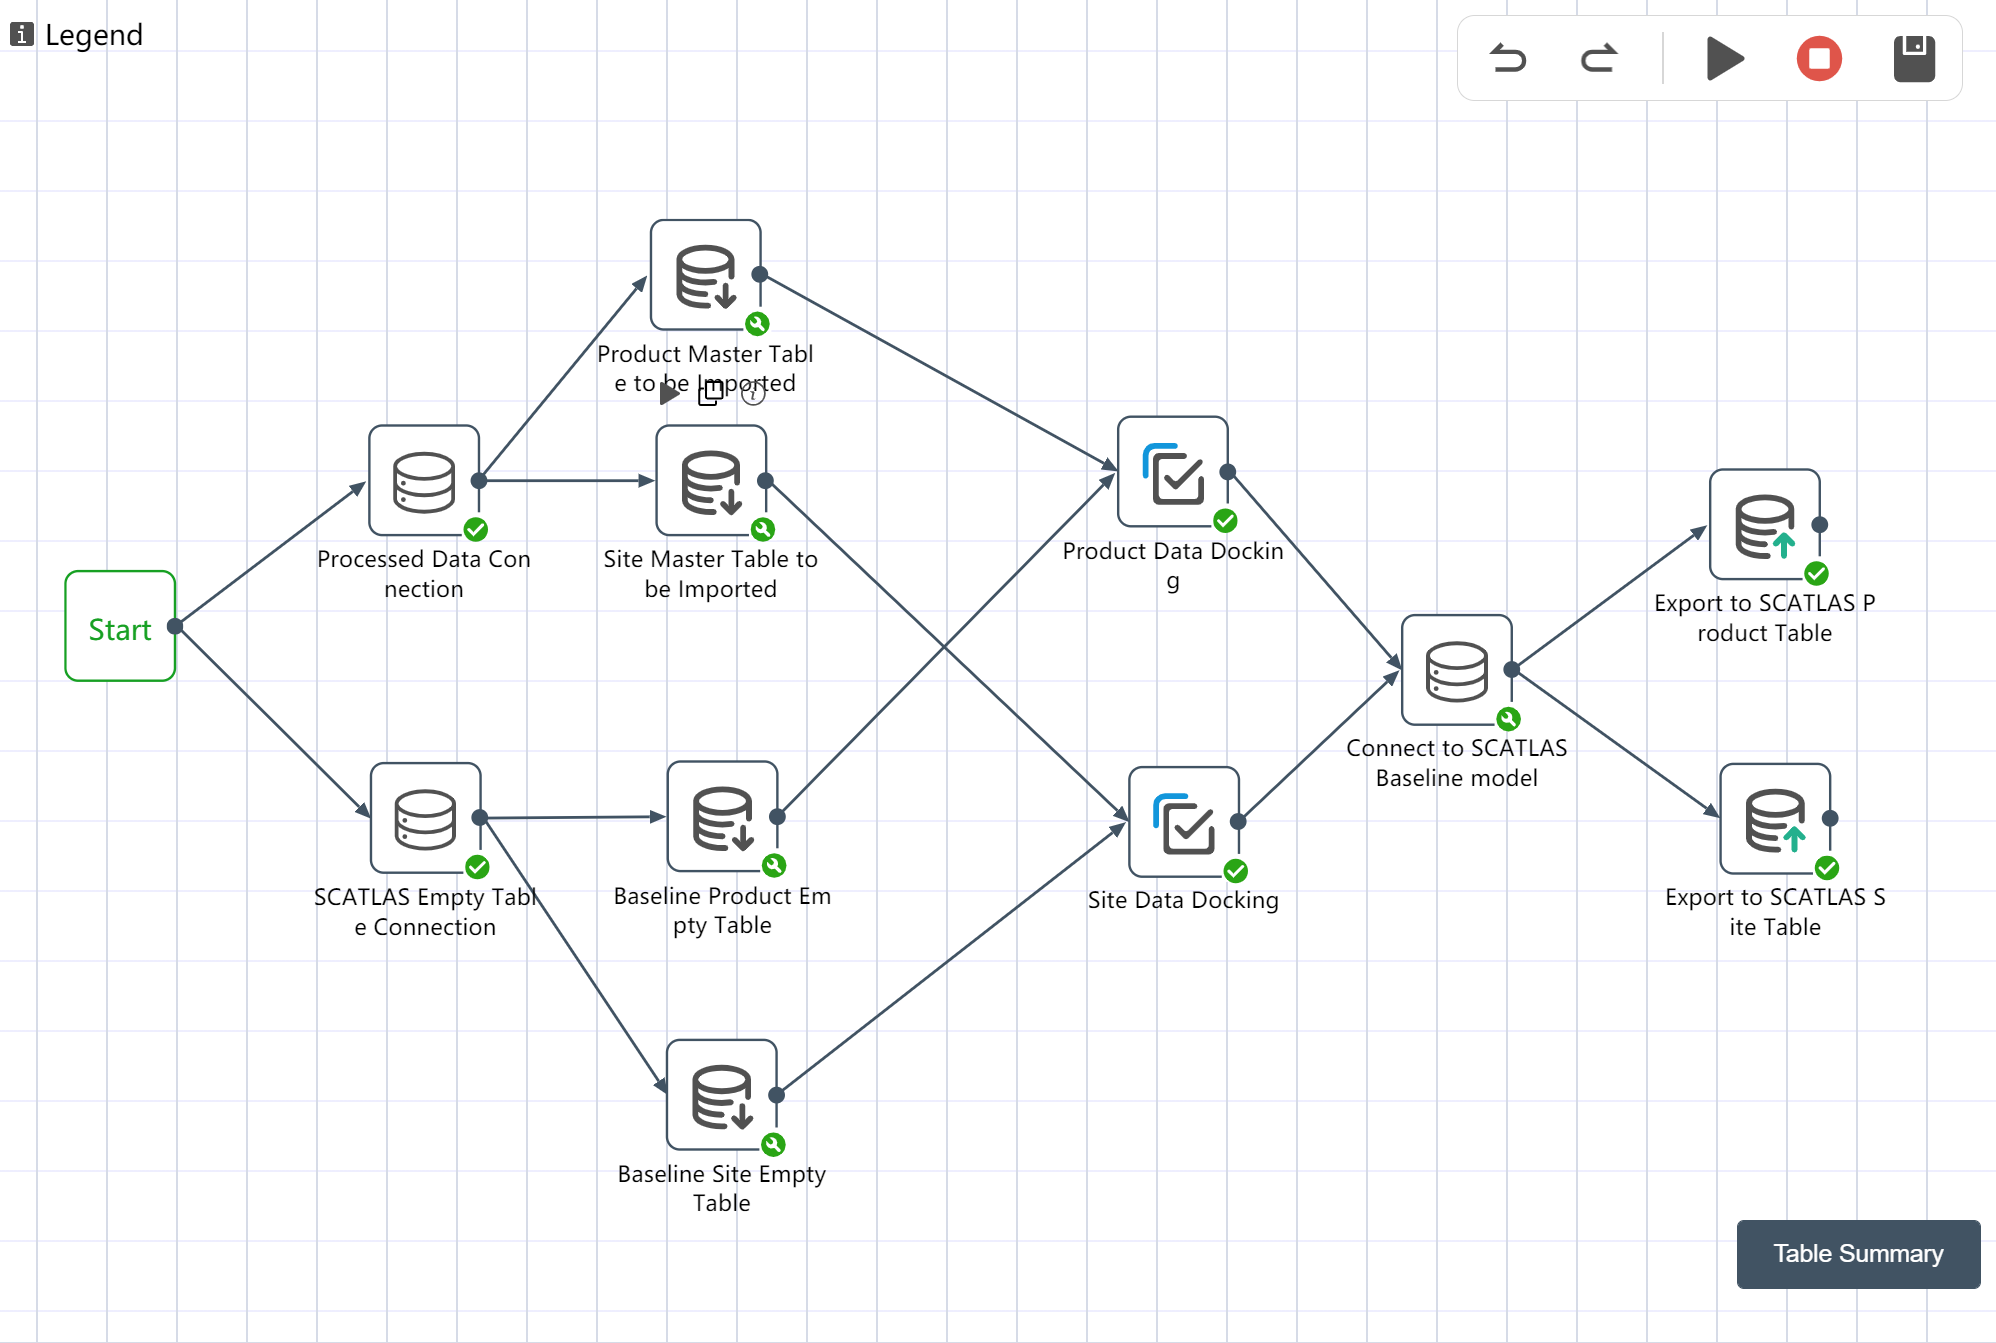
The operation is complete, and the workflow canvas is shown in the following figure.
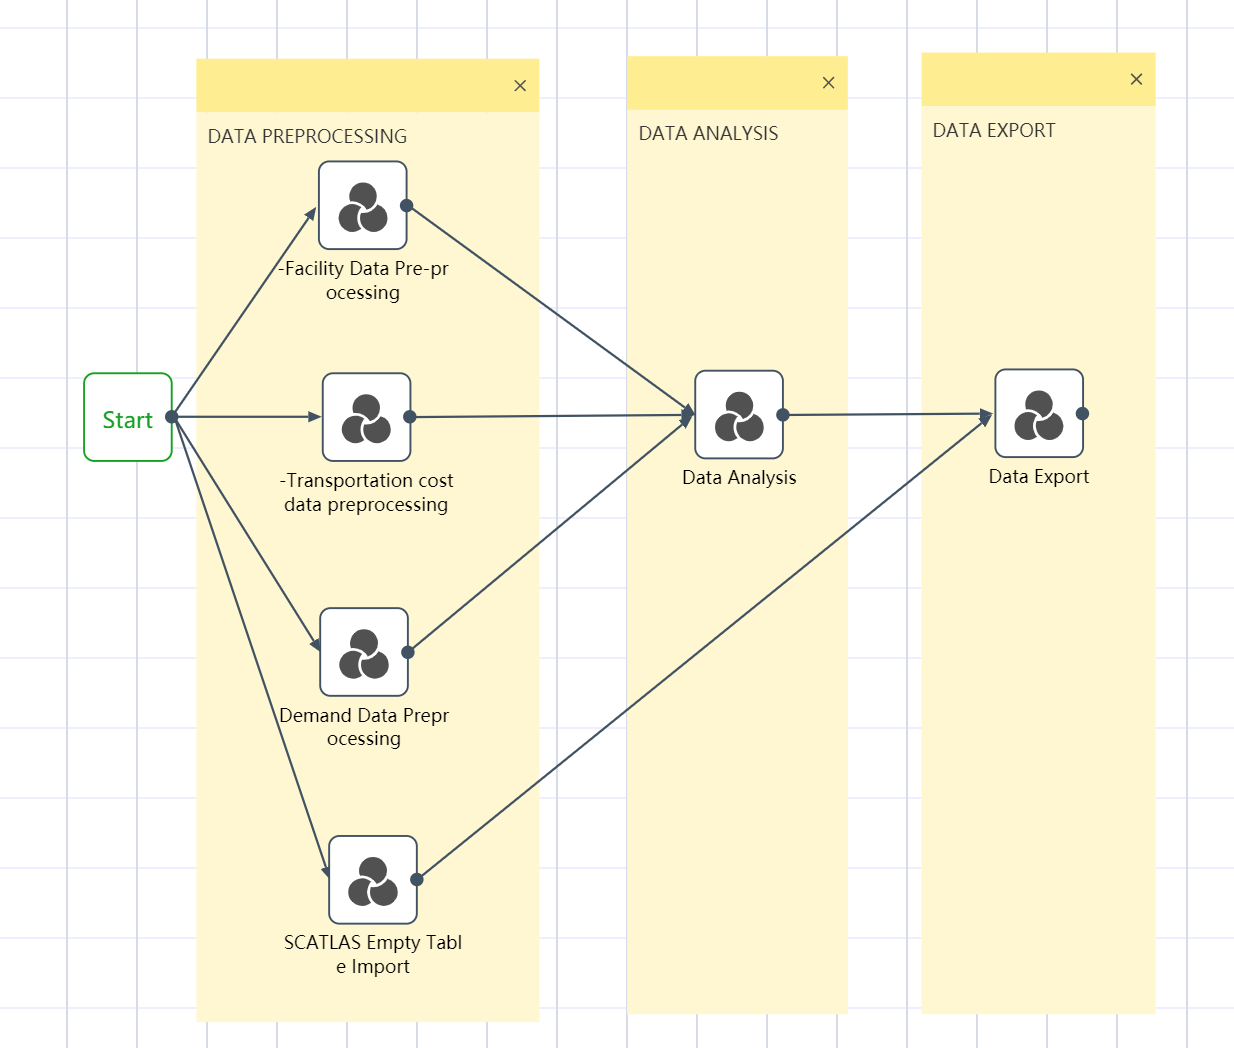
Figure 2.3 DASTRO® Workflow and Main Steps
# Step 1: Data import and preprocessing
 Perform data import and data cleaning in the data import and preprocessing node group:
First import the raw data stored in each Excel; then data cleaning and preprocessing can be done on the raw data; for example, adding/deleting rows/columns, modifying data types, modifying data values, etc.; Process the data, connect to SCATLAS®, and import the empty table of the model that needs to be used.
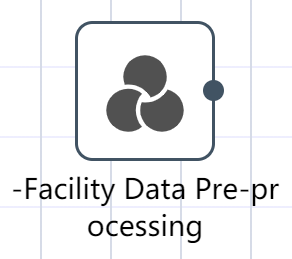
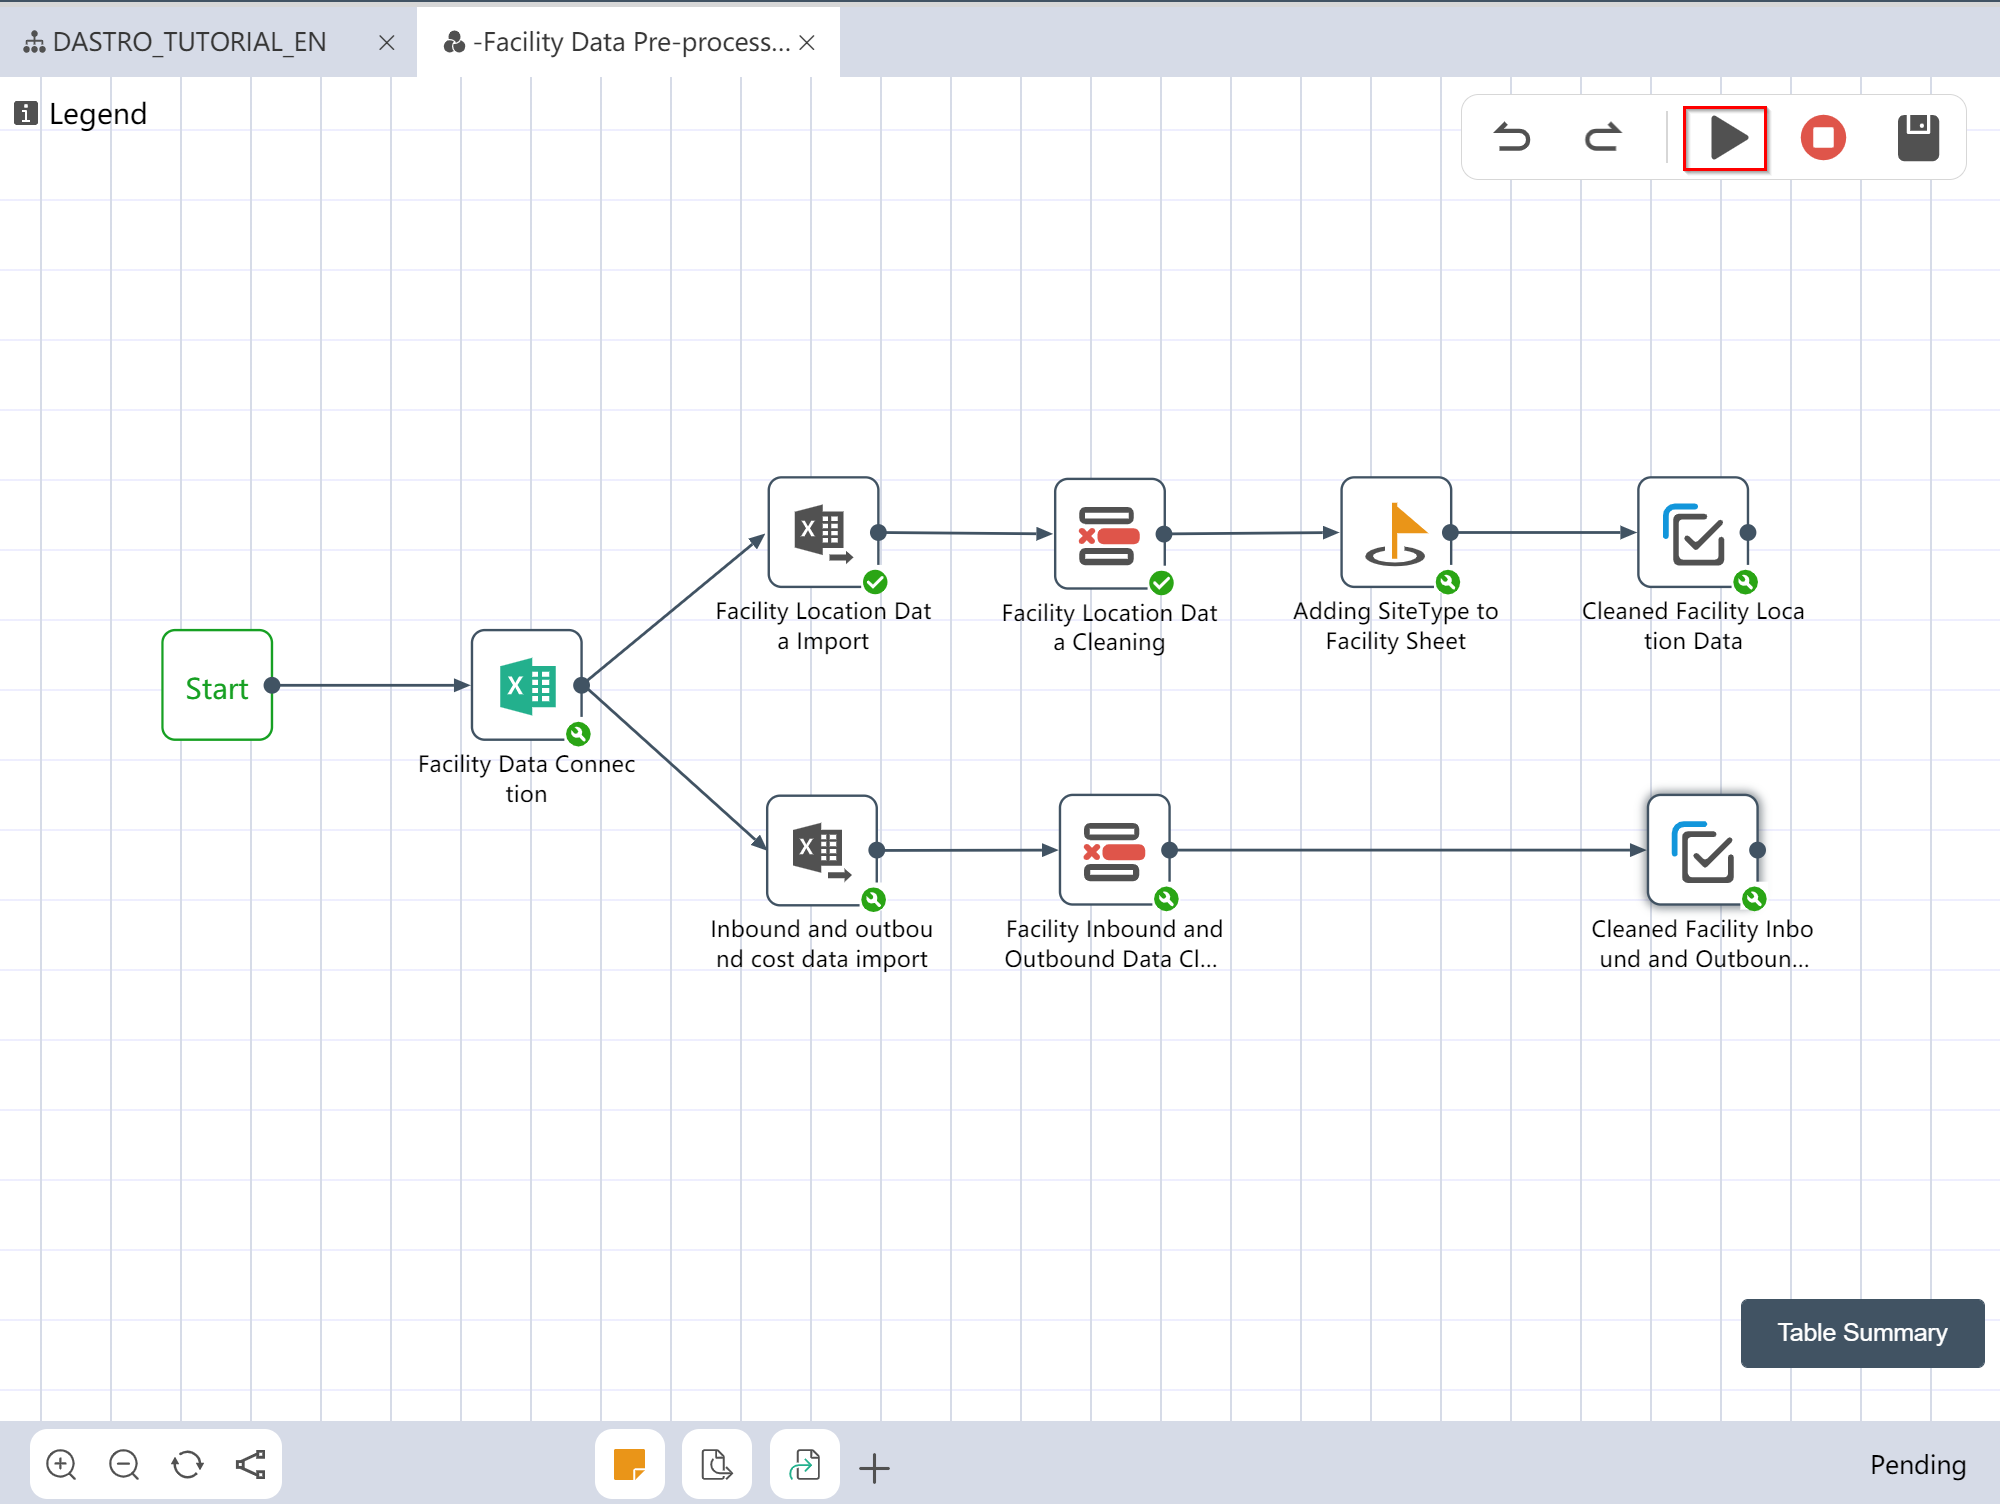
# Node group 1: Factory Data Pre-processing
 :
: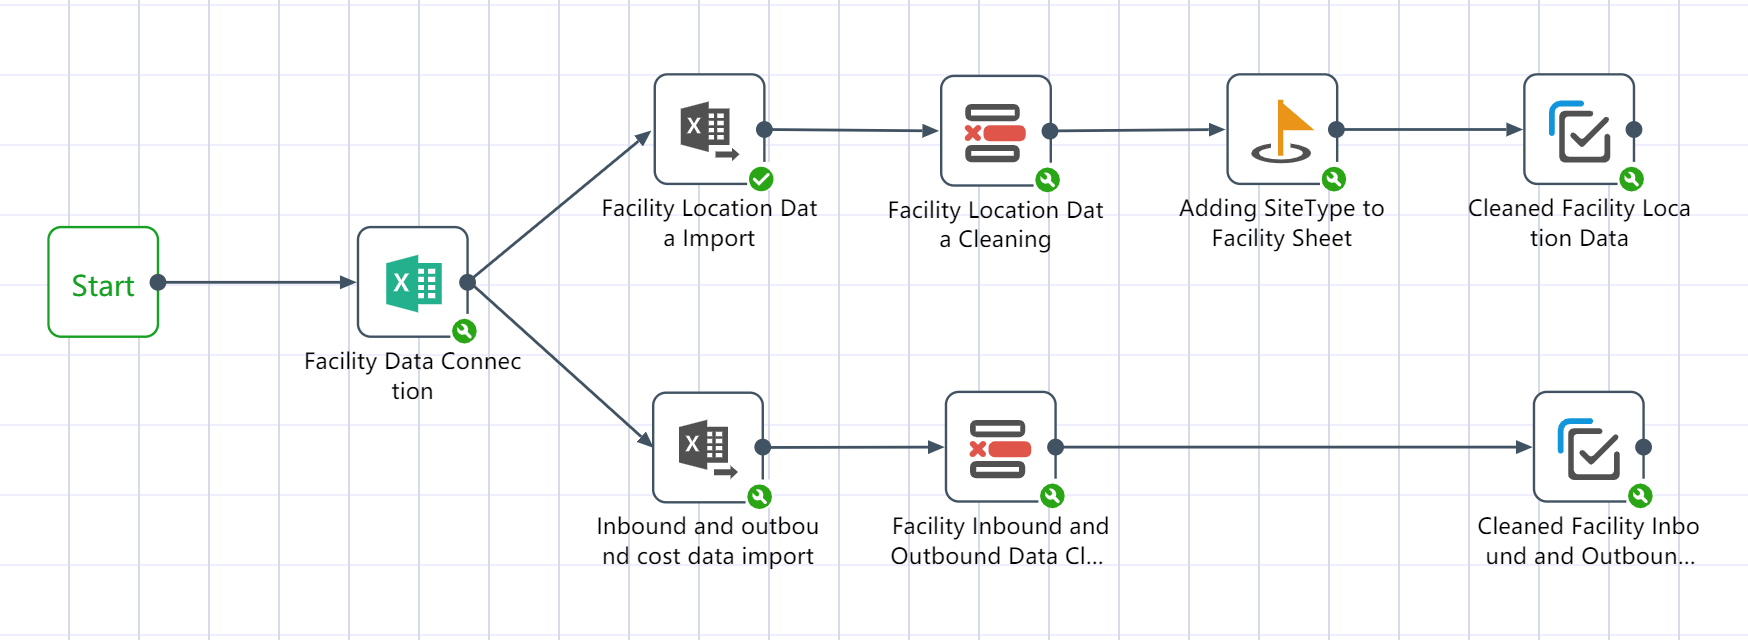
After the node group is completed, two output tables will be obtained: the location data of the cleaned factory warehouse, and the cost data of the cleaned facility inbound and outbound.
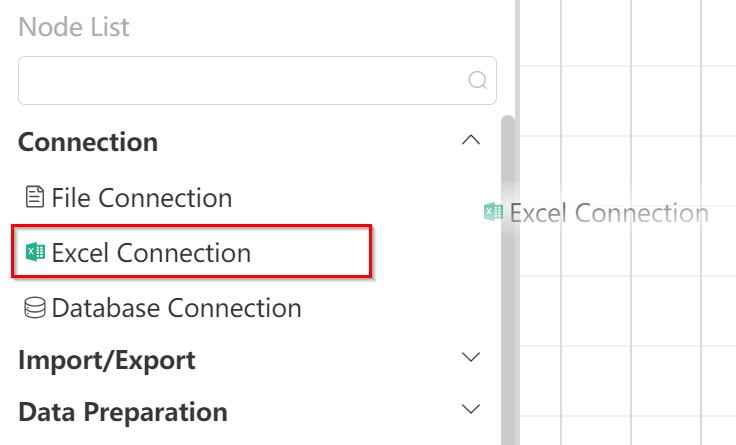
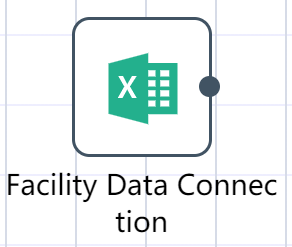
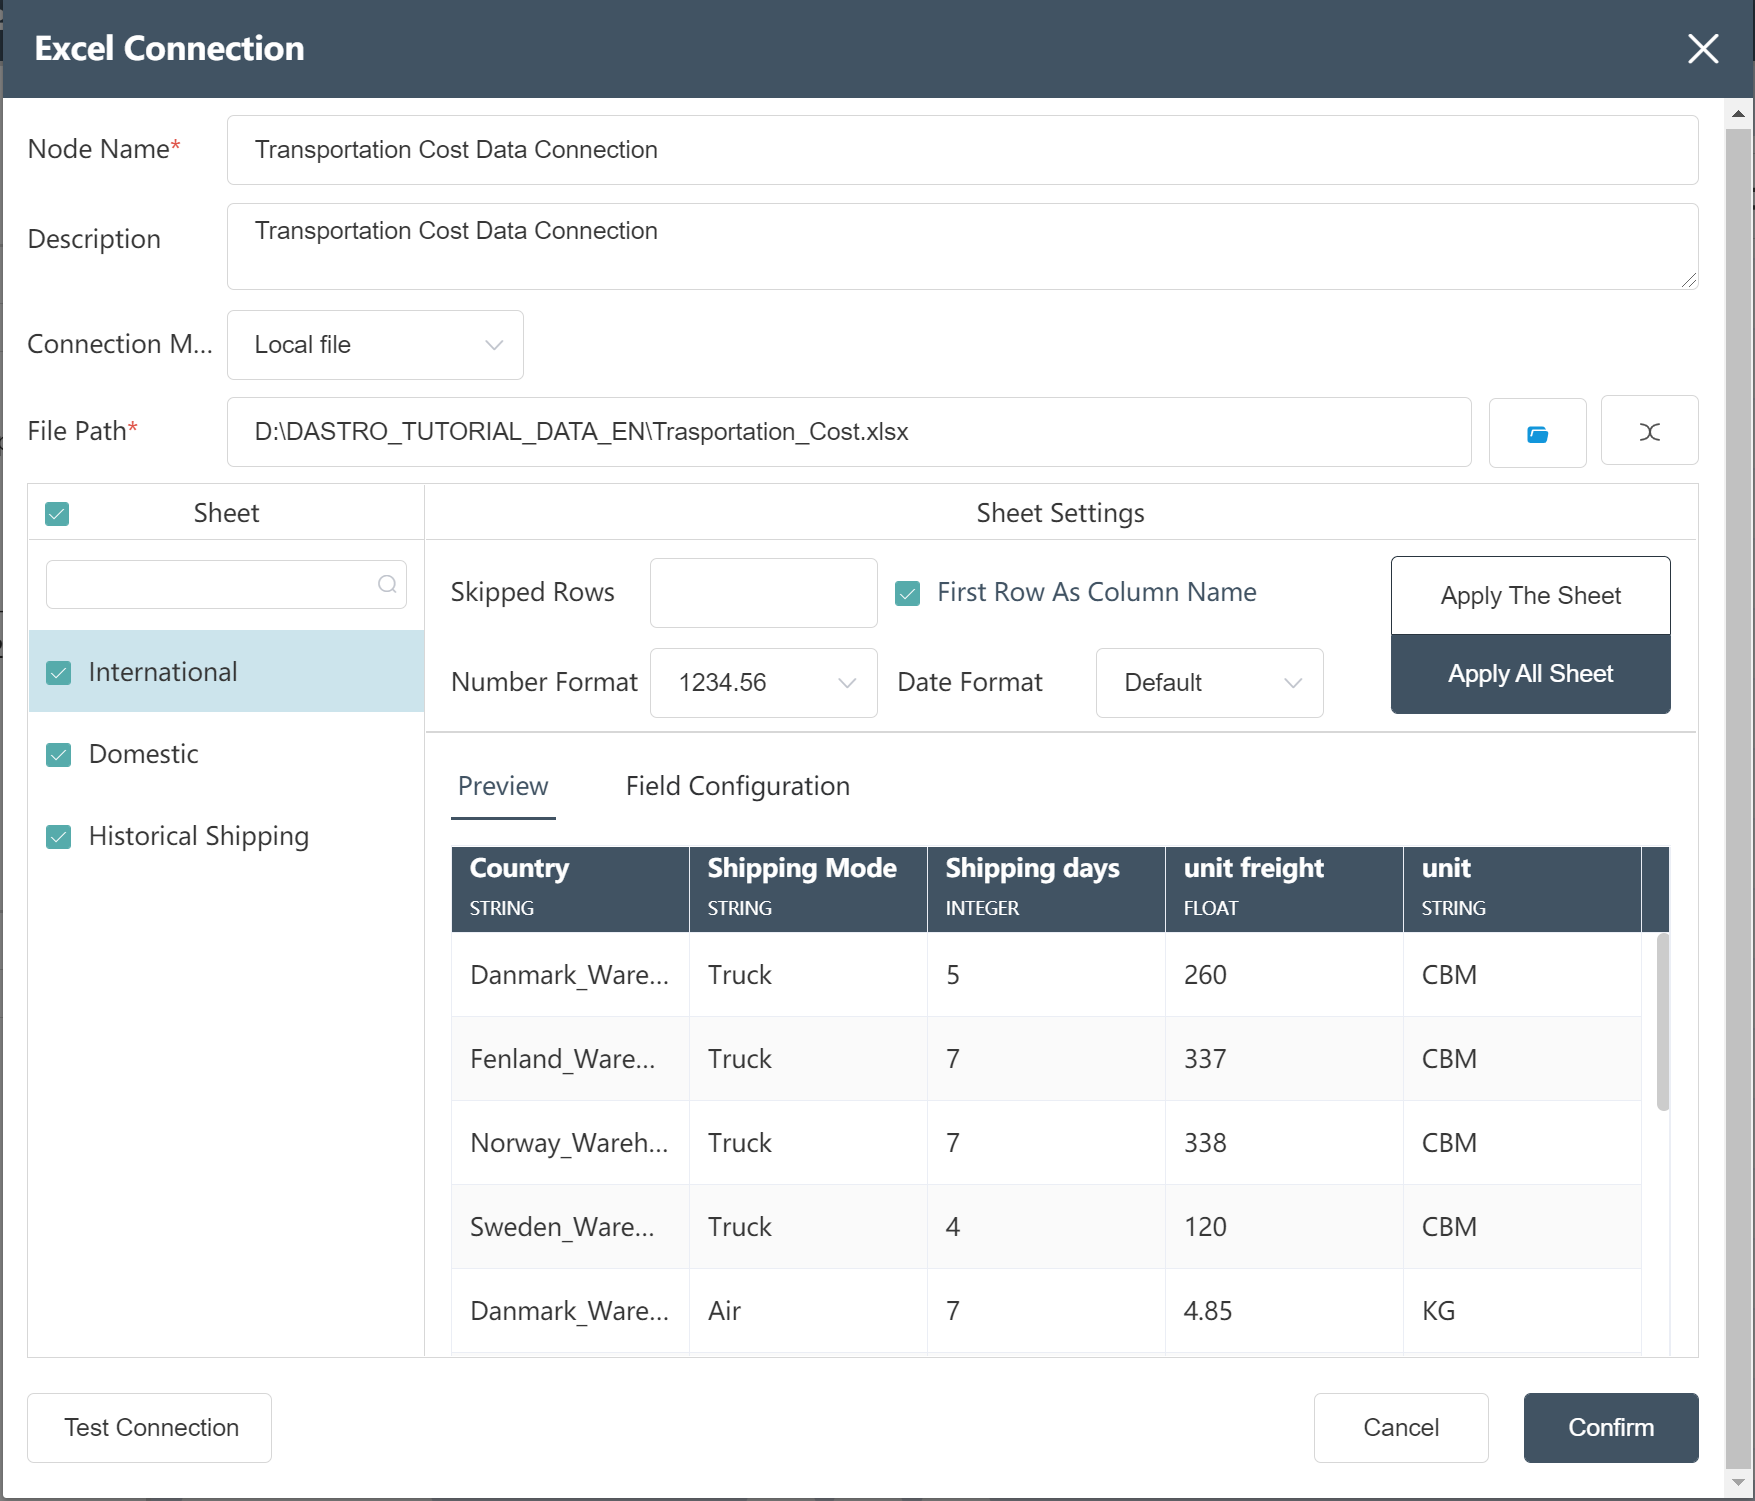
# New node: Facility Data Connection
- Double-click a node group to open the node group canvas
- Double-click/drag the node [Excel Connection] to the editing area
- custom node name
- Select the file path (file: Facility information)
- Set the number of skipped rows, number format, date format, and check "Apply this sheet" or "Apply all sheets" to determine the application range of this group of settings
- Check the Sheet table that needs to be used later
- Click Test Connection
- Click to confirm (you can check whether it is compared with the picture below before confirming)
- Connect the node to Start, hover over the node, and click Run
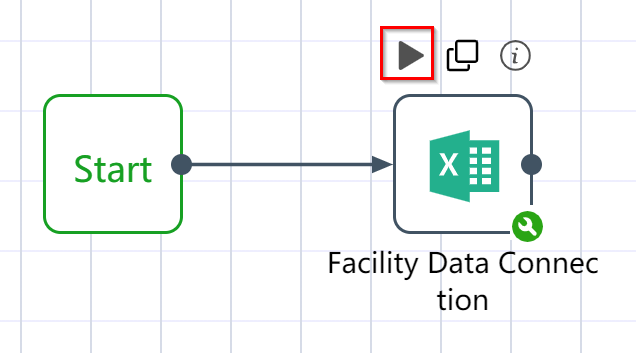
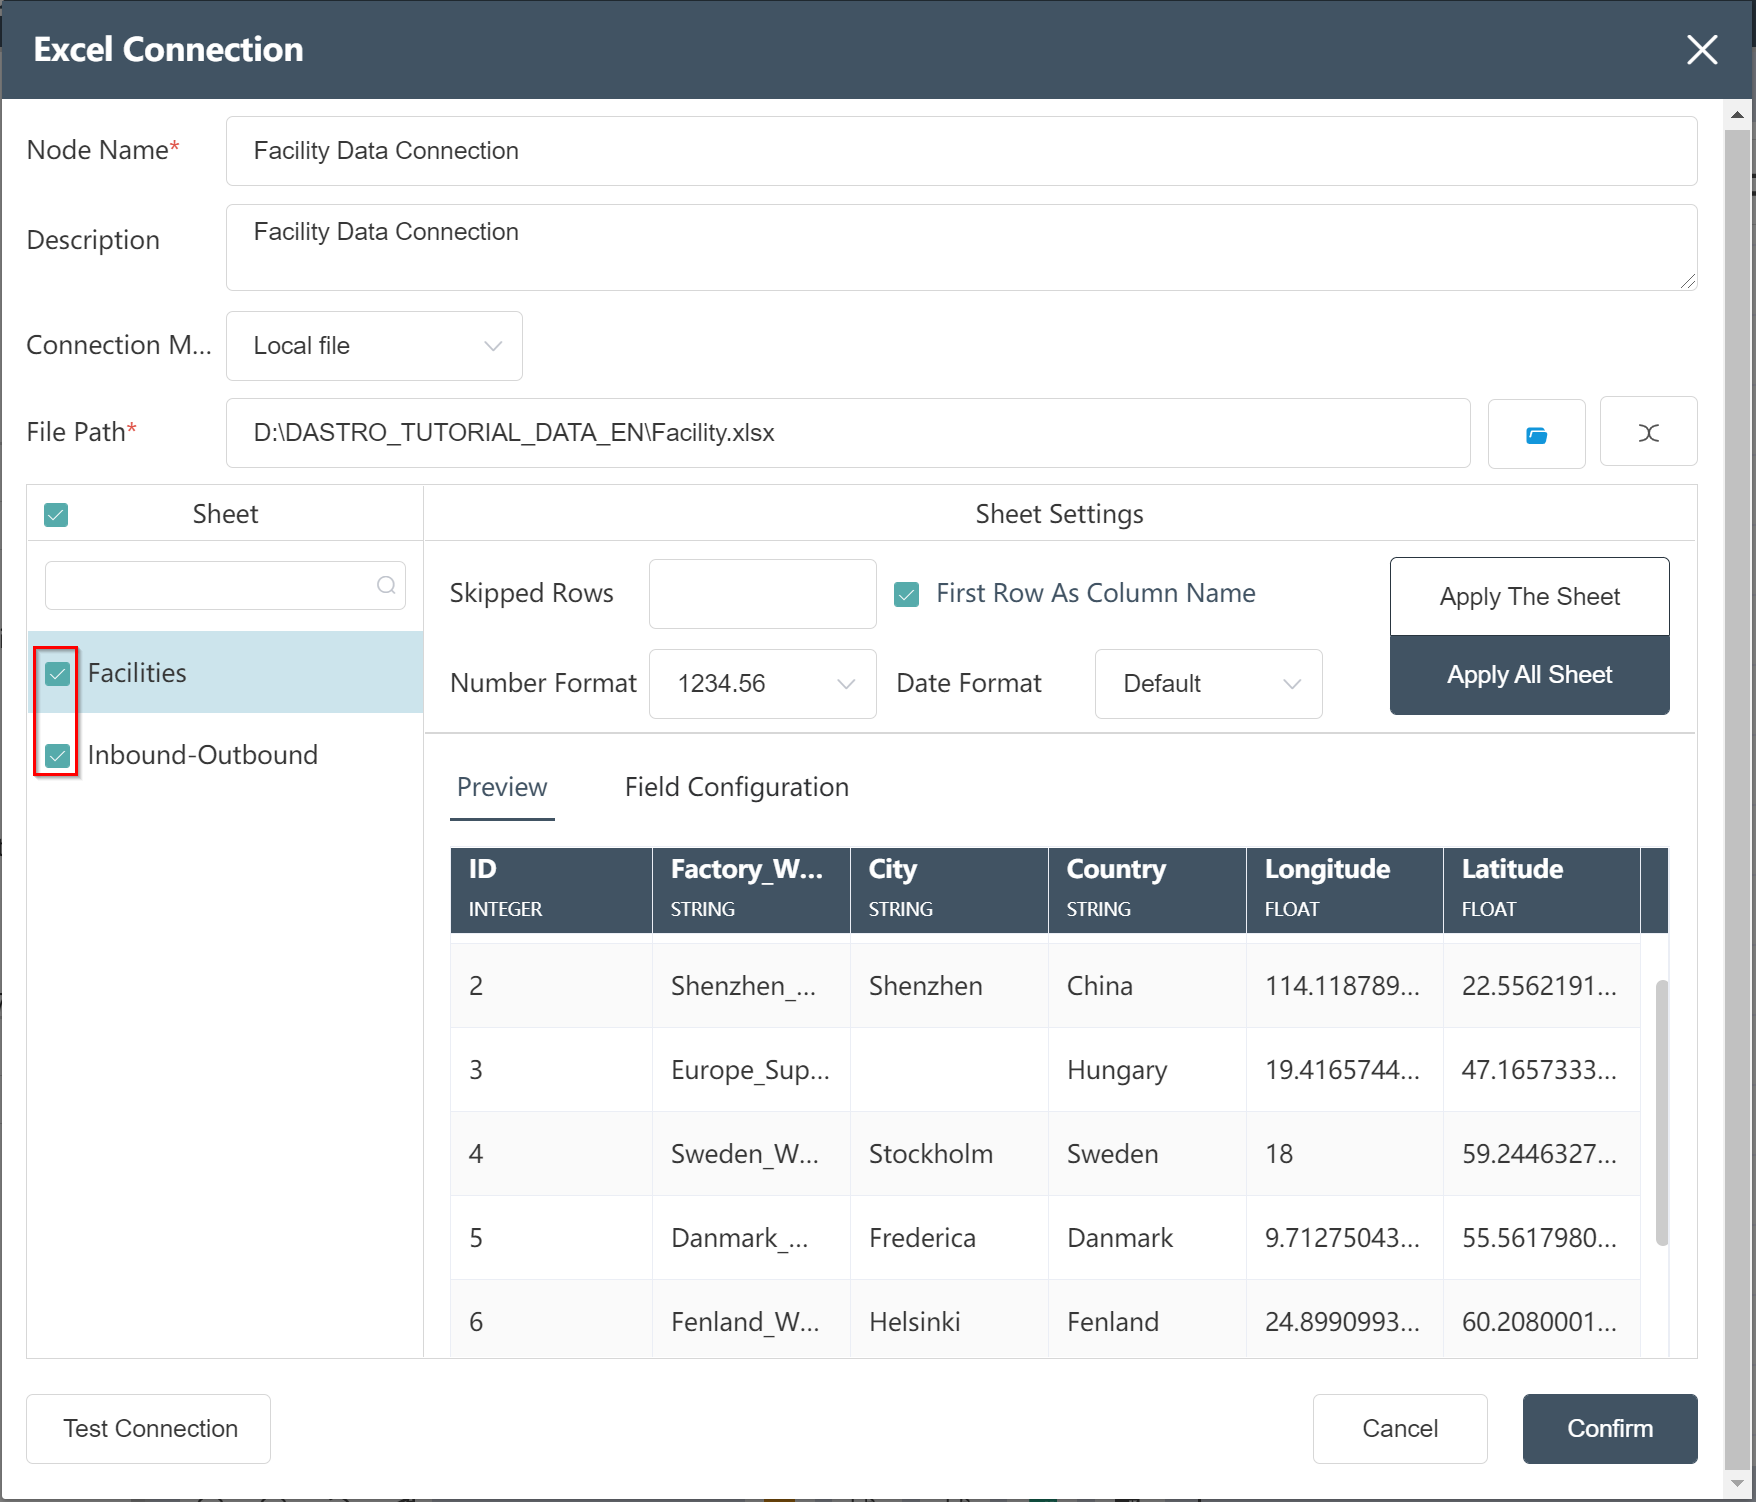
After the operation is completed, the connected Excel file can be previewed.
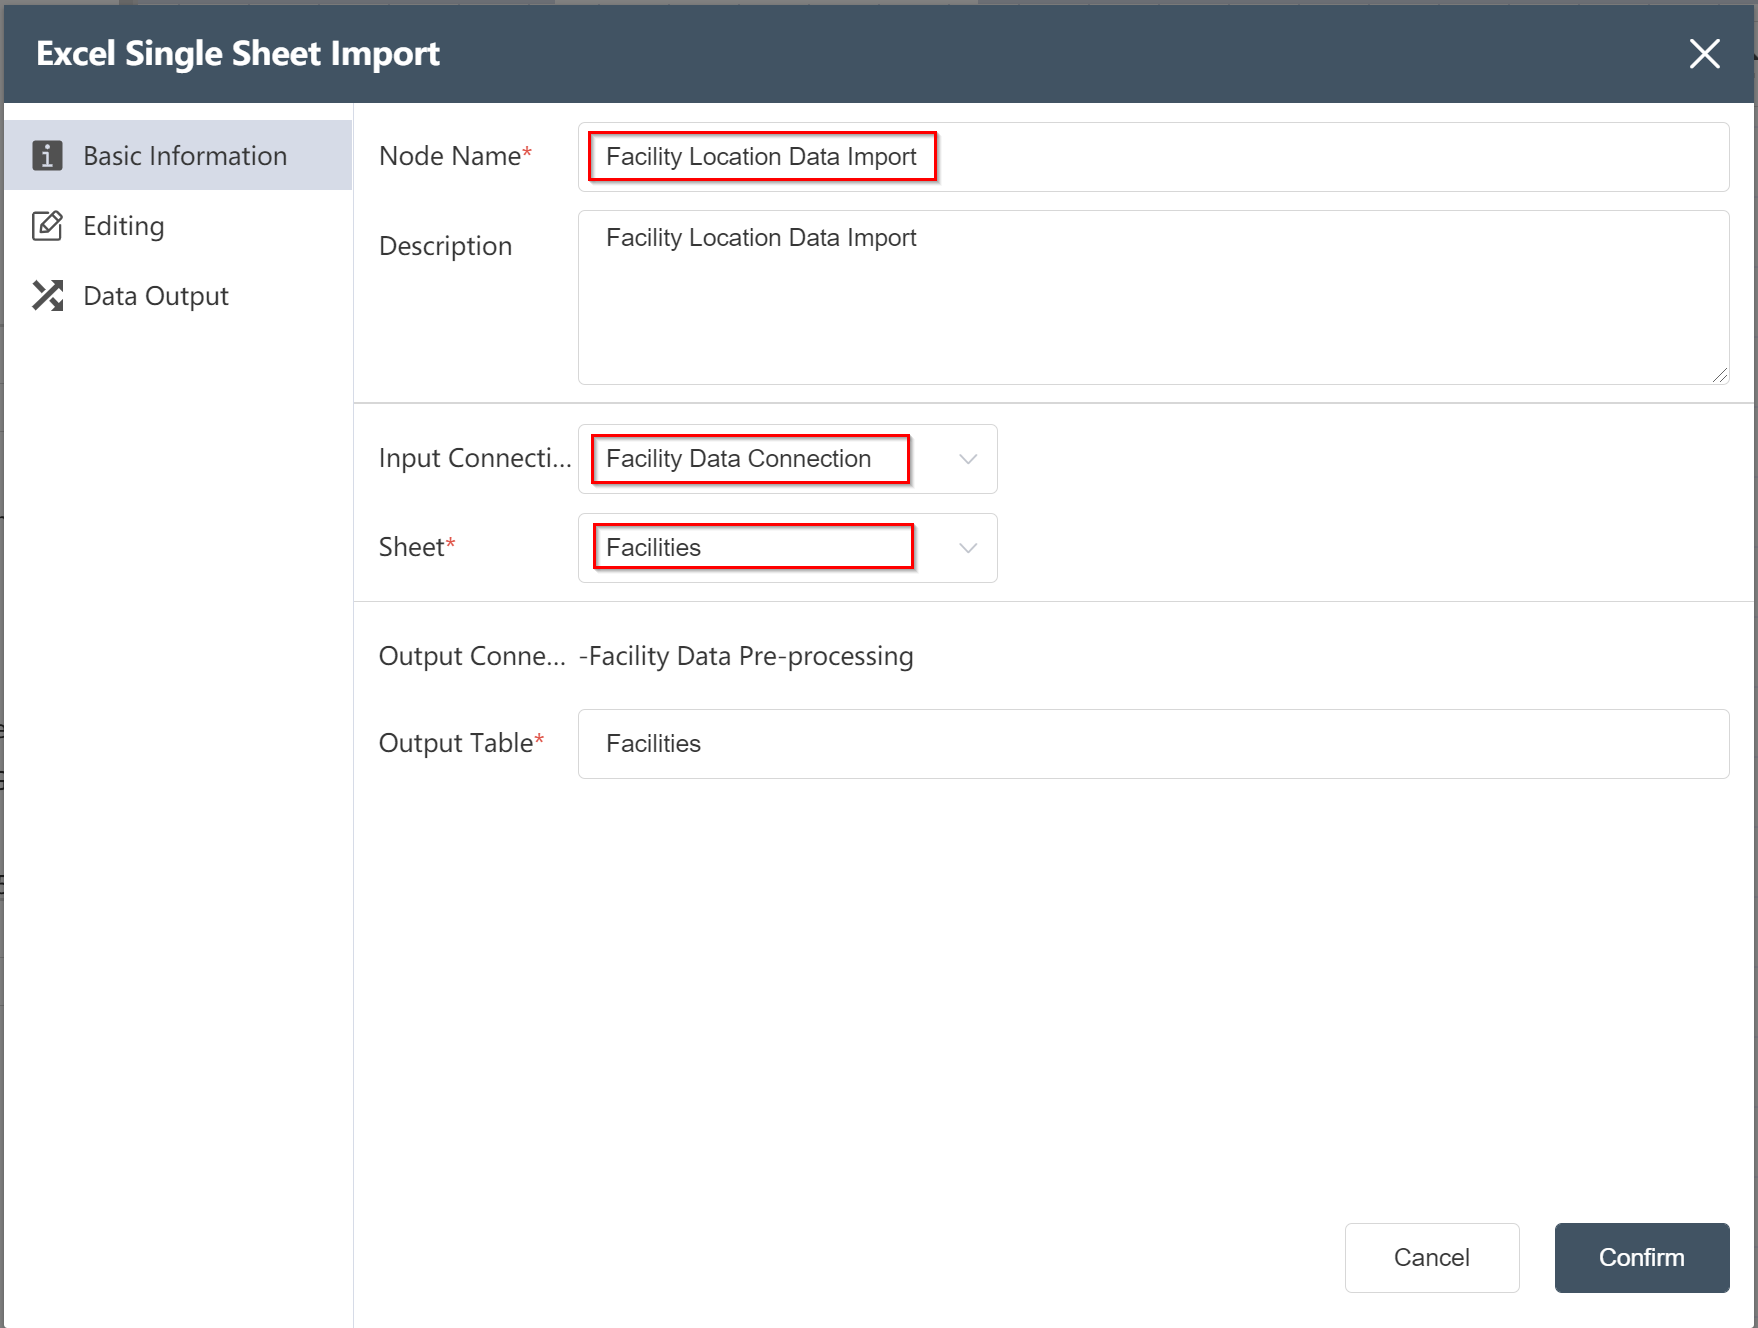
# New Node: Facility Location Data Import
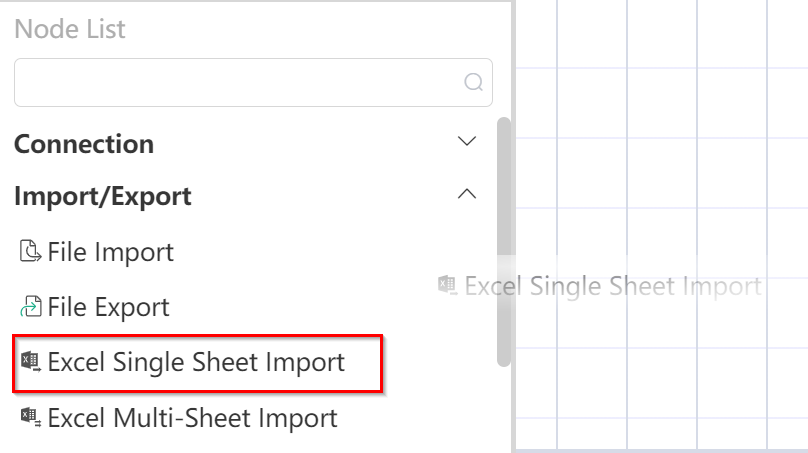 Double-click/drag the node [Excel Single Sheet Import] to the editing area
 custom node name
- Select input connection
- Select the corresponding Sheet1
- Fill in the form name (as shown below)
- Click to confirm
- Wire up the previous node and run the node
- After the operation is completed, the node is created and can be further edited.
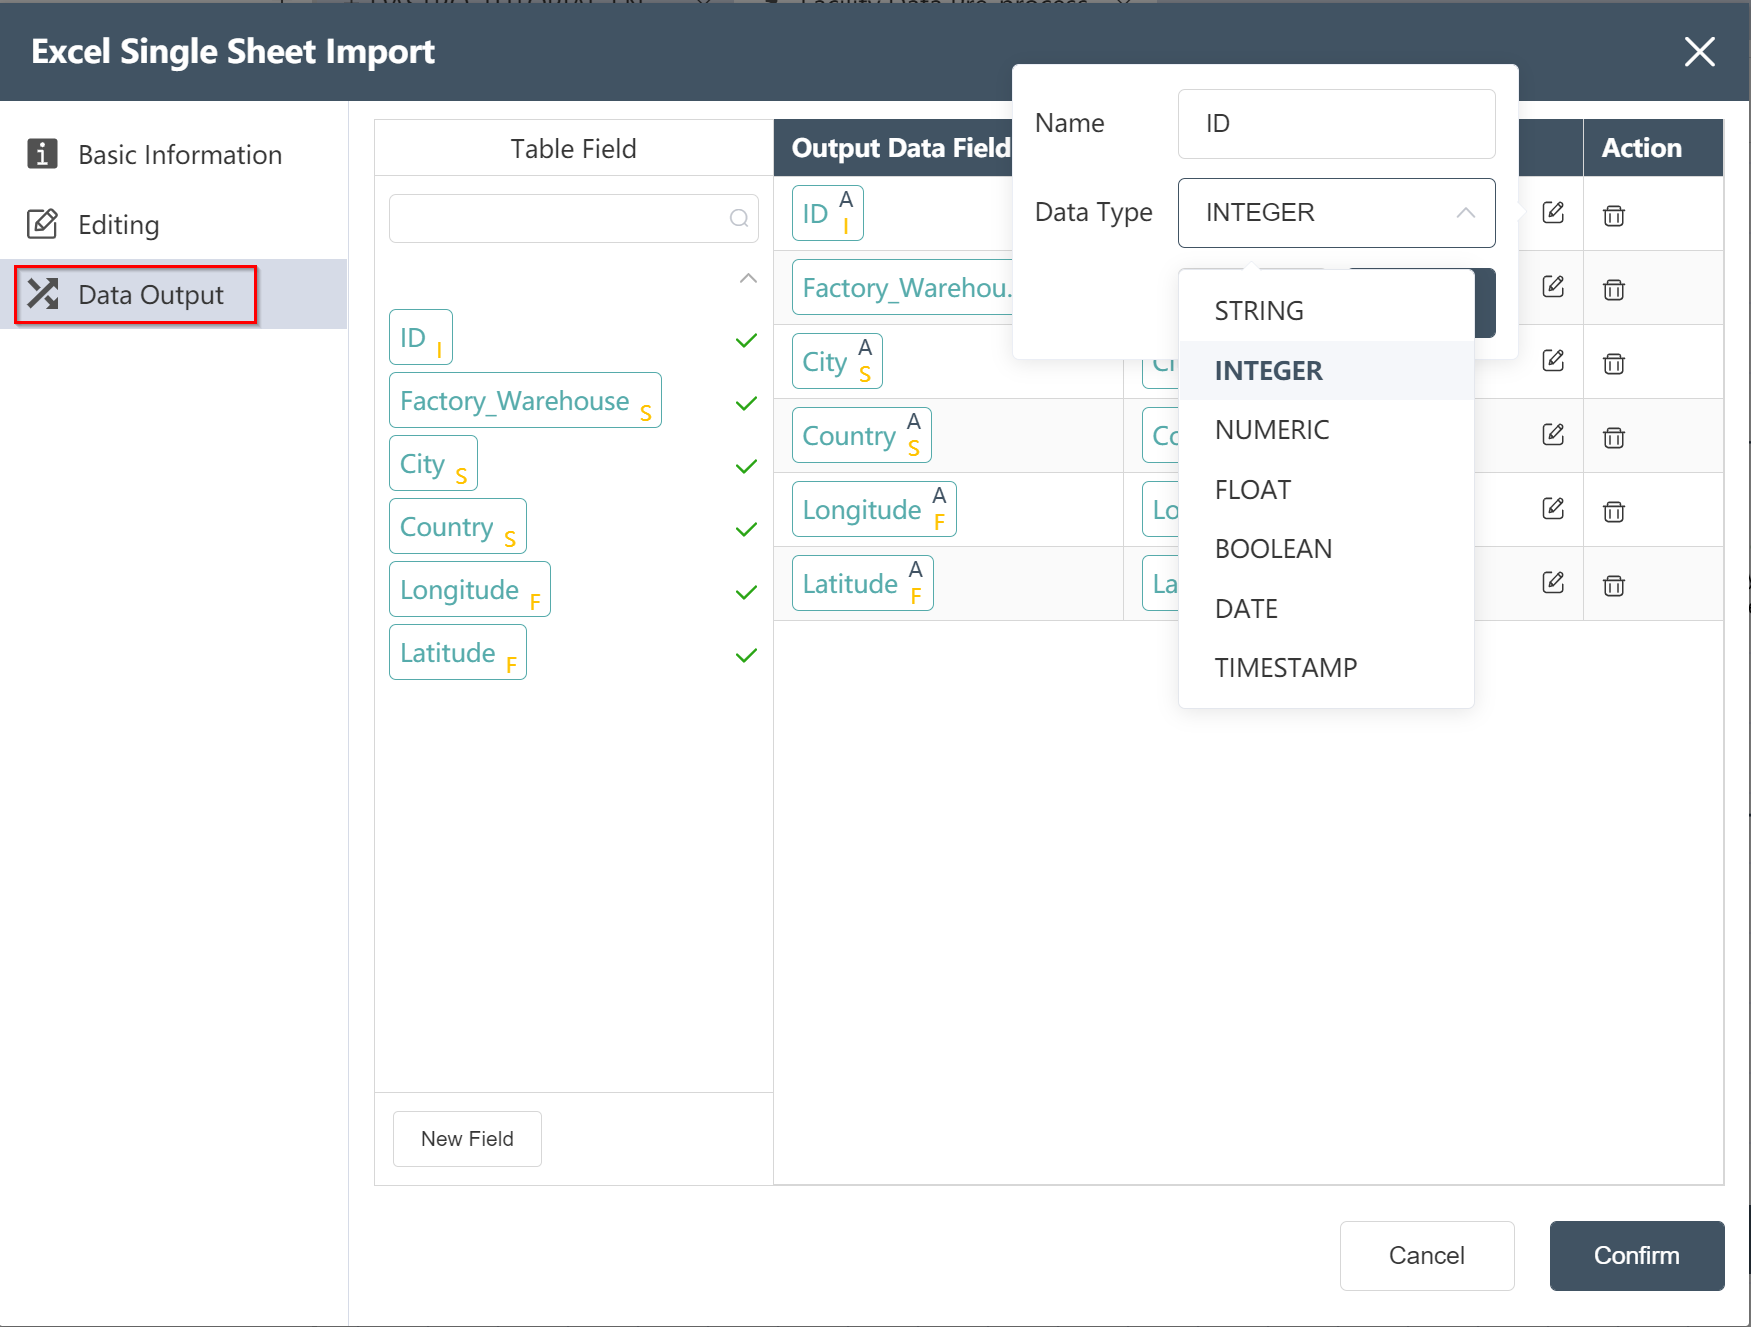
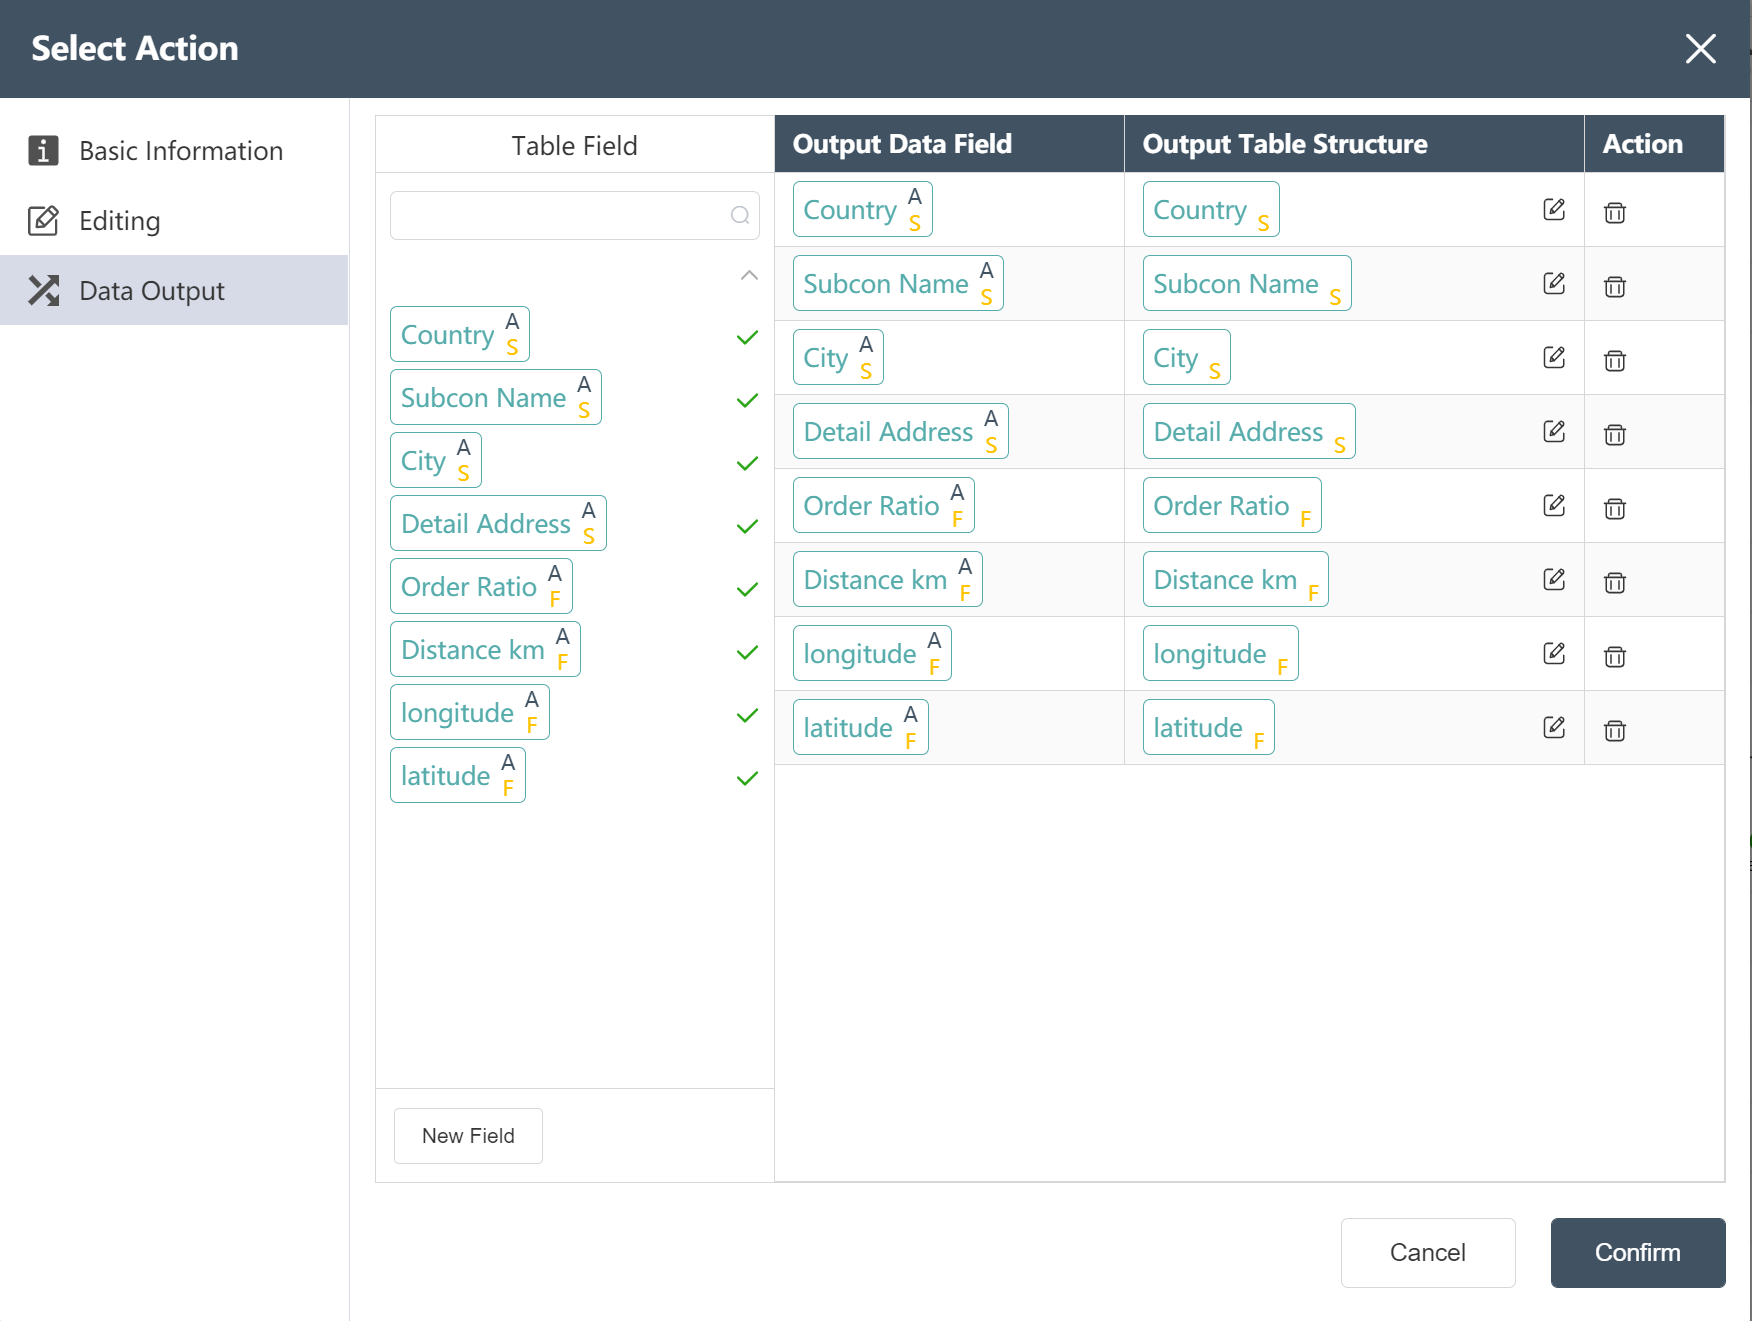
Edit Node: Facility Location Data Import
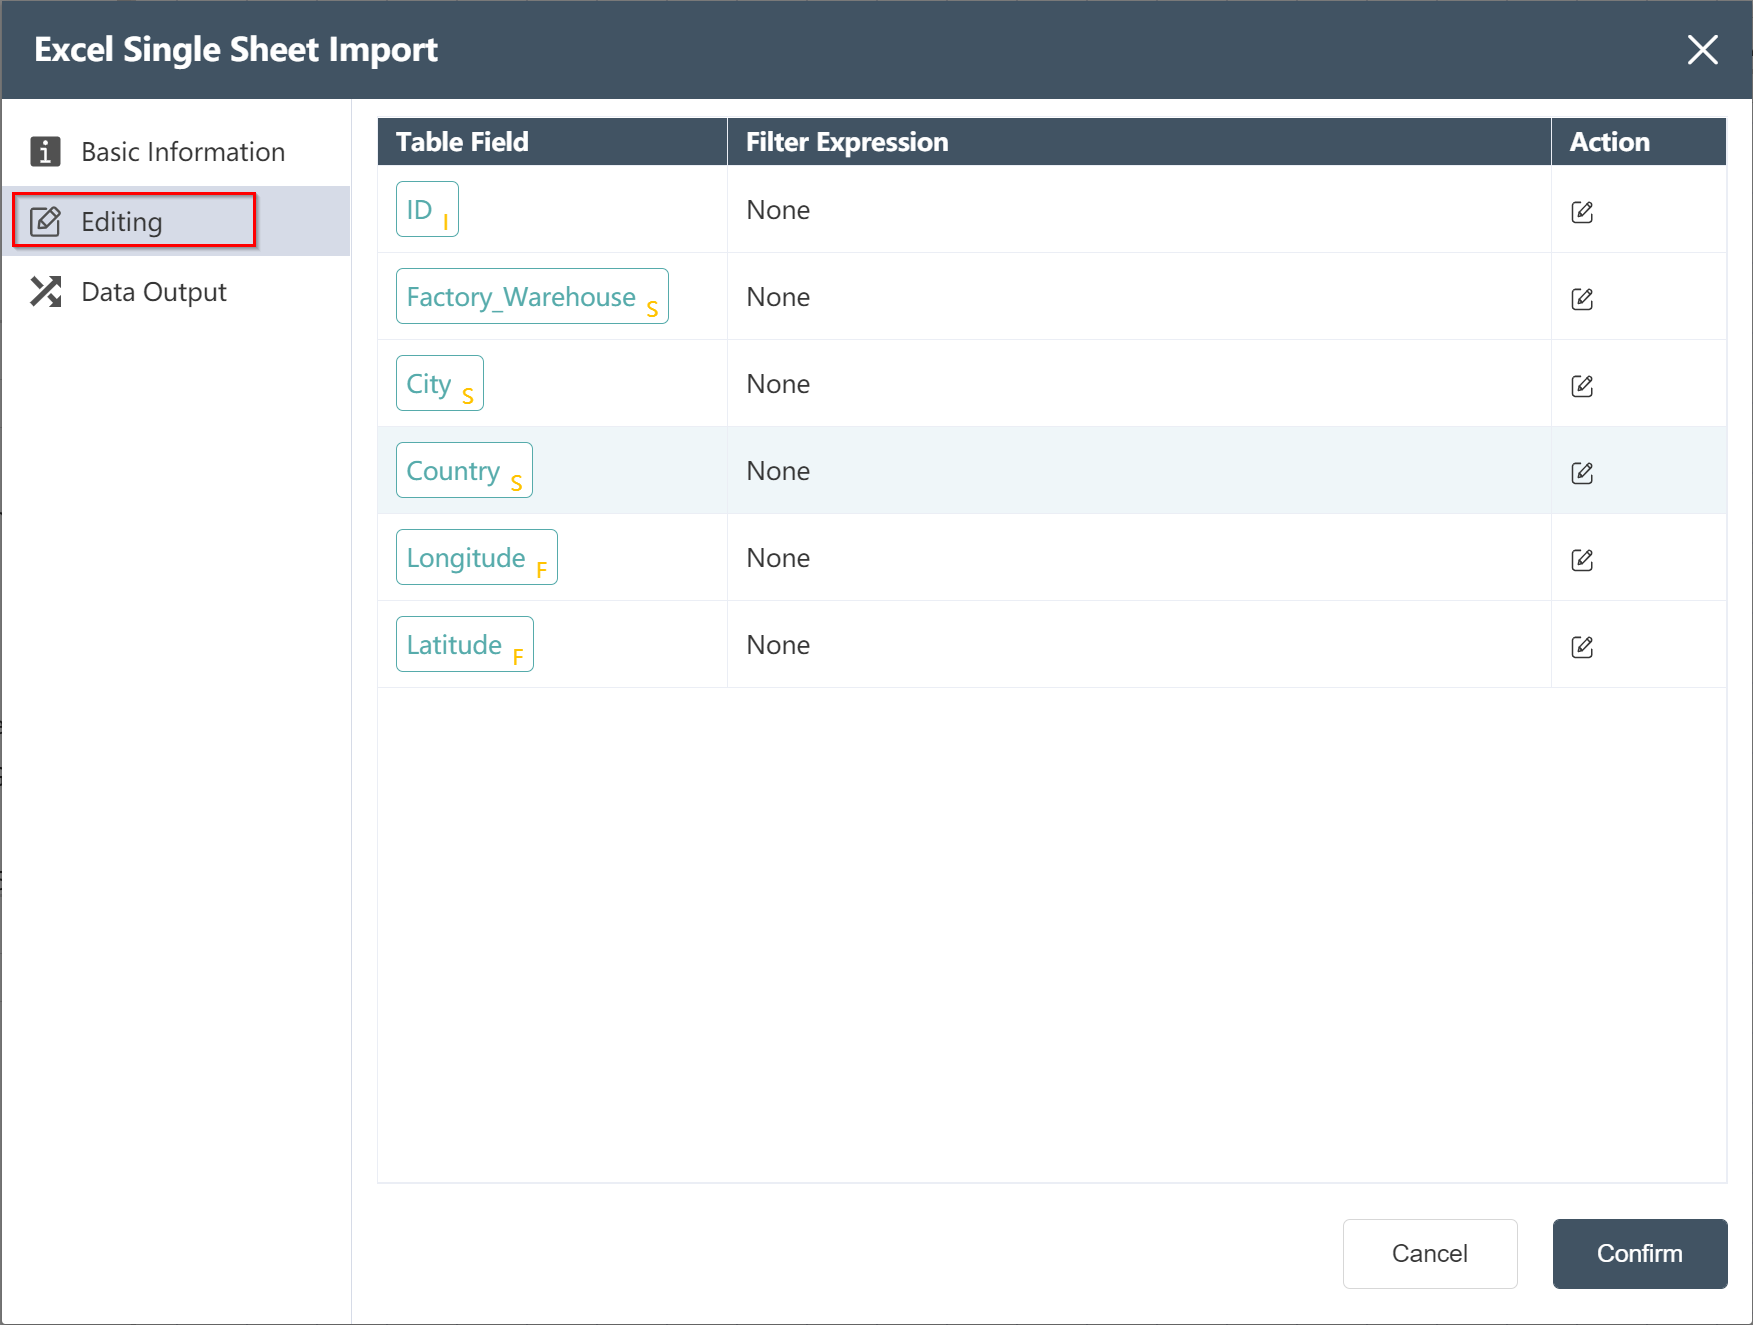
Click Data Output to edit the field name and data type of the output field
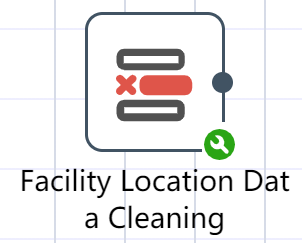
# New Node: Facility Location Data Cleaning
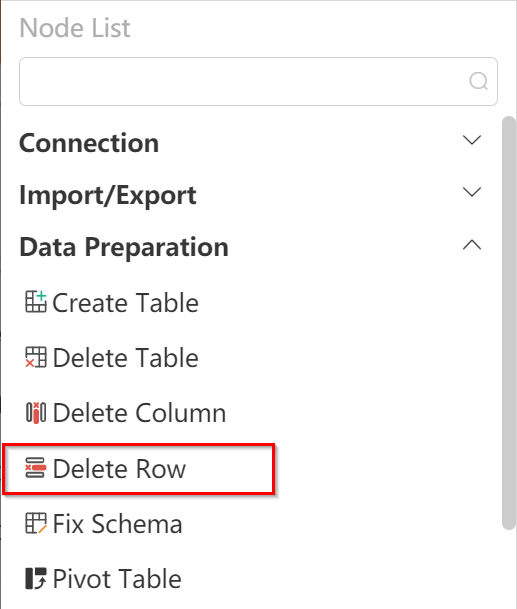
Goal: remove data with empty longitude or latitude
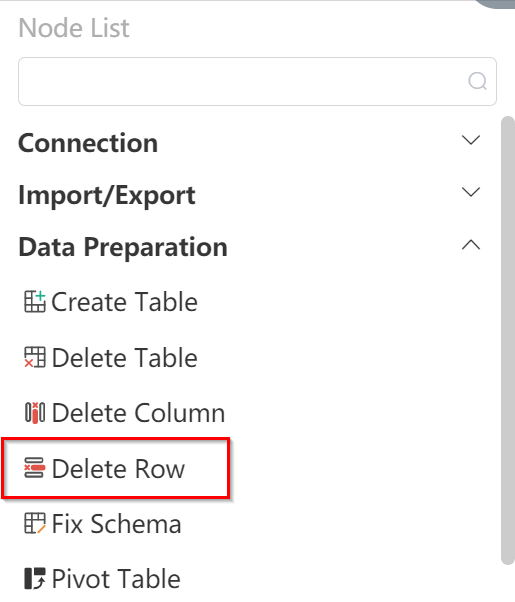
- Double click/drag a node [delete row]
- Select target data
- Click to enter the data editing menu, you can view the input table fields
- Enter "isnull", drag the field to be adjusted (longitude), enter "OR", "isnull", and drag the field to be adjusted (latitude)
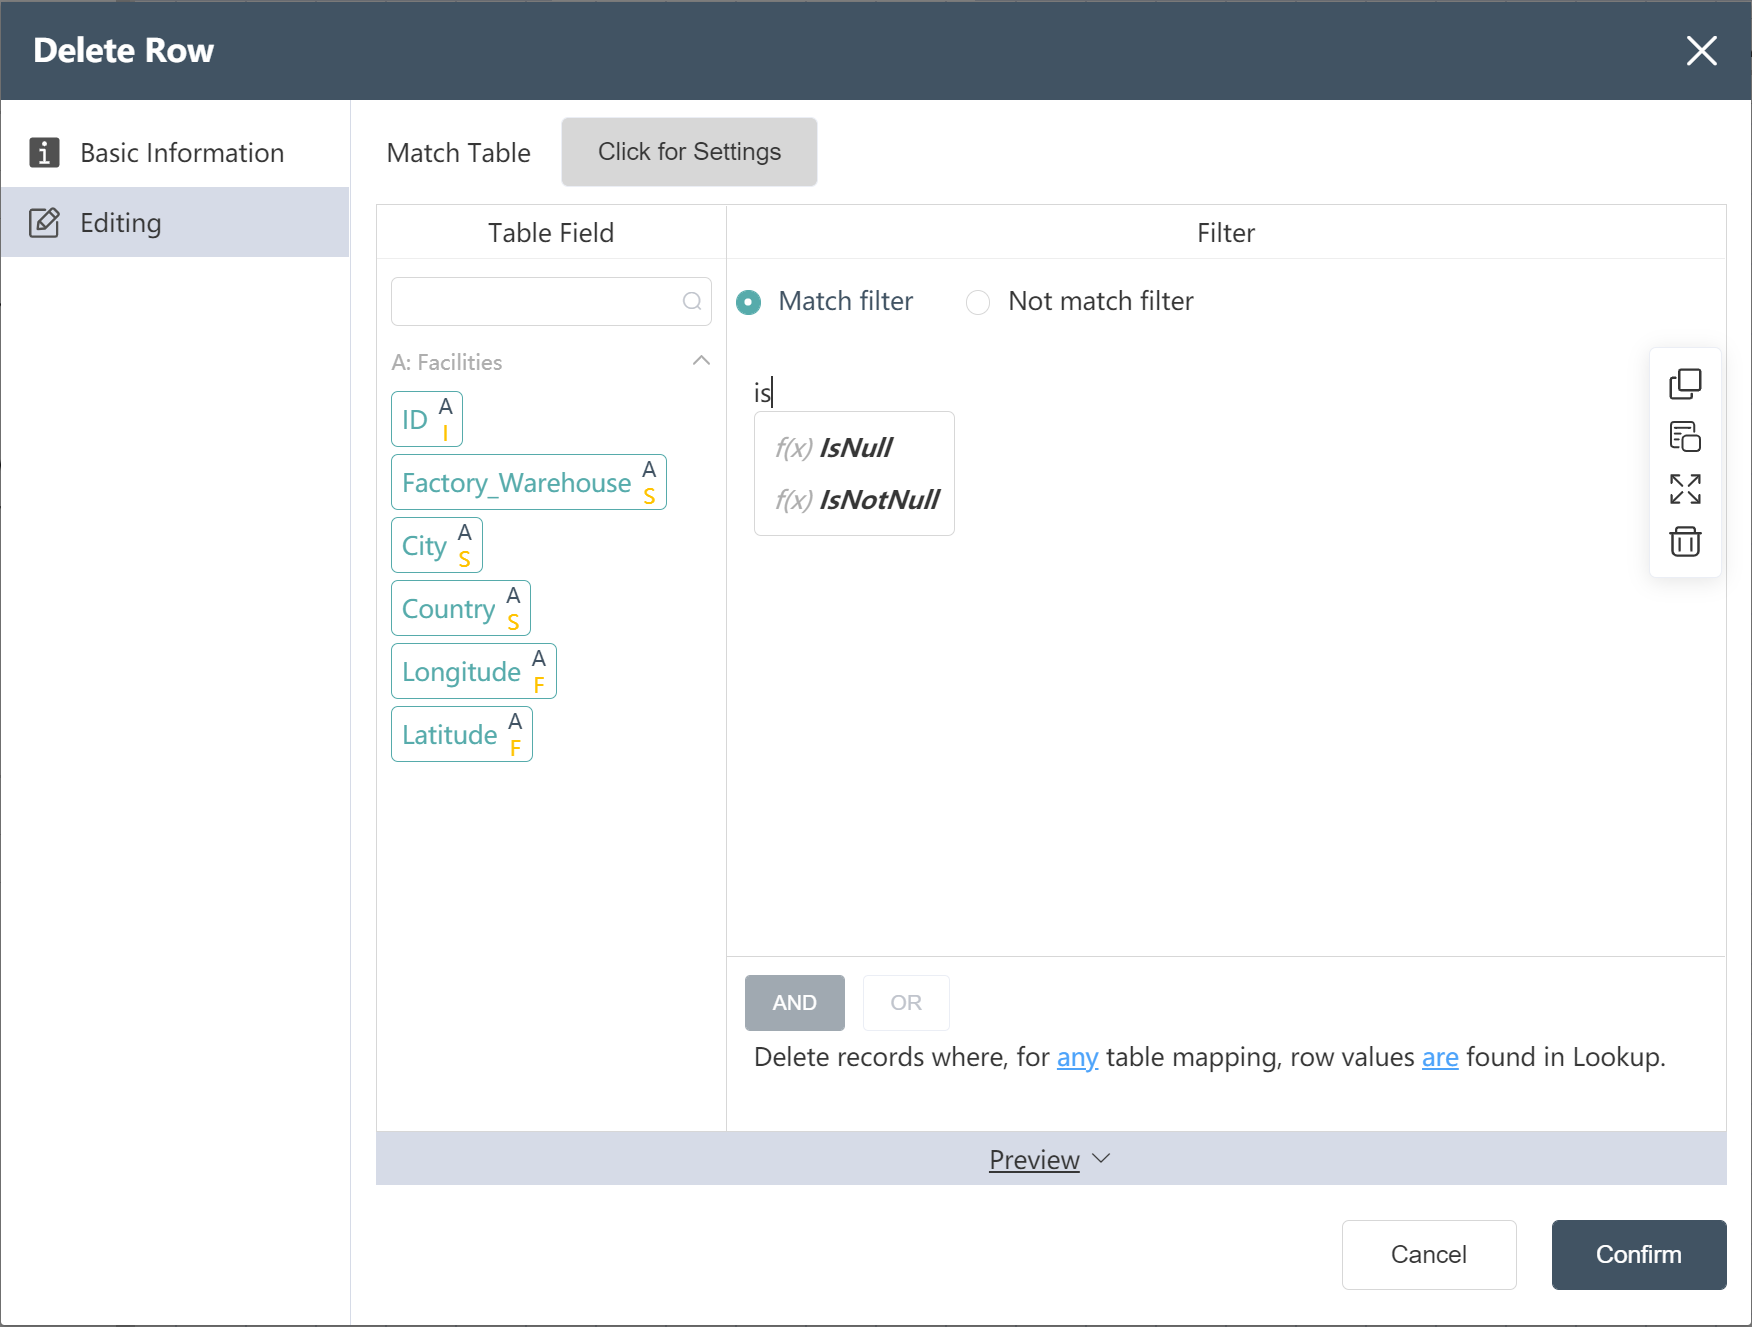
- Input table filter selection matches filter criteria
- Click to confirm (you can check whether it is compared with the picture below before confirming)
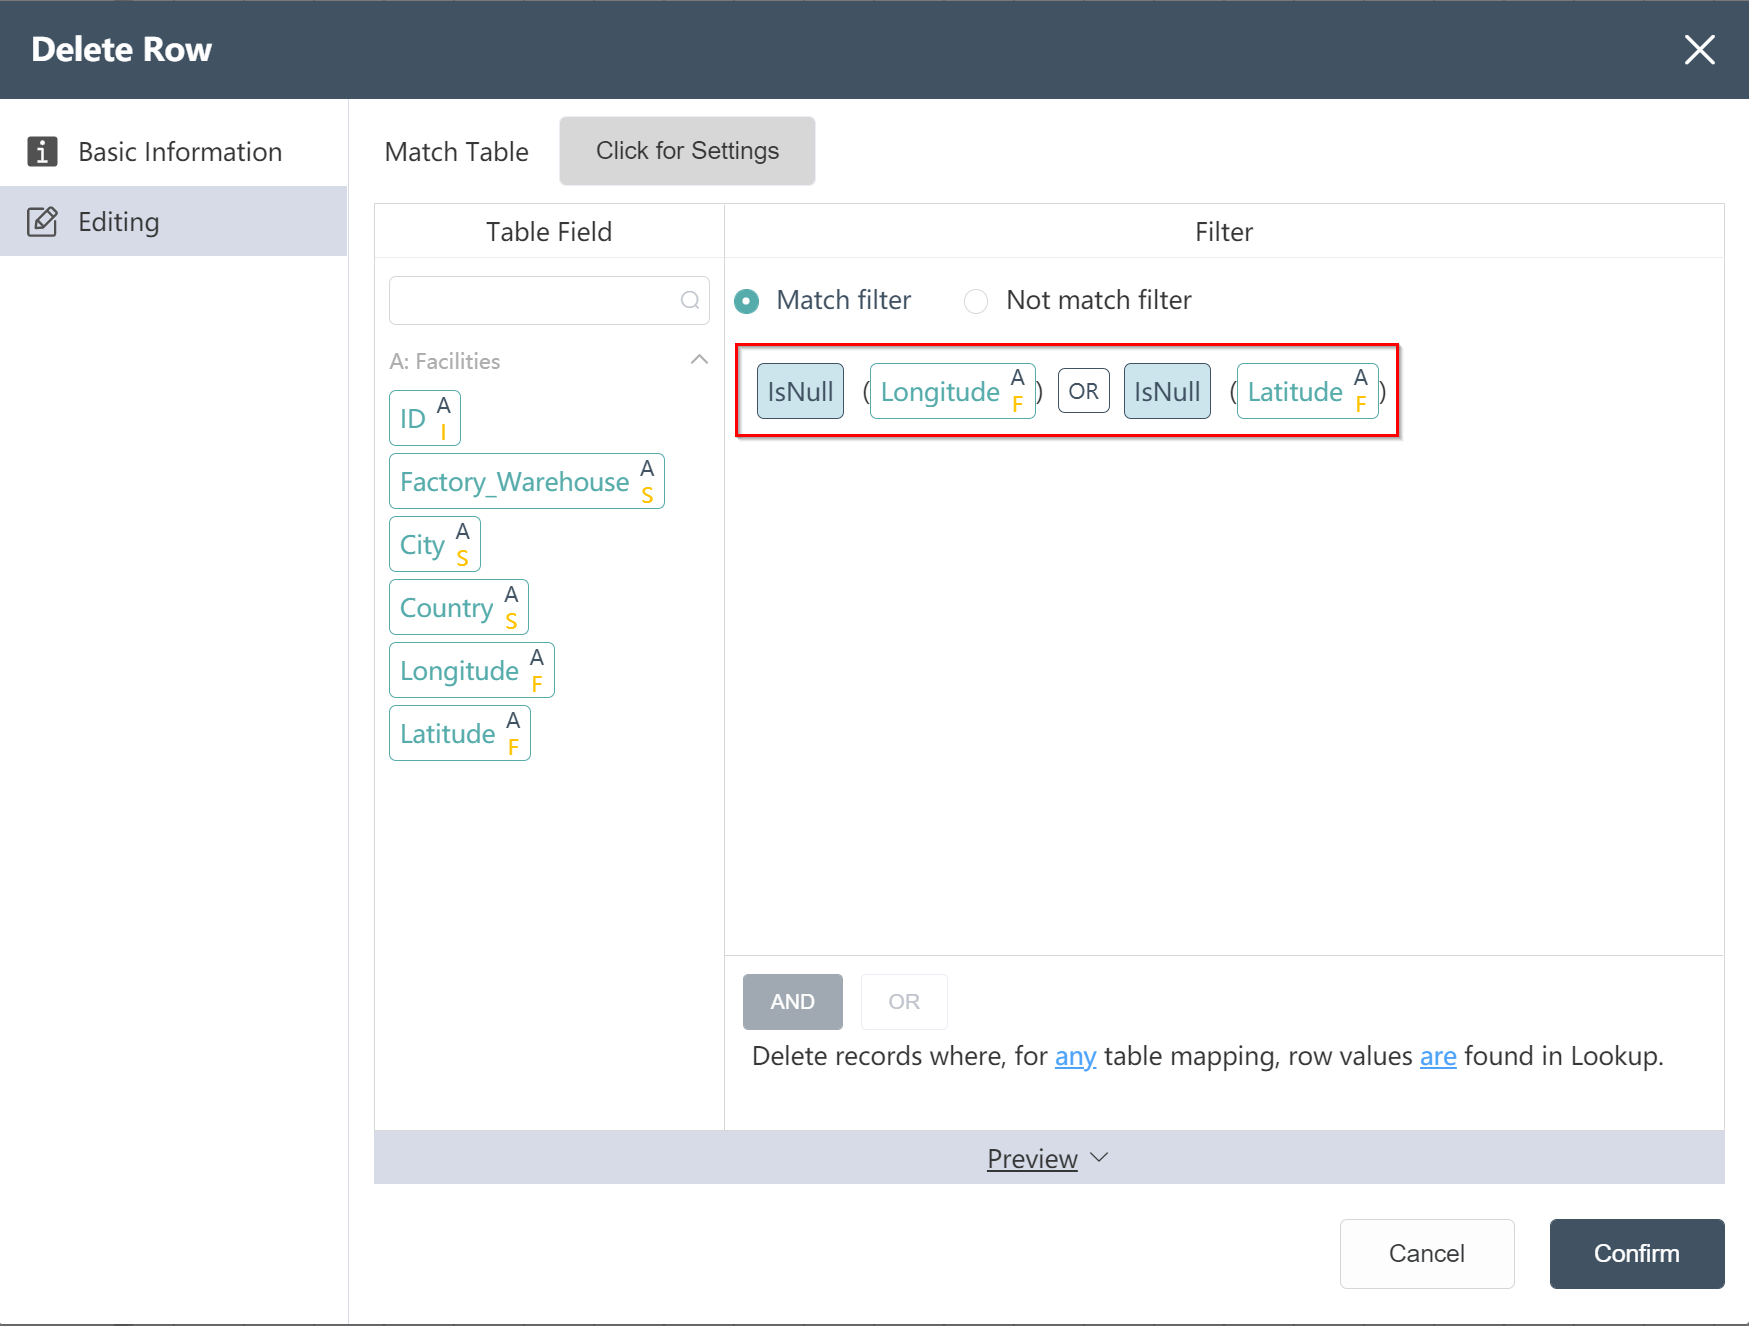
- After the operation is complete, you can click Preview to view the result.
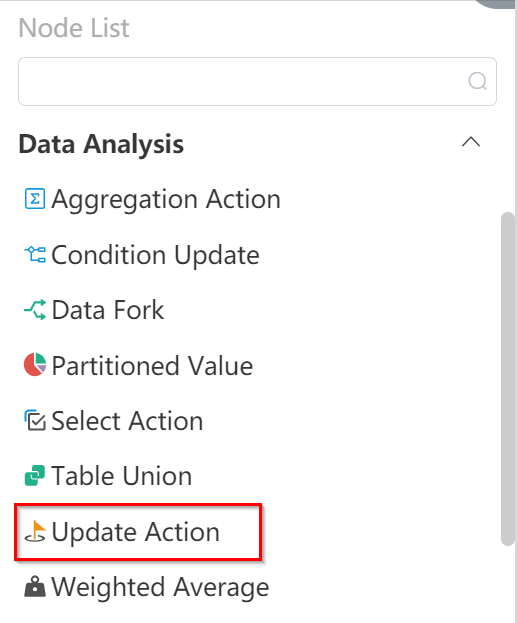
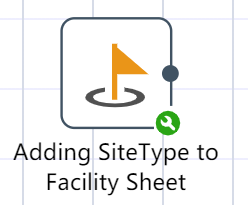
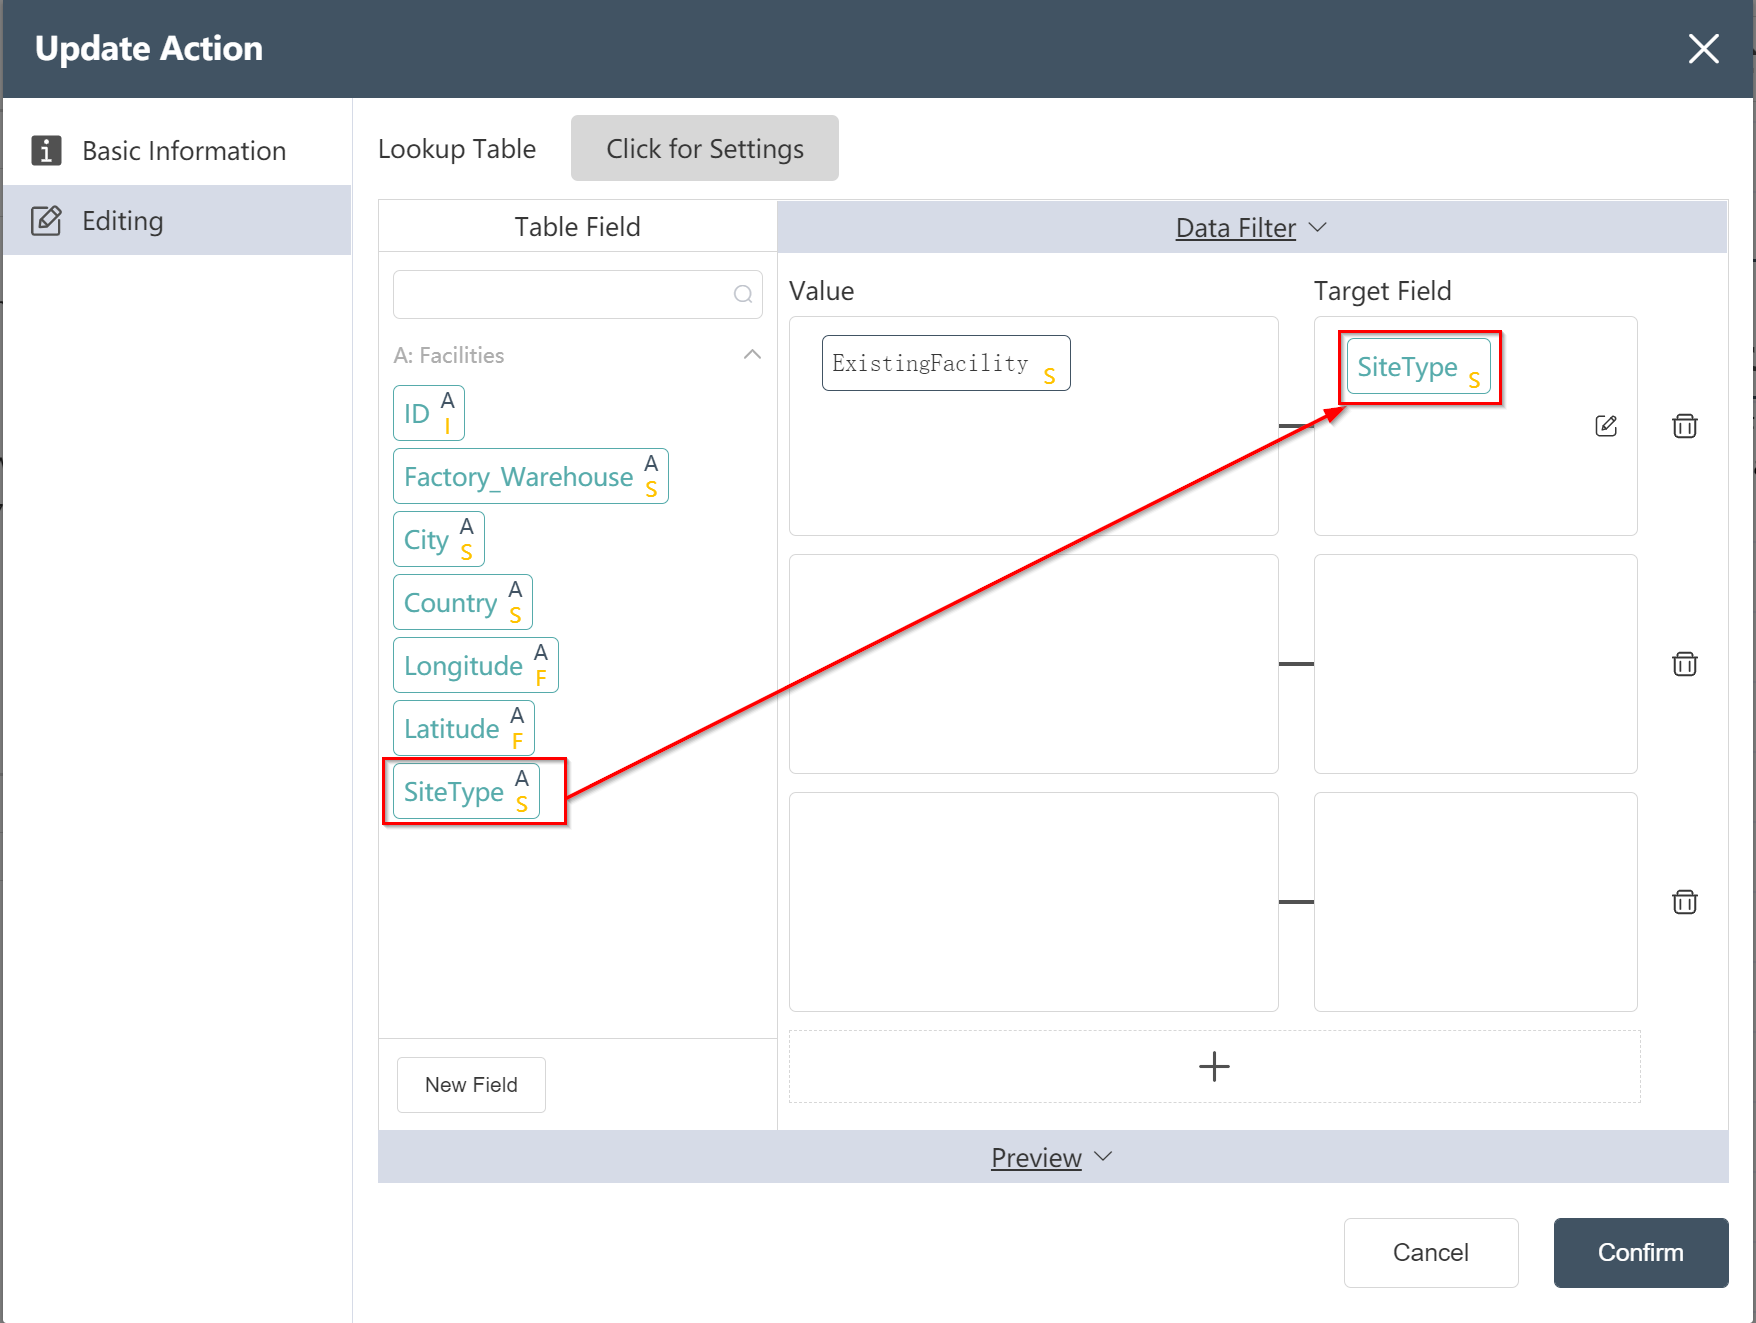
# New node: Adding SiteType to Facility Sheet
Goal: Prepare to create the site table in Scatlas
- Double click/drag node [field update]
- Select target data: Facilities
- Click to enter the data editing menu
- Click on the new field and modify the field name in the target field box: site type
- Input assignment: ExistingFacility
- Click to confirm (you can check whether it is compared with the picture below before confirming)
After the operation is complete, you can click Preview to view the result.

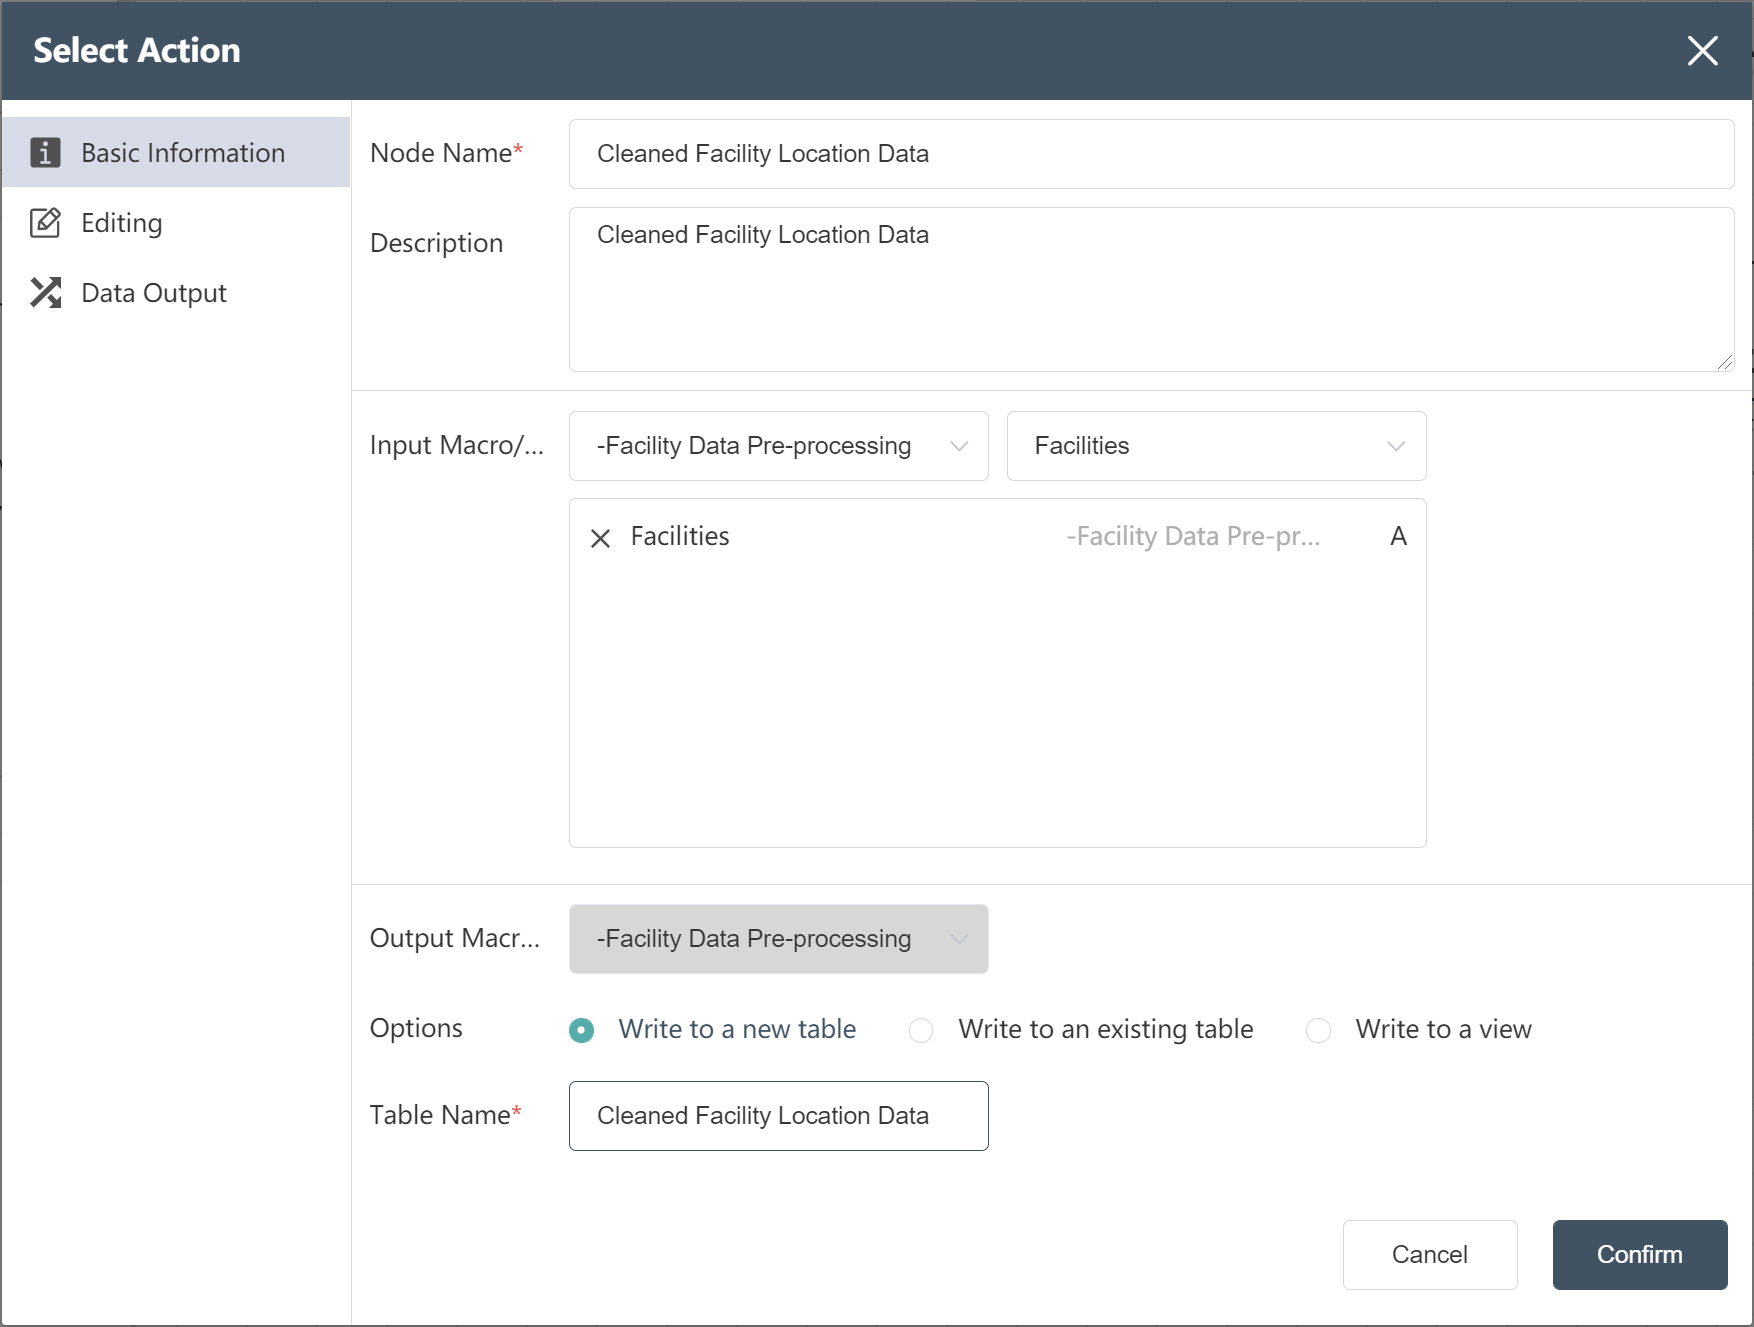
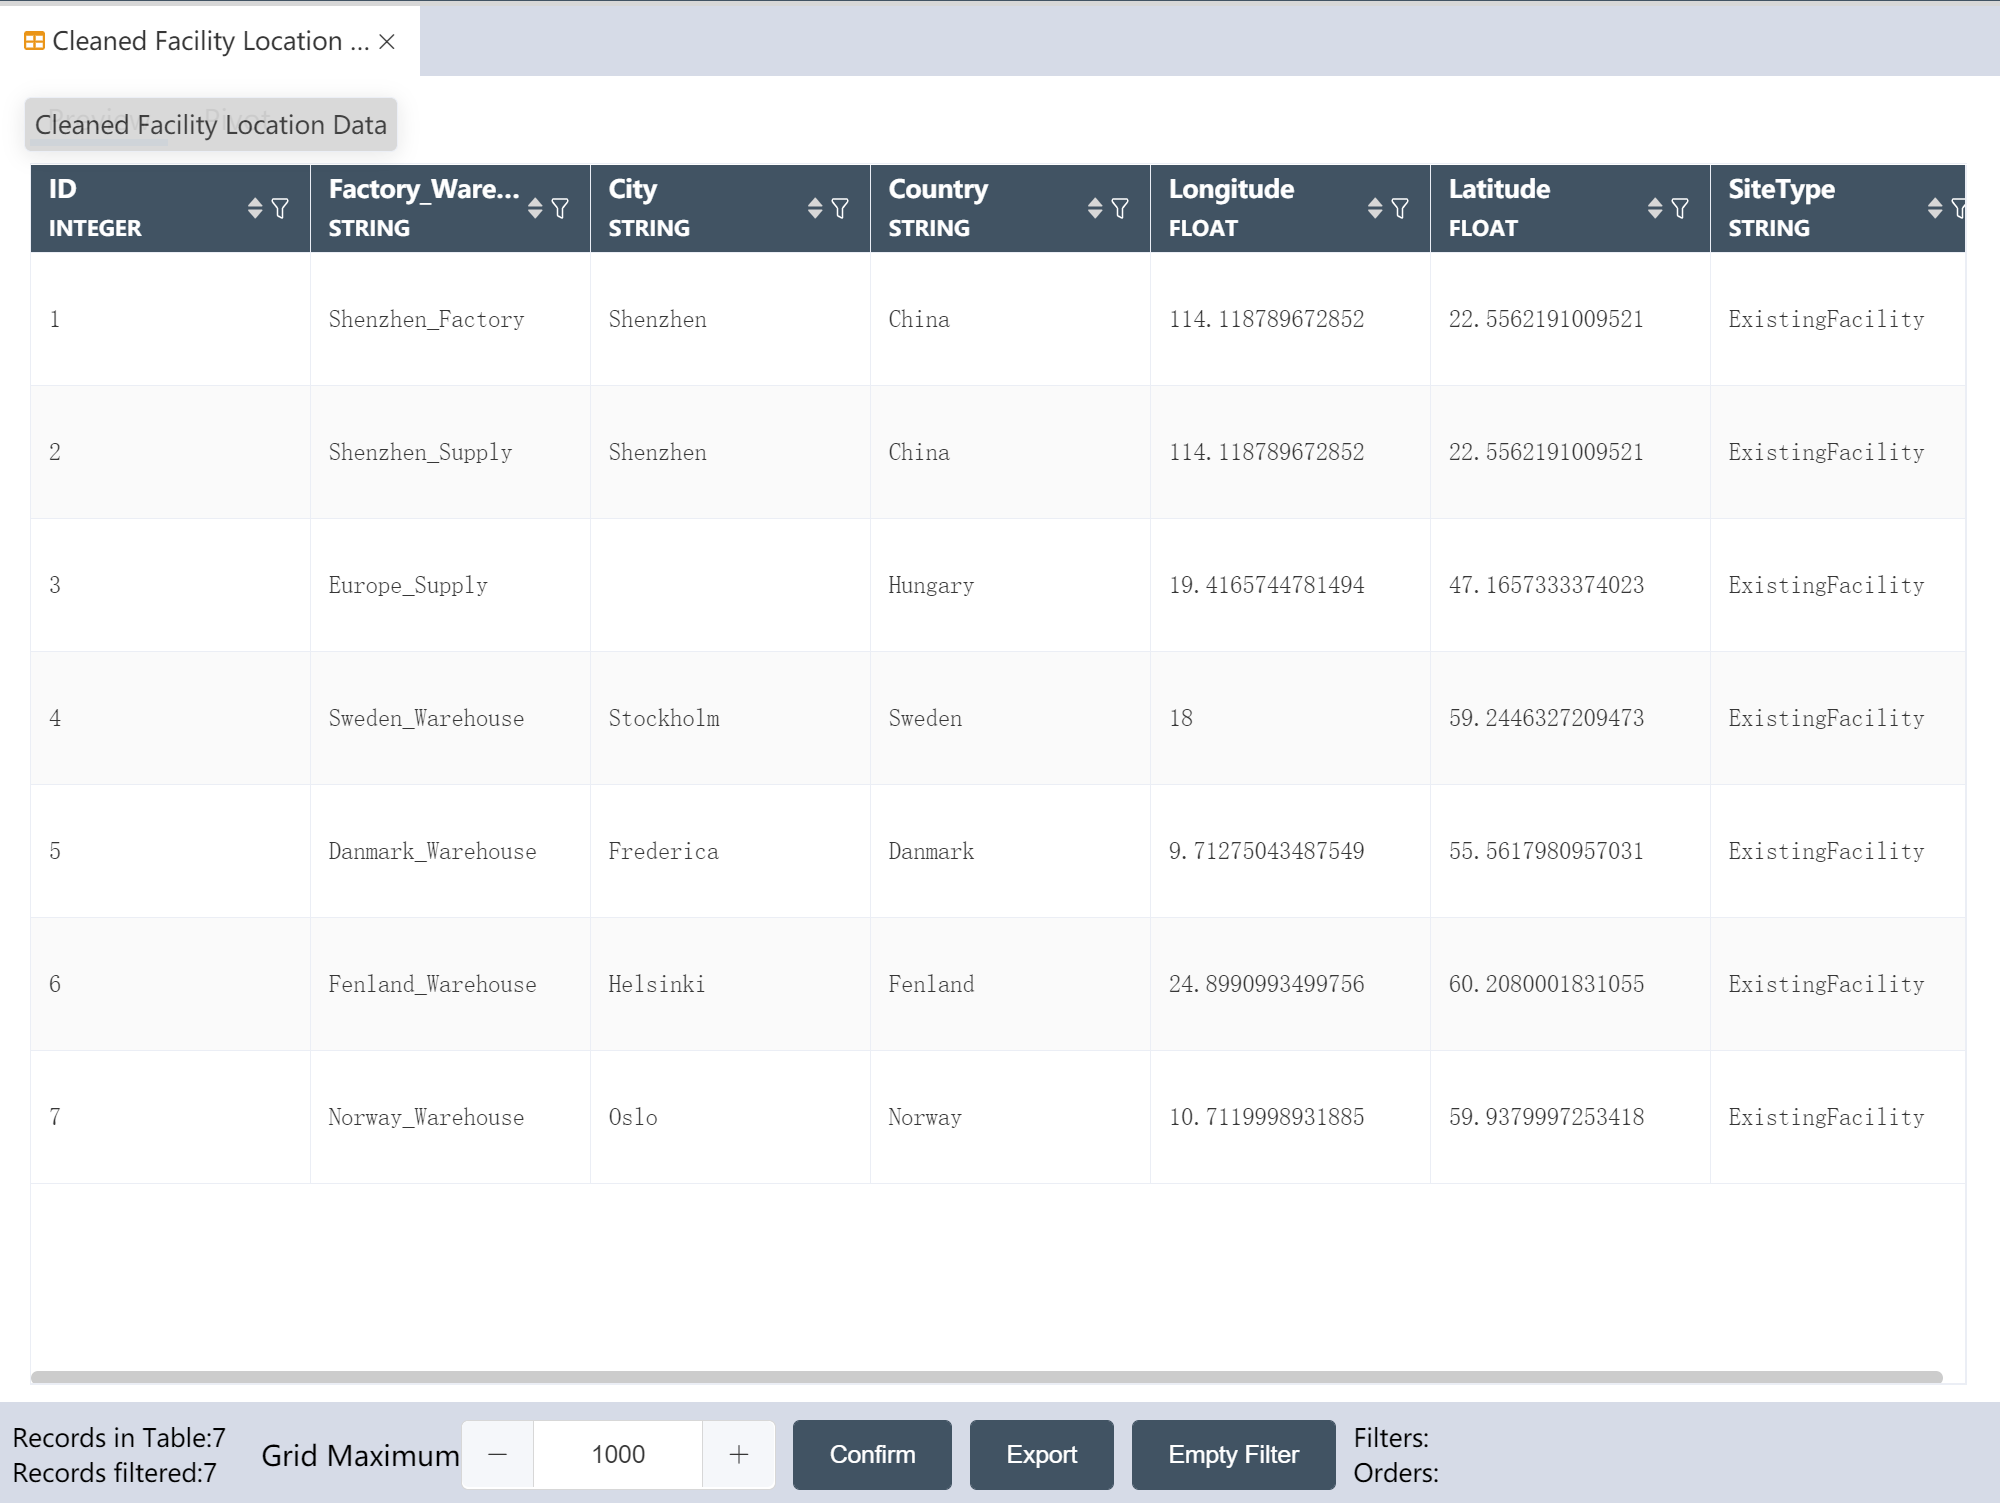
# New node: Cleaned Facility Location Data
Goal: Write the cleaned Facility location data to a new table
- Double click/drag node【Data Selection】
- Fill in the node name: Cleaned Facility location data
- Select Input Data: Facilities
- Select write mode: write to new table
- Fill in the new table table name: Cleaned Facility location data
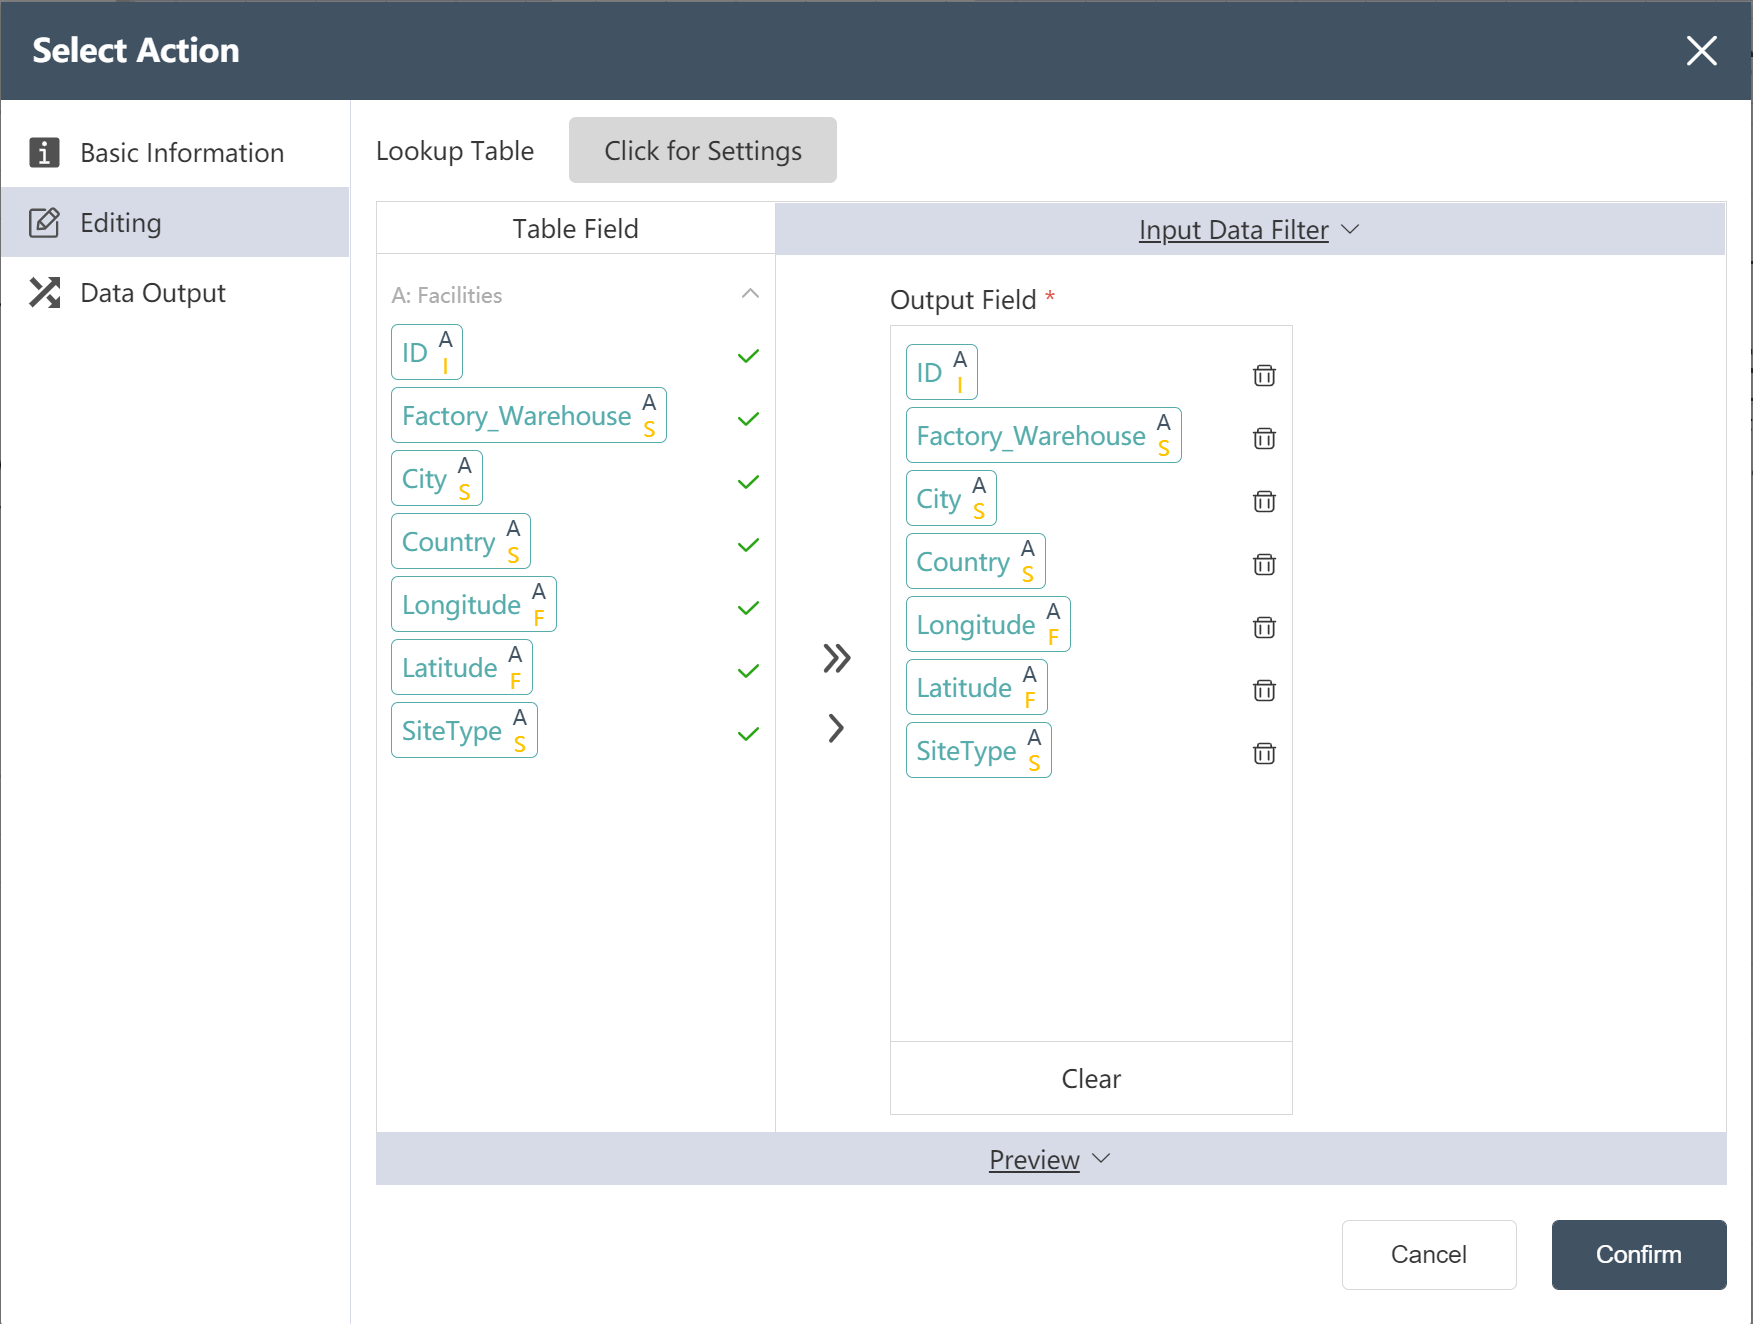
- Click to enter the "Data Edit" menu, select the output field (see the figure below)
- Click to confirm
- run
After the operation is complete, you can click Preview to view the result.

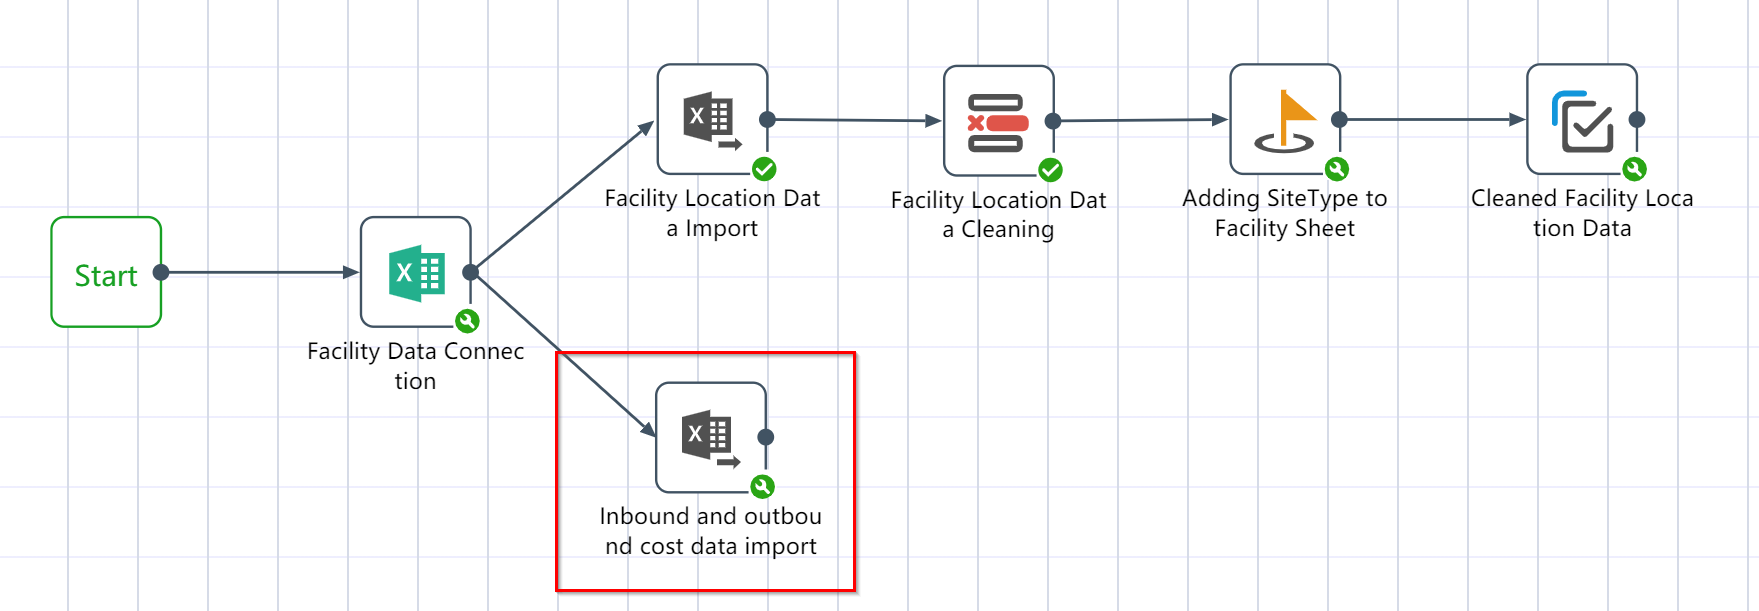
# New node: Inbound and outbound cost data import
- For operation steps, refer to New Node: Importing Facility Location Data
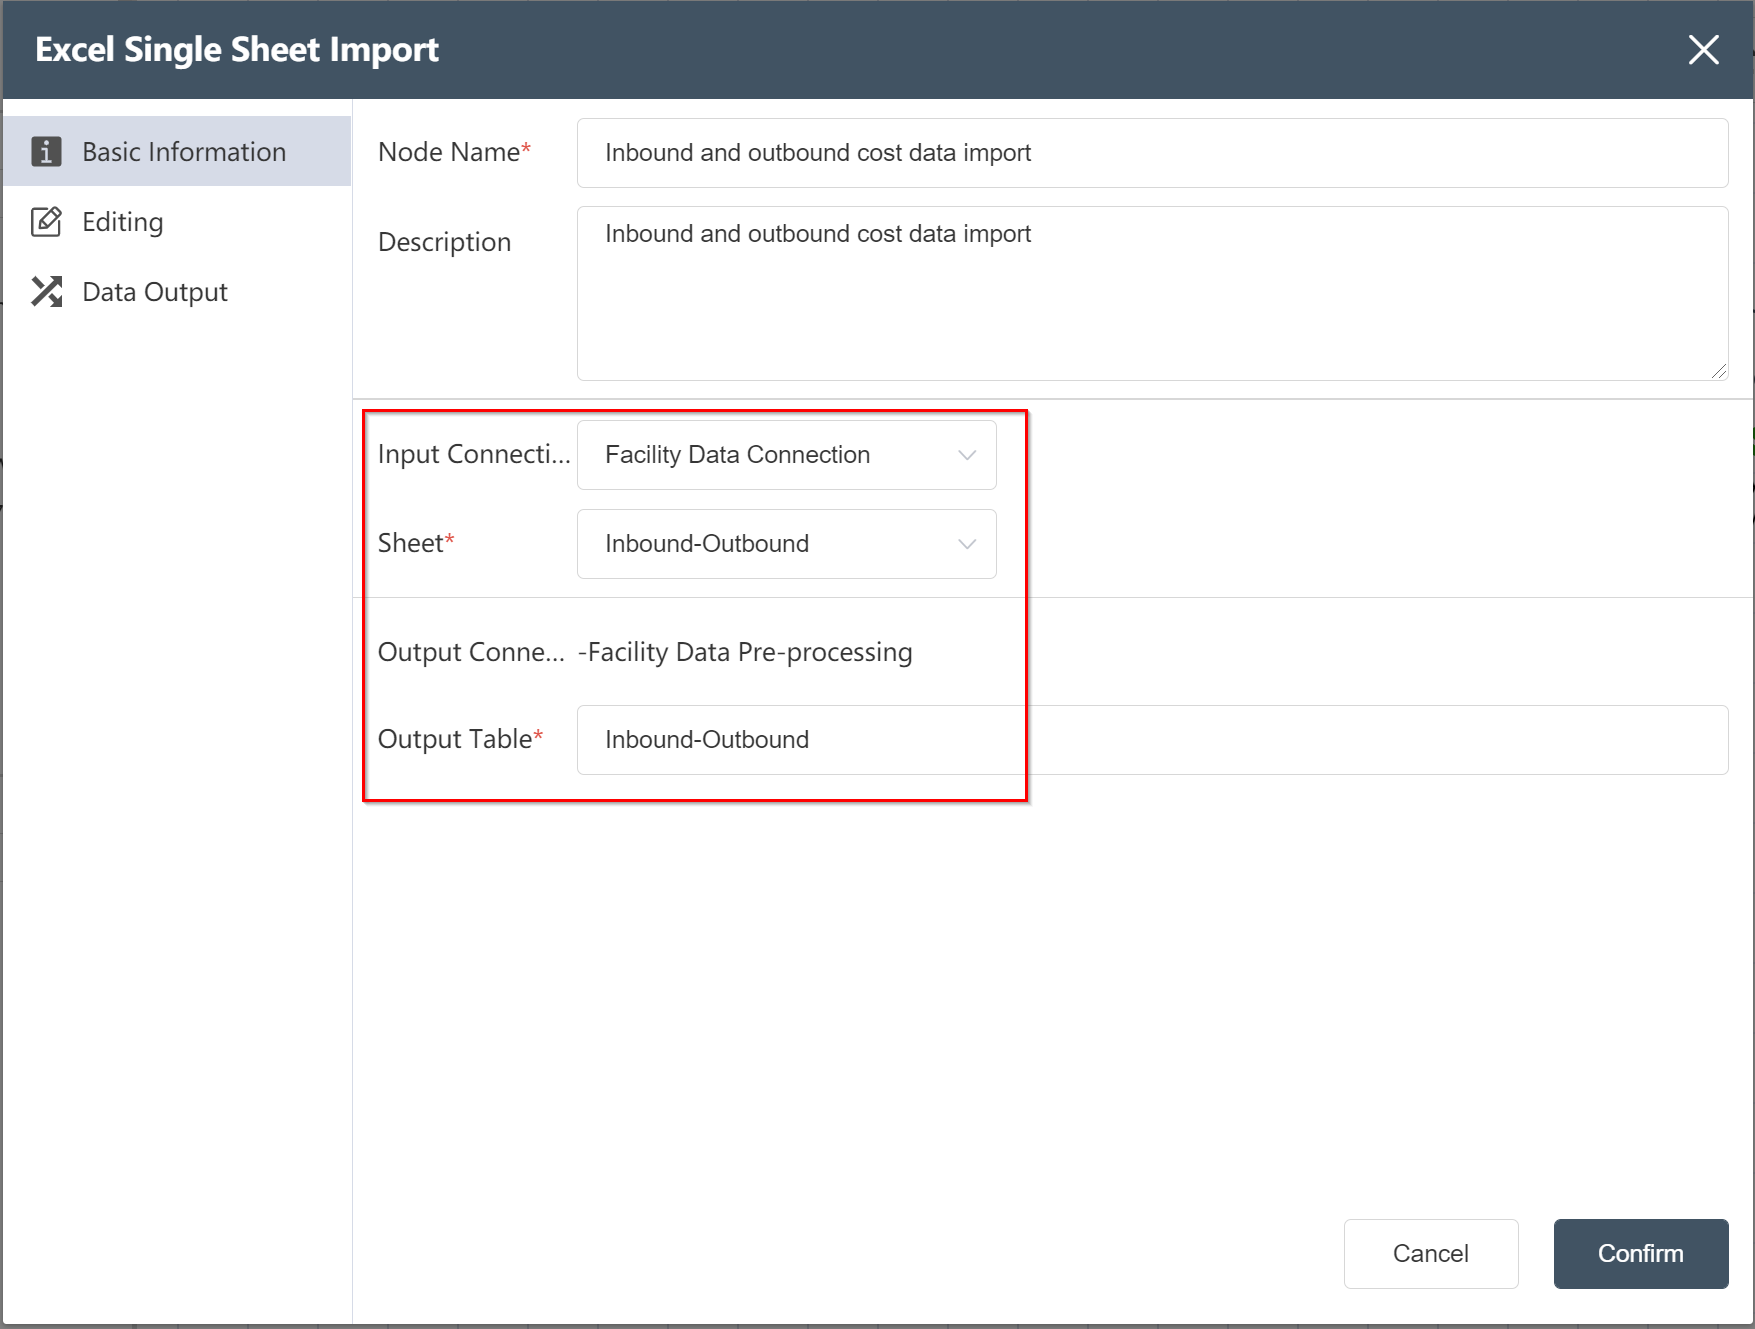
After the operation is complete, the facility inbound and outbound cost data is imported into the DASTRO® database.
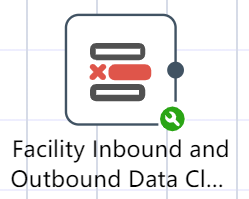
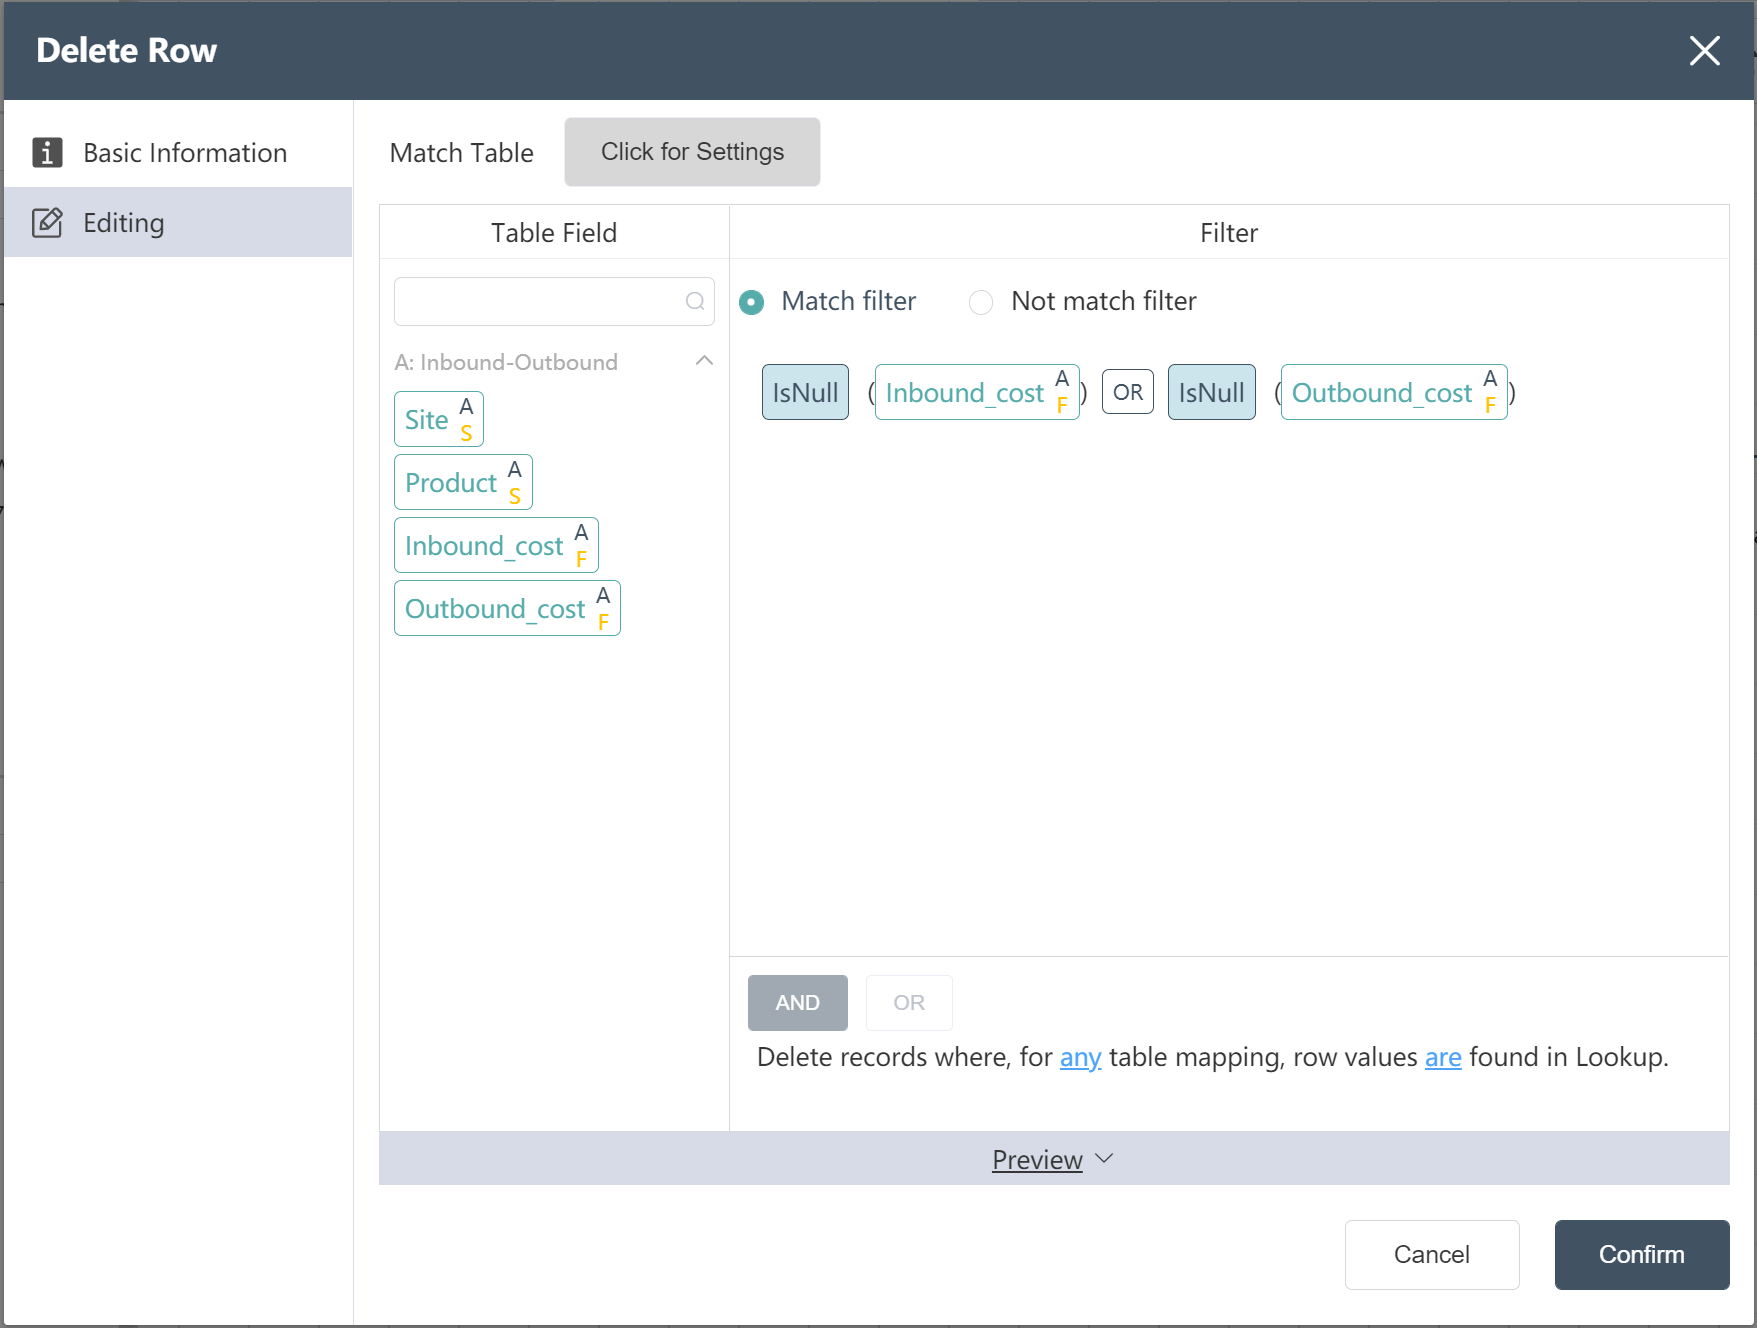
# New Node: Facility Inbound and Outbound Data Cleaning
- Double click/drag node to delete row
- Select target data
- Click to enter the data editing menu, you can view the input table fields
- Fill in the filter conditions for deleting rows for the fields that need to be adjusted
- Enter the expression as shown in the figure
- Input table filter selection matches filter criteria
- Click to confirm (you can check whether it is compared with the picture below before confirming)
After the operation is complete, you can click Preview to view the result.
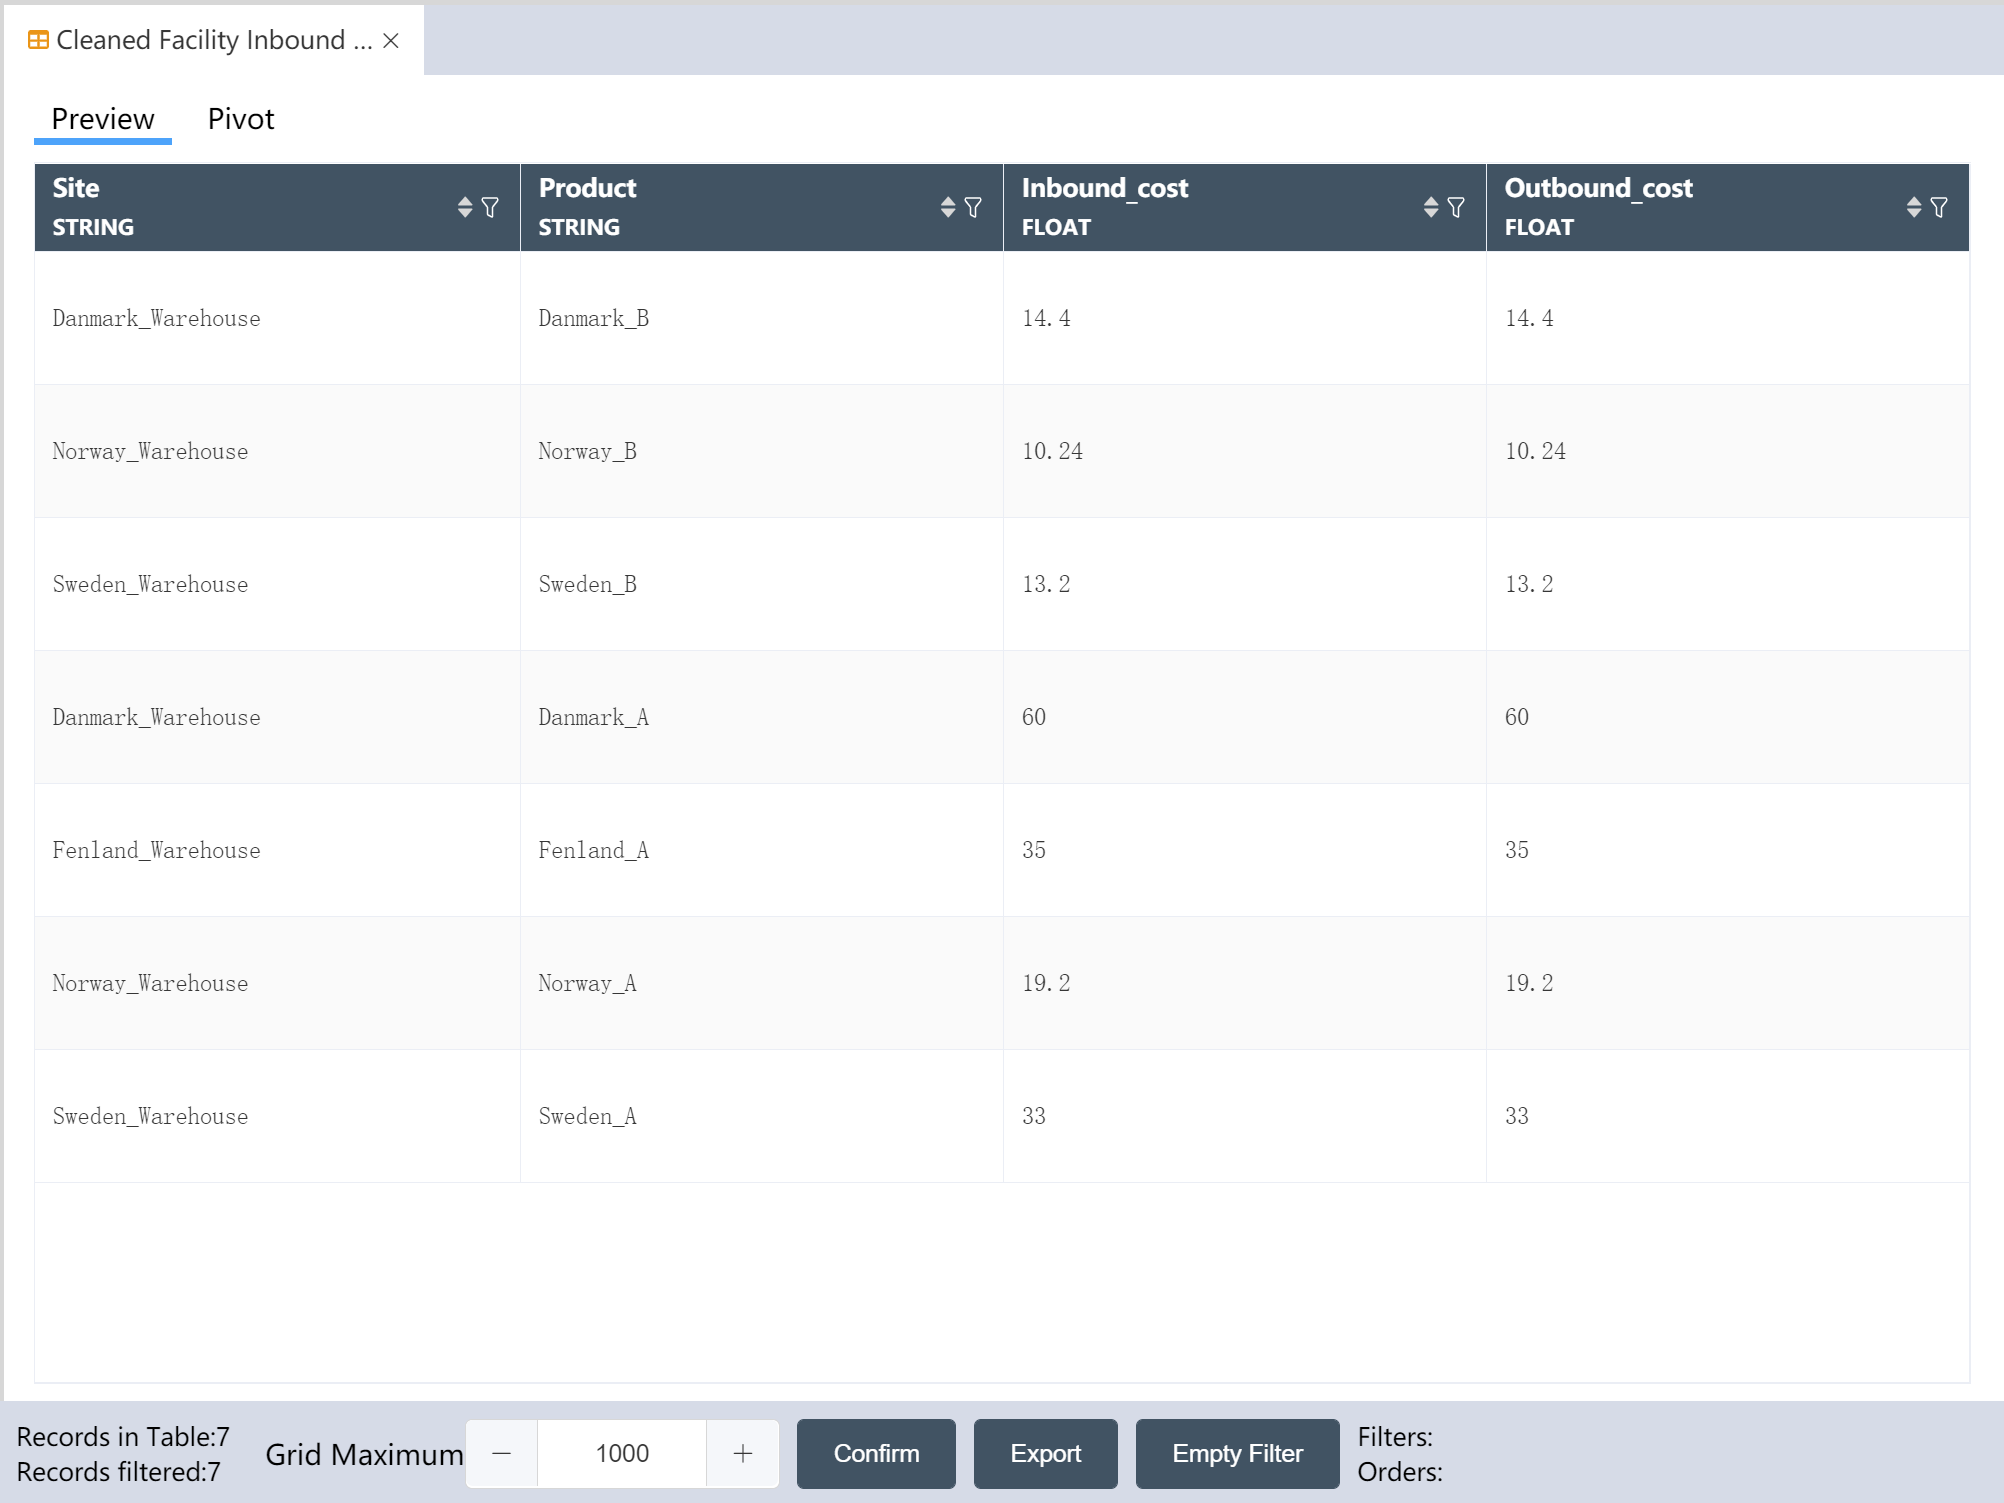
# New node: Cleaned Facility Inbound and Outbound Cost Data
- For operation steps, refer to New Node: Cleaned Facility Location Data
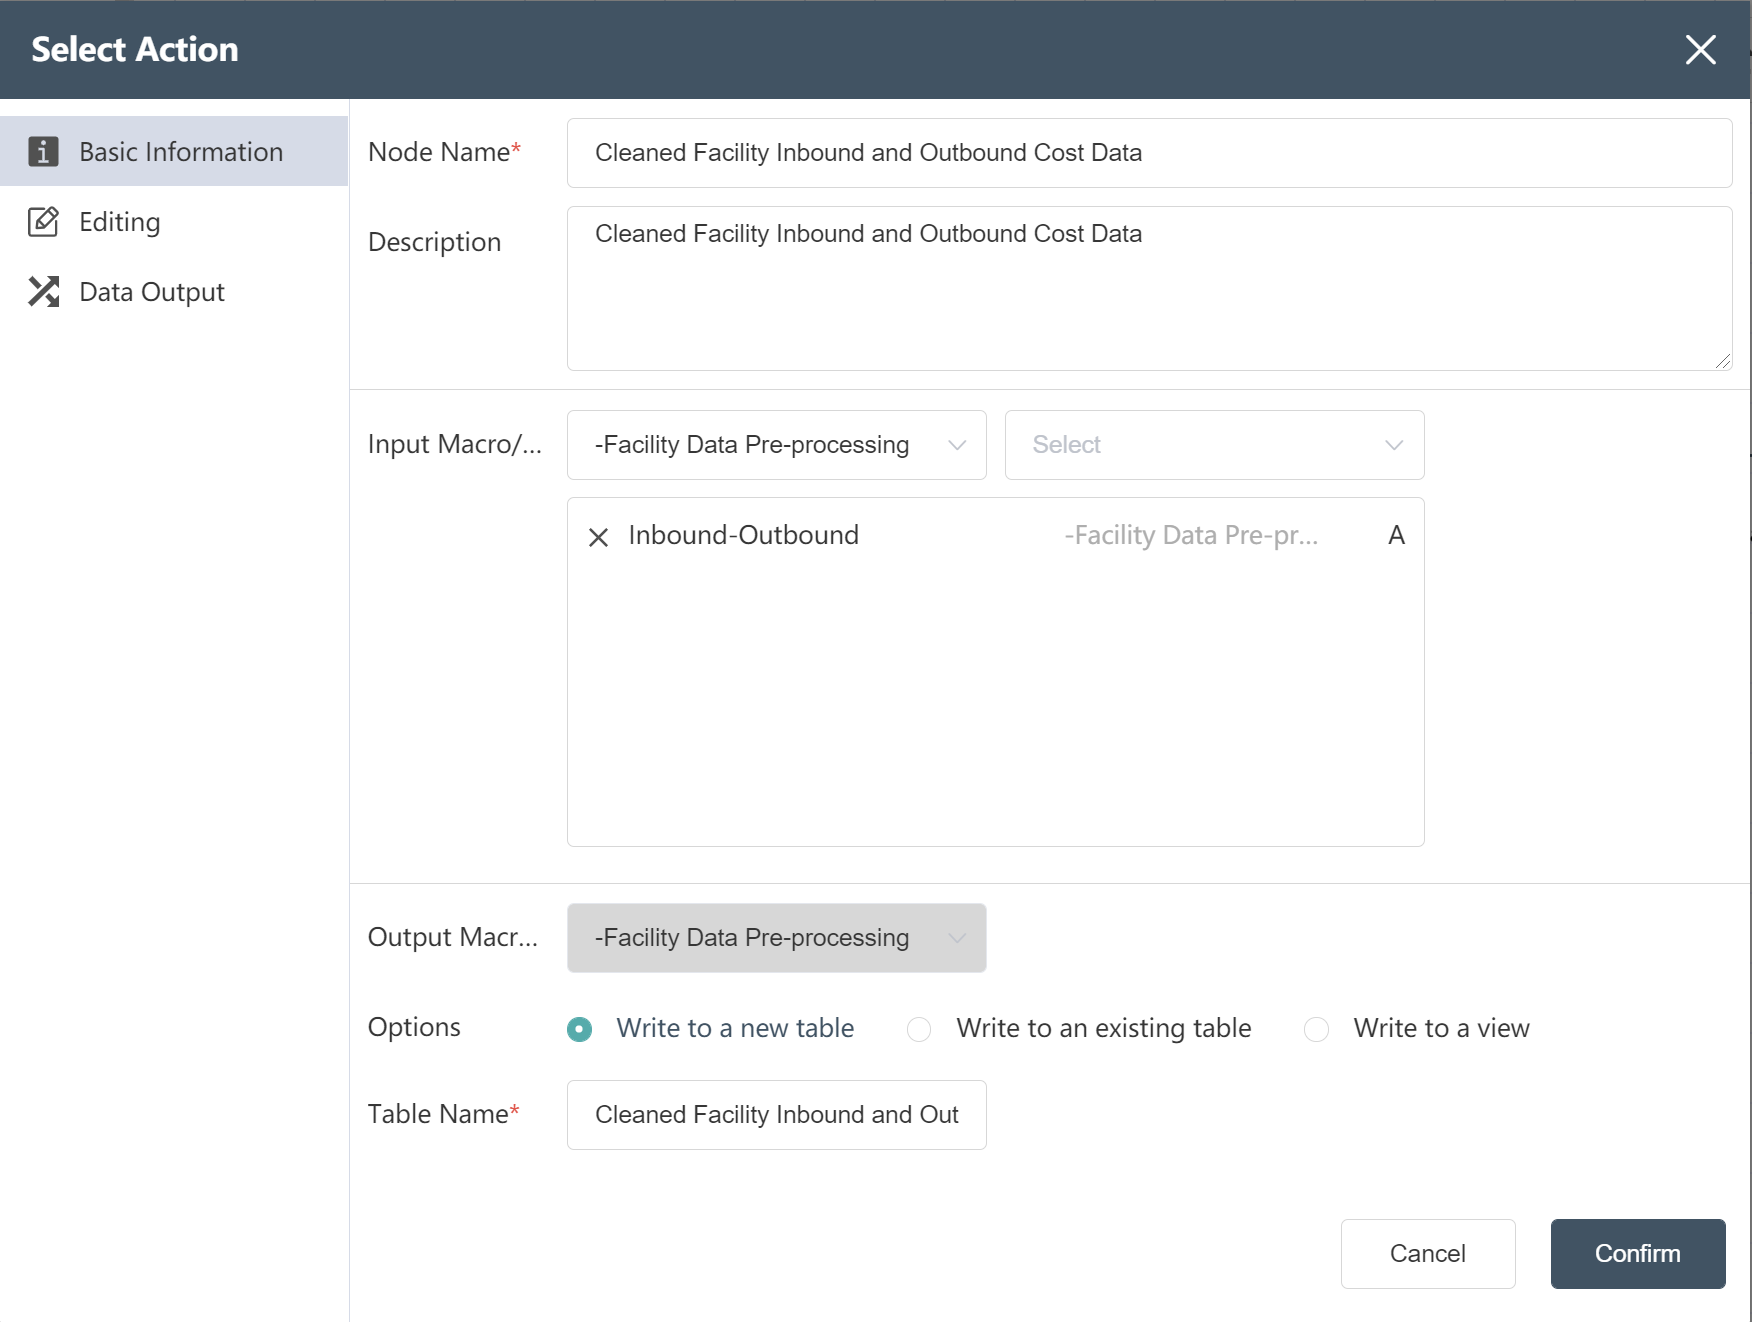
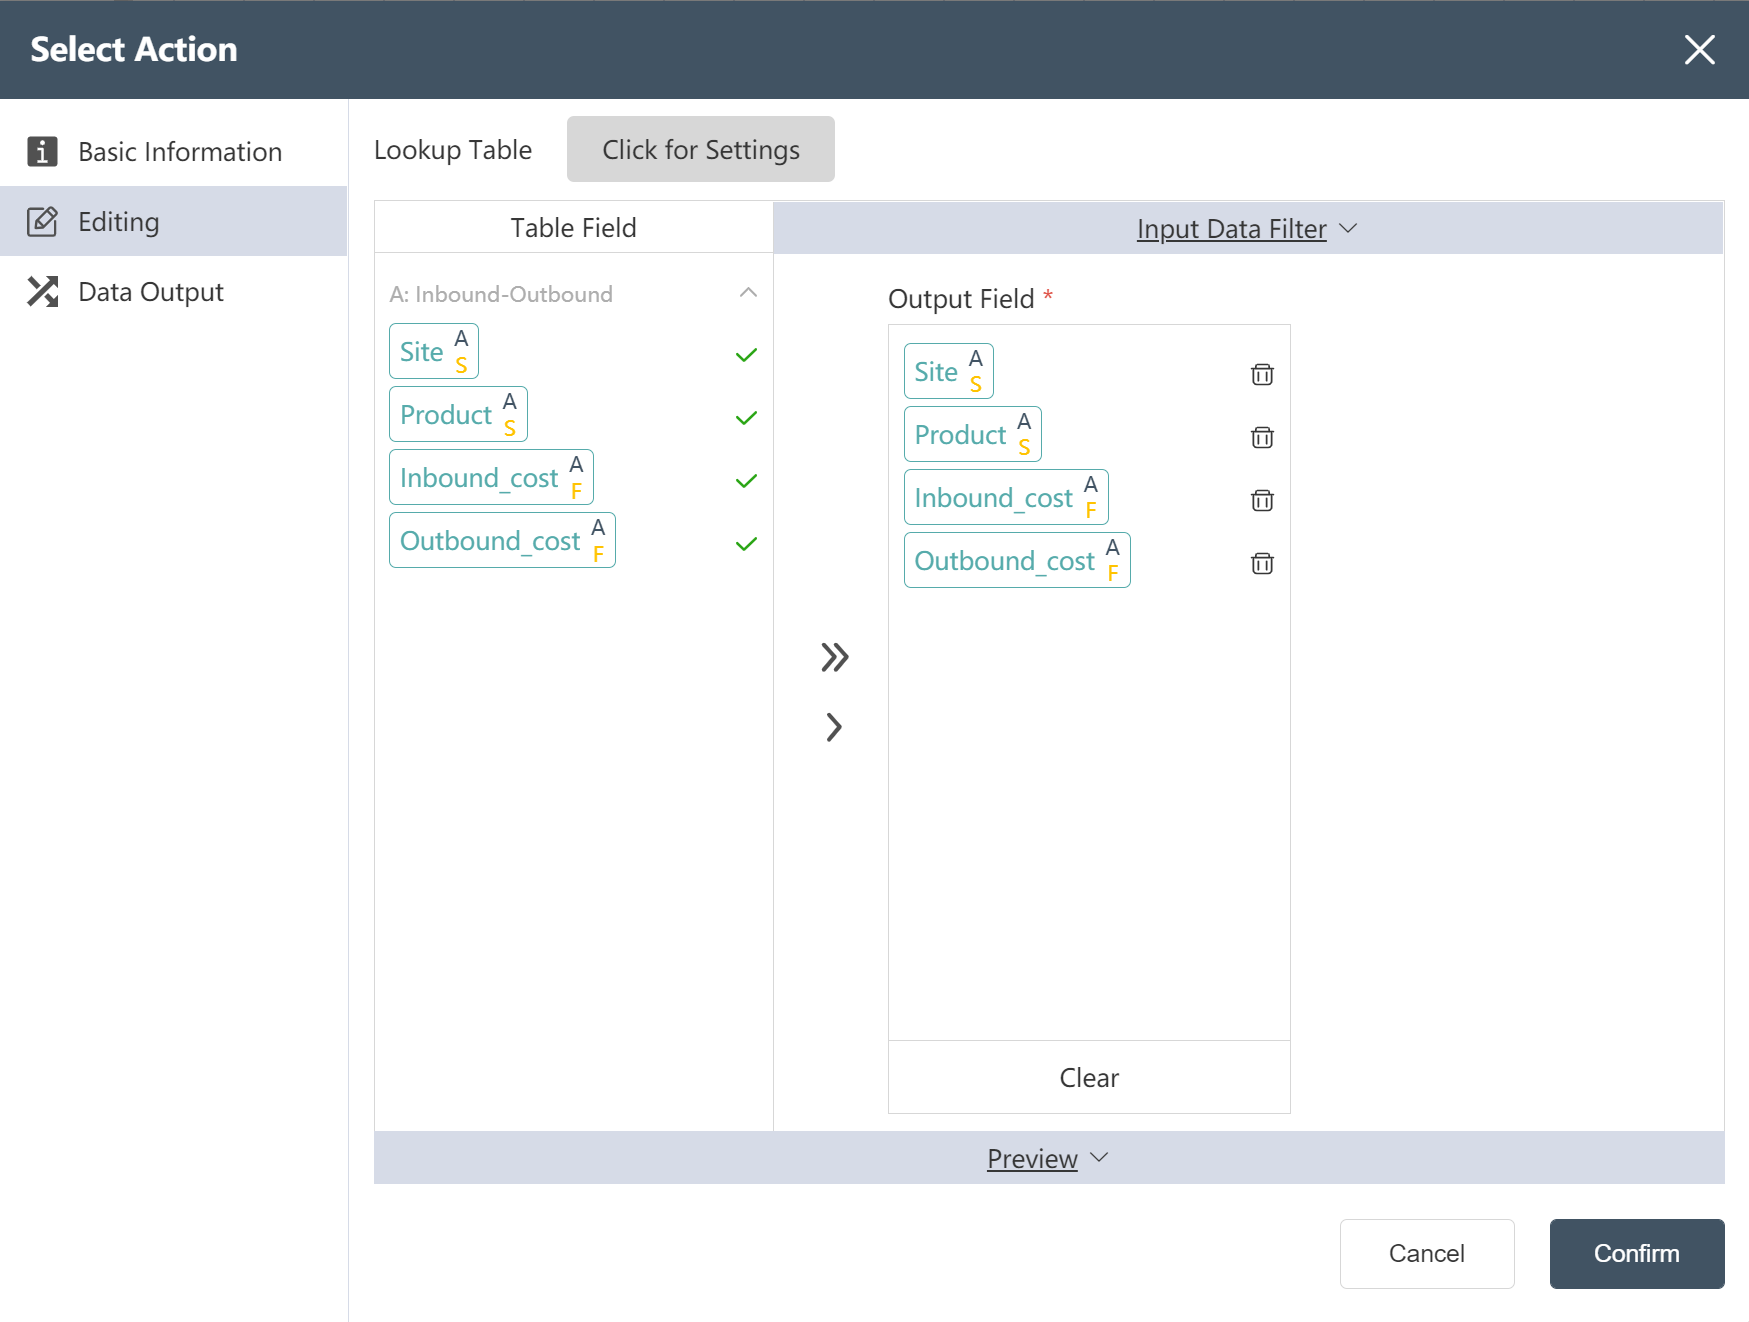
The operation is completed, and the clean facility inbound and outbound cost data is written to the new table.
# Running Node Group: Facility Data Import Preprocessing
- Connect according to the steps shown in the figure
- Click the Execute button in the upper right corner of the canvas
After the operation is completed, two output tables are obtained: the location data of the cleaned factory warehouse, and the cost data of the cleaned facility in and out of the warehouse.
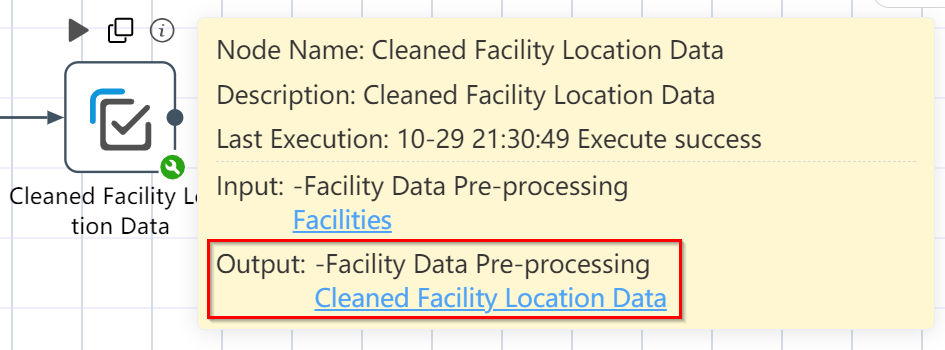
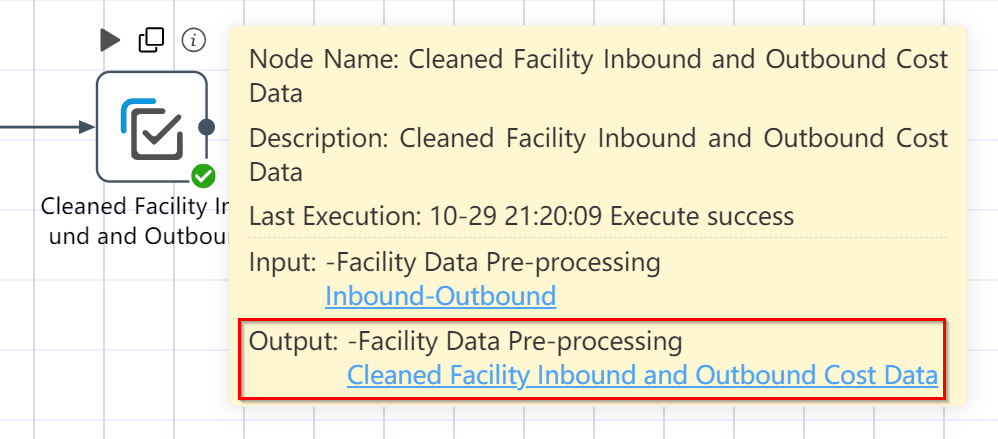
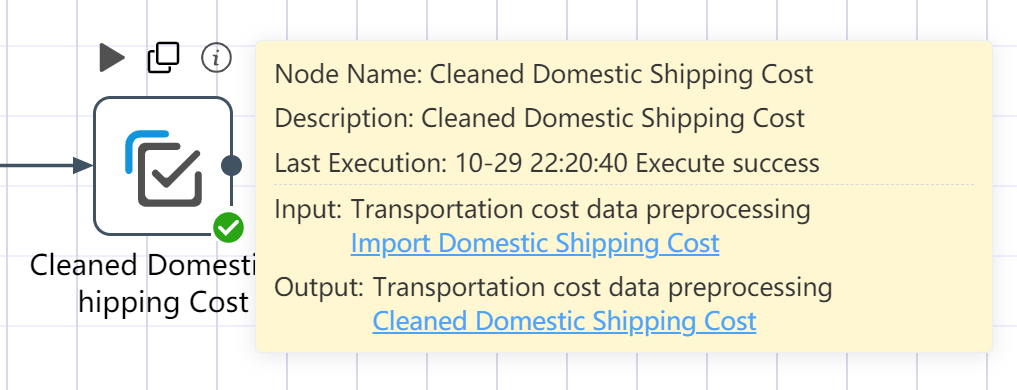
# Check Run Results: Facility Data Import Preprocessing
- Hover over the small i icon in the upper right corner of the data selection node
- Click Output Table: Cleaned Facility Location Data
- Click the output table: Cleaned facility inbound and outbound cost data
- Check if the output is consistent with the image below
# Node group 2: Transportation cost data preprocessing

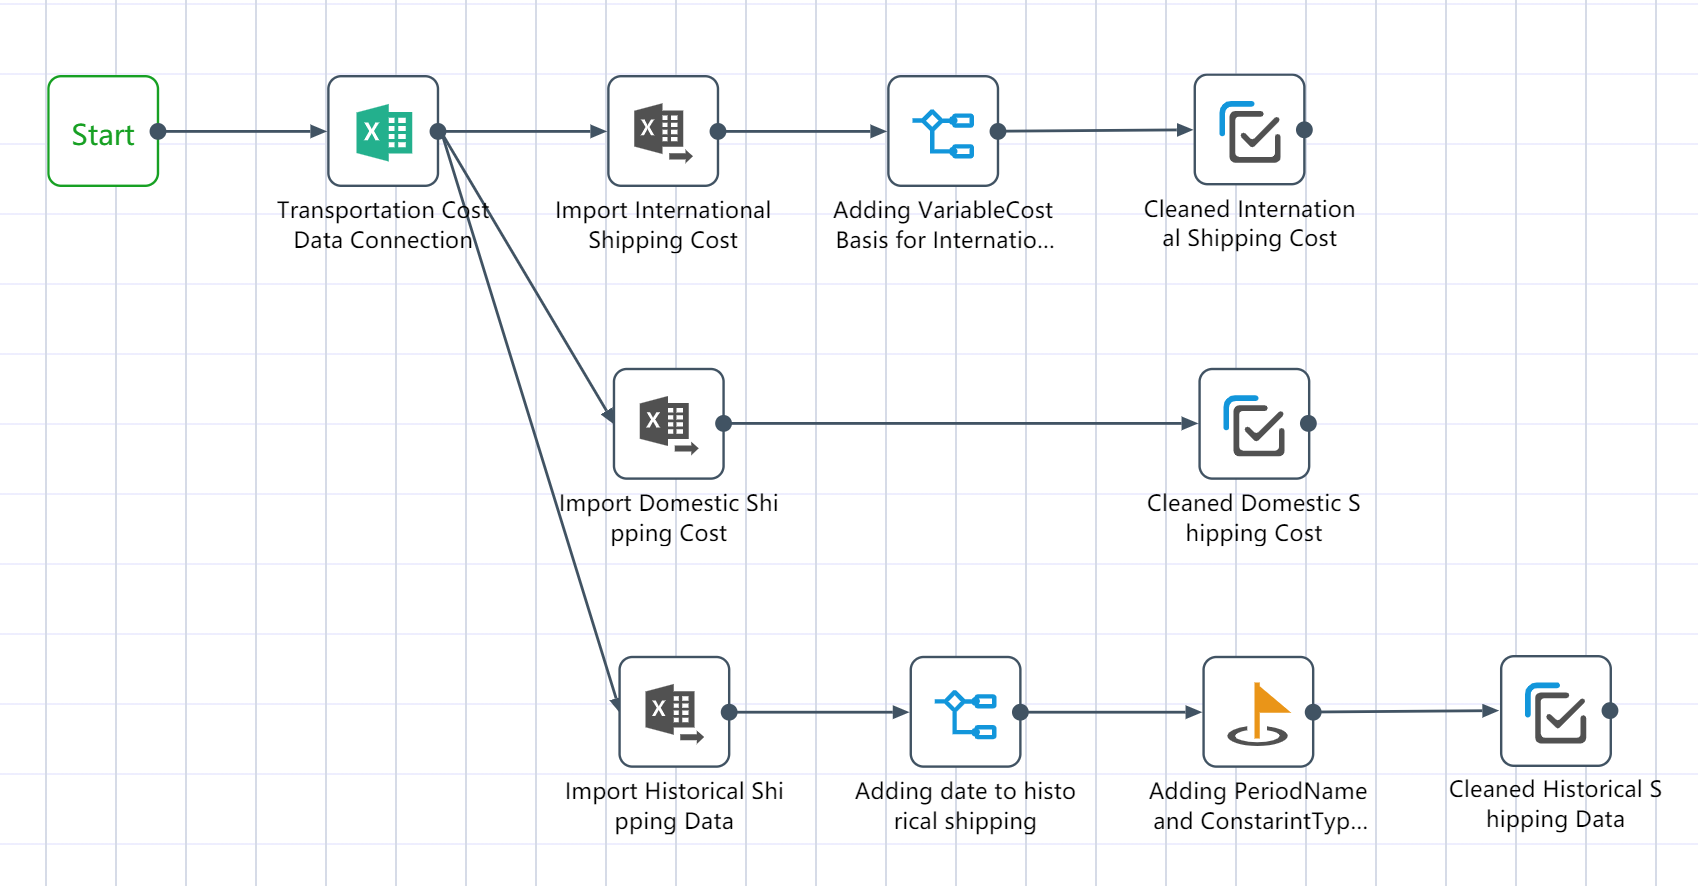
After the node group is completed, 3 output tables will be obtained: the international section transportation quotation has been cleaned, the local section transportation quotation has been cleaned, and the historical transportation volume has been processed.
# New Node: Transportation Cost Data Connection
- operation steps, refer to New Node: Connect to Original Data Table (Excel connection)
After the operation is completed, check whether it is consistent with the following figure.
# New Node: Import International Shipping Cost
Goal: Import the original data table "International shipping cost"
- For operation steps, refer to New Node: Importing Facility Location Data
After the operation is completed, check whether it is consistent with the following figure.

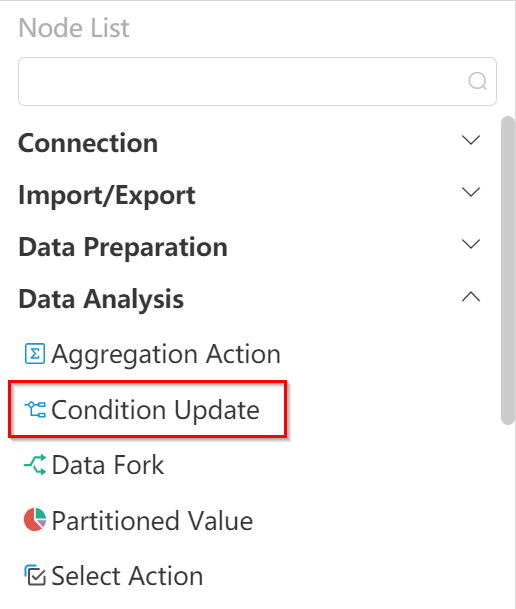
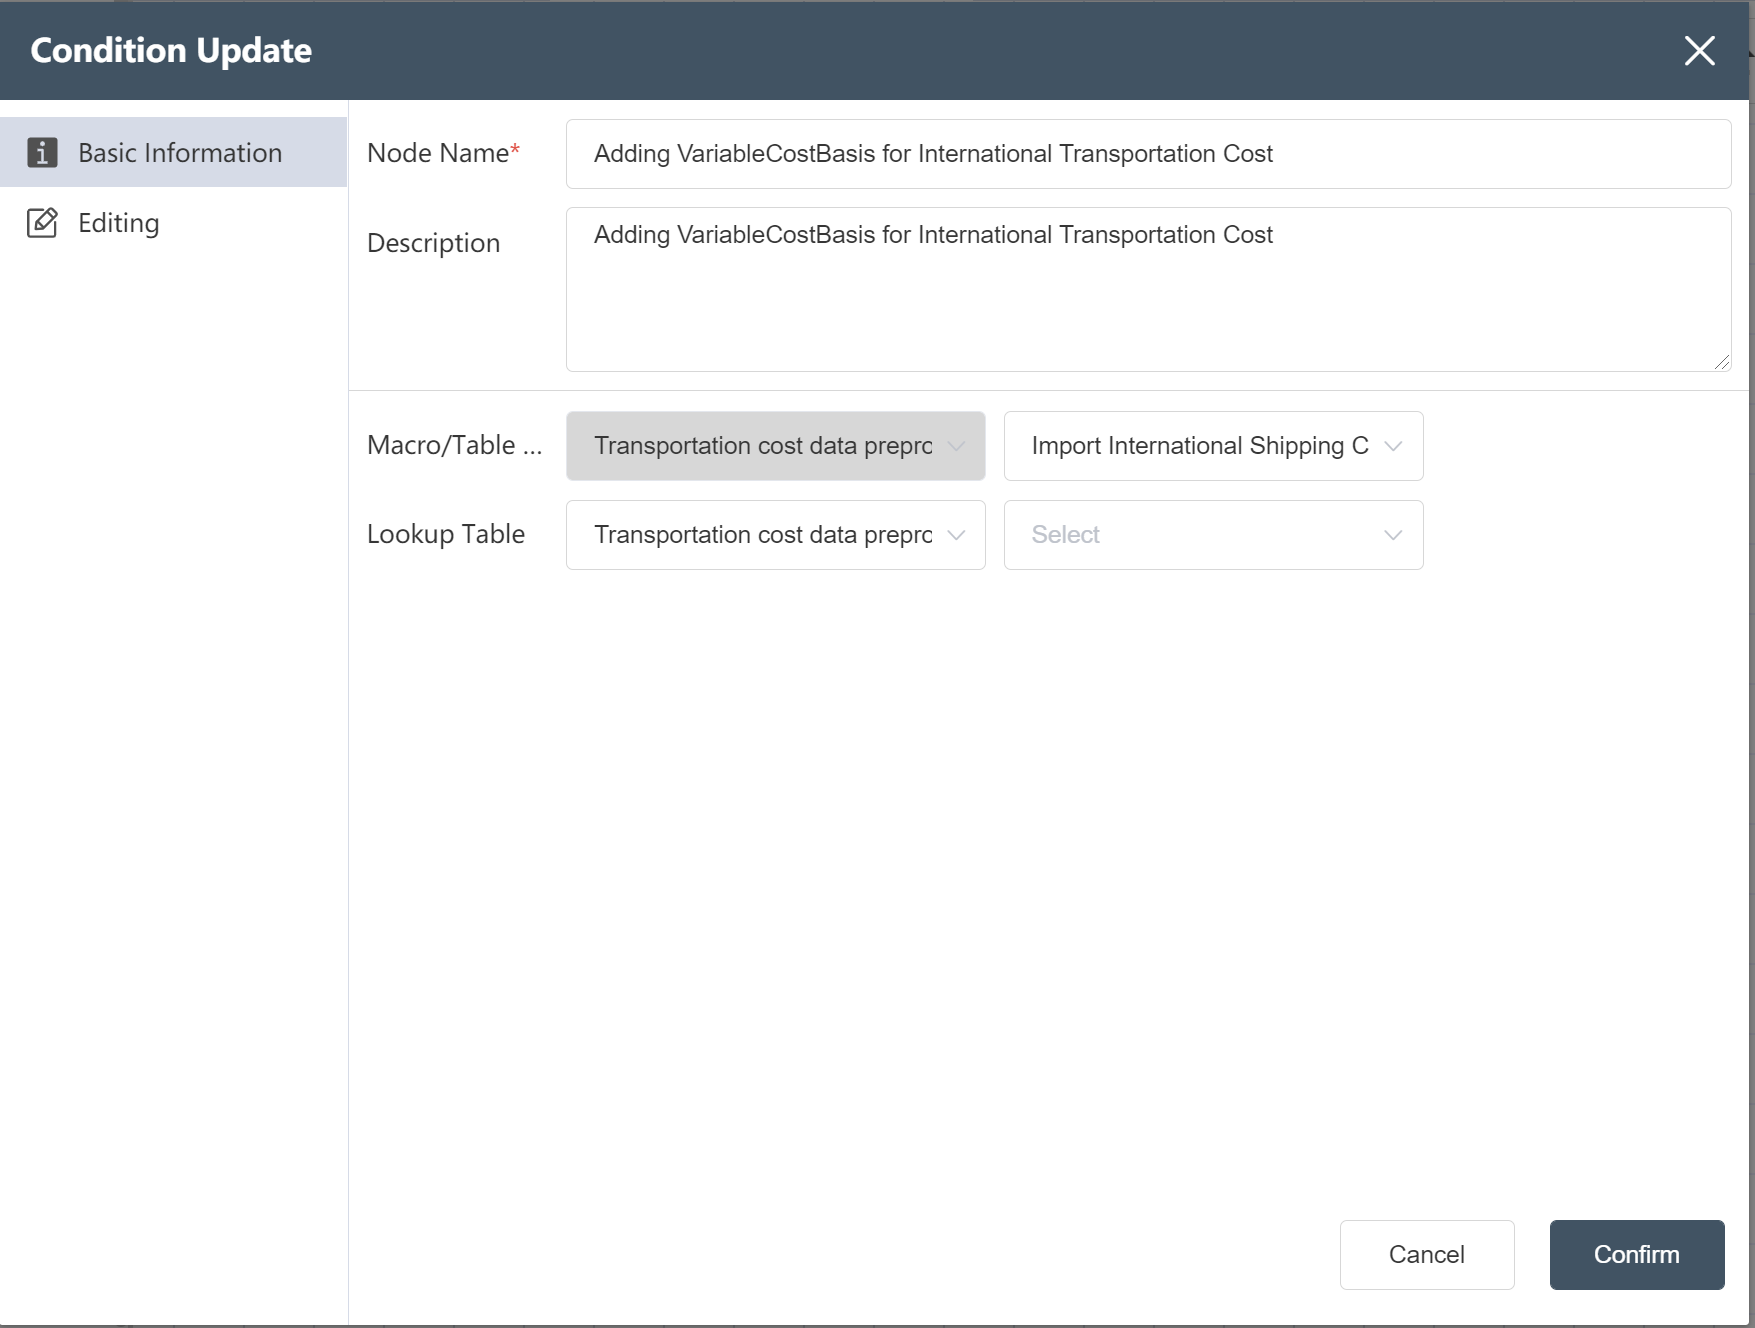
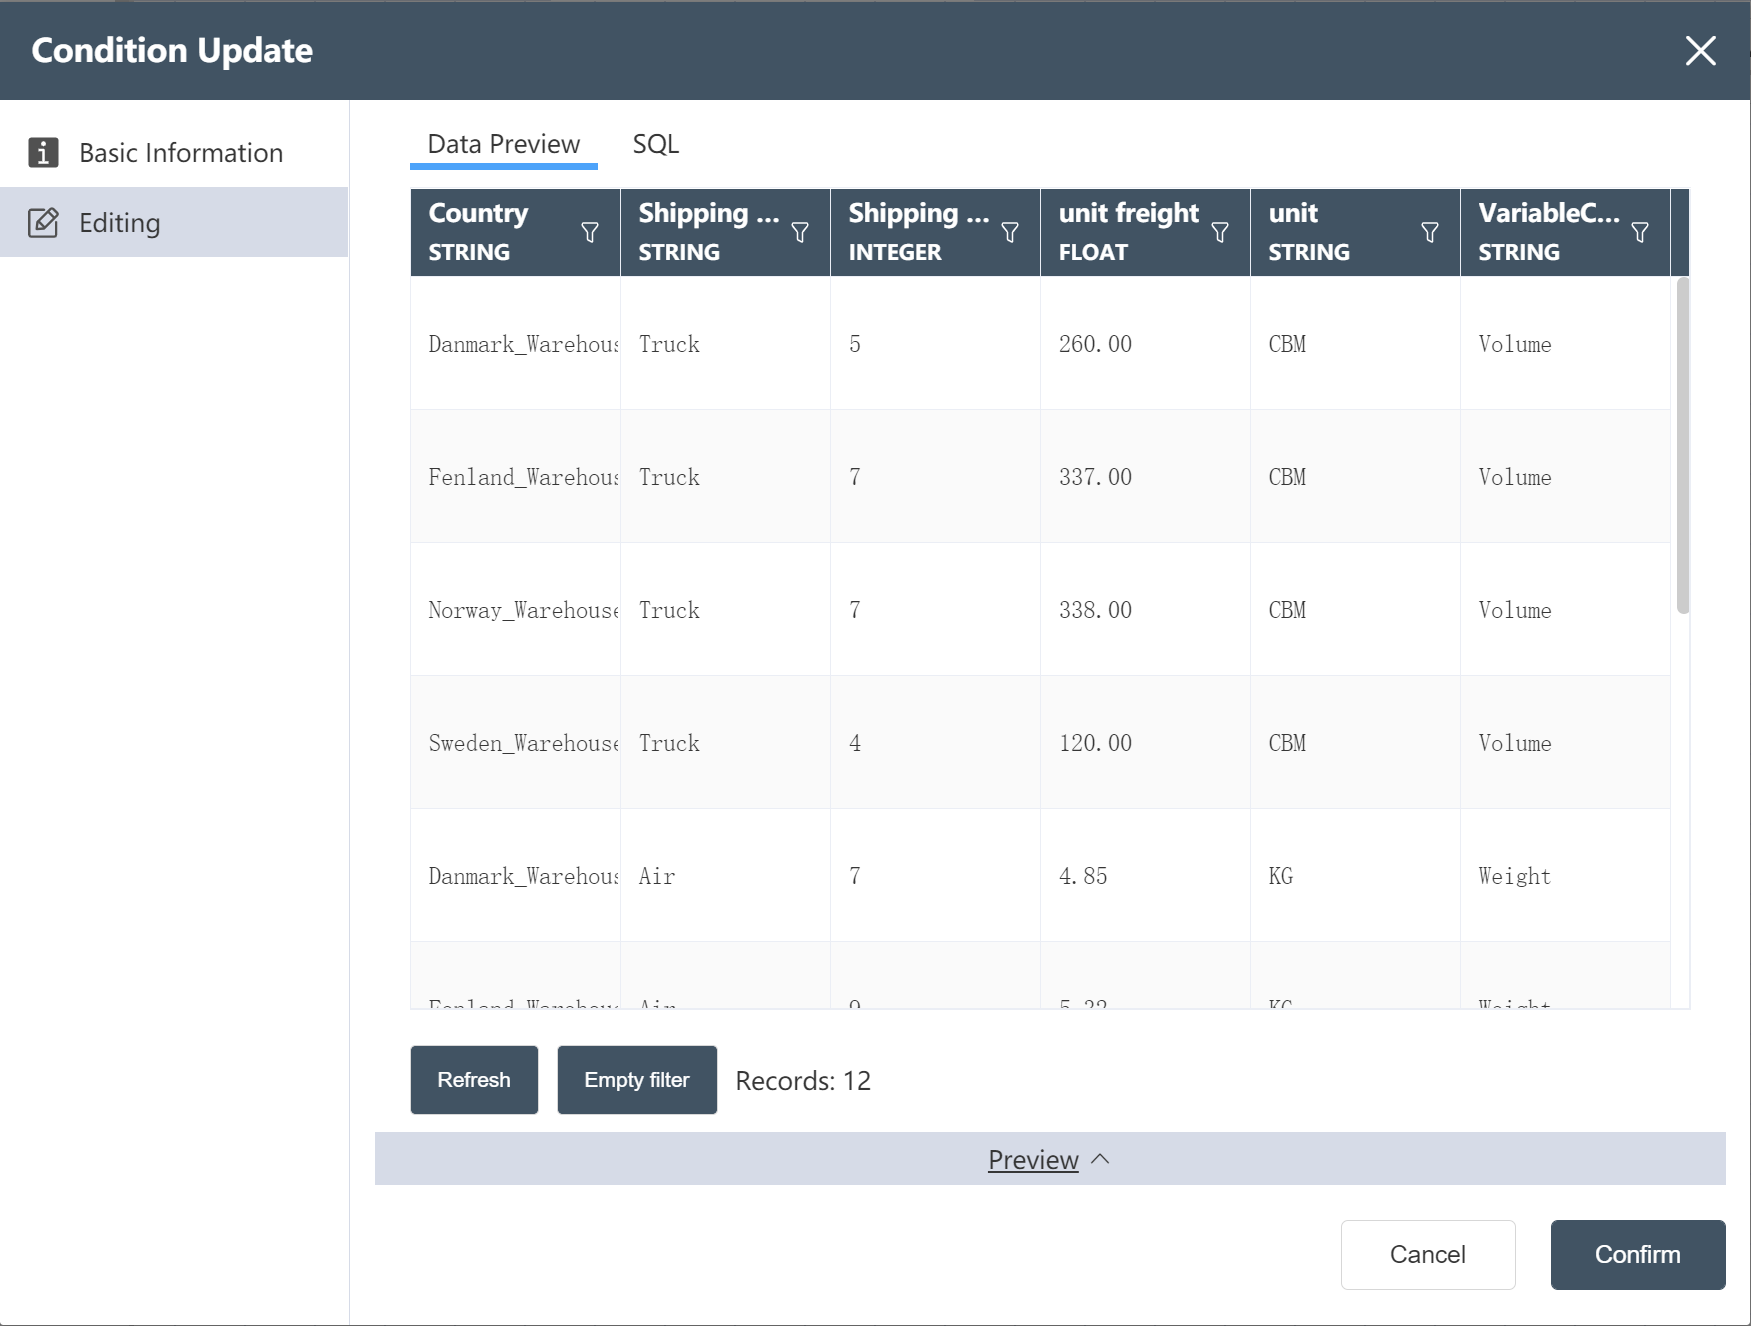
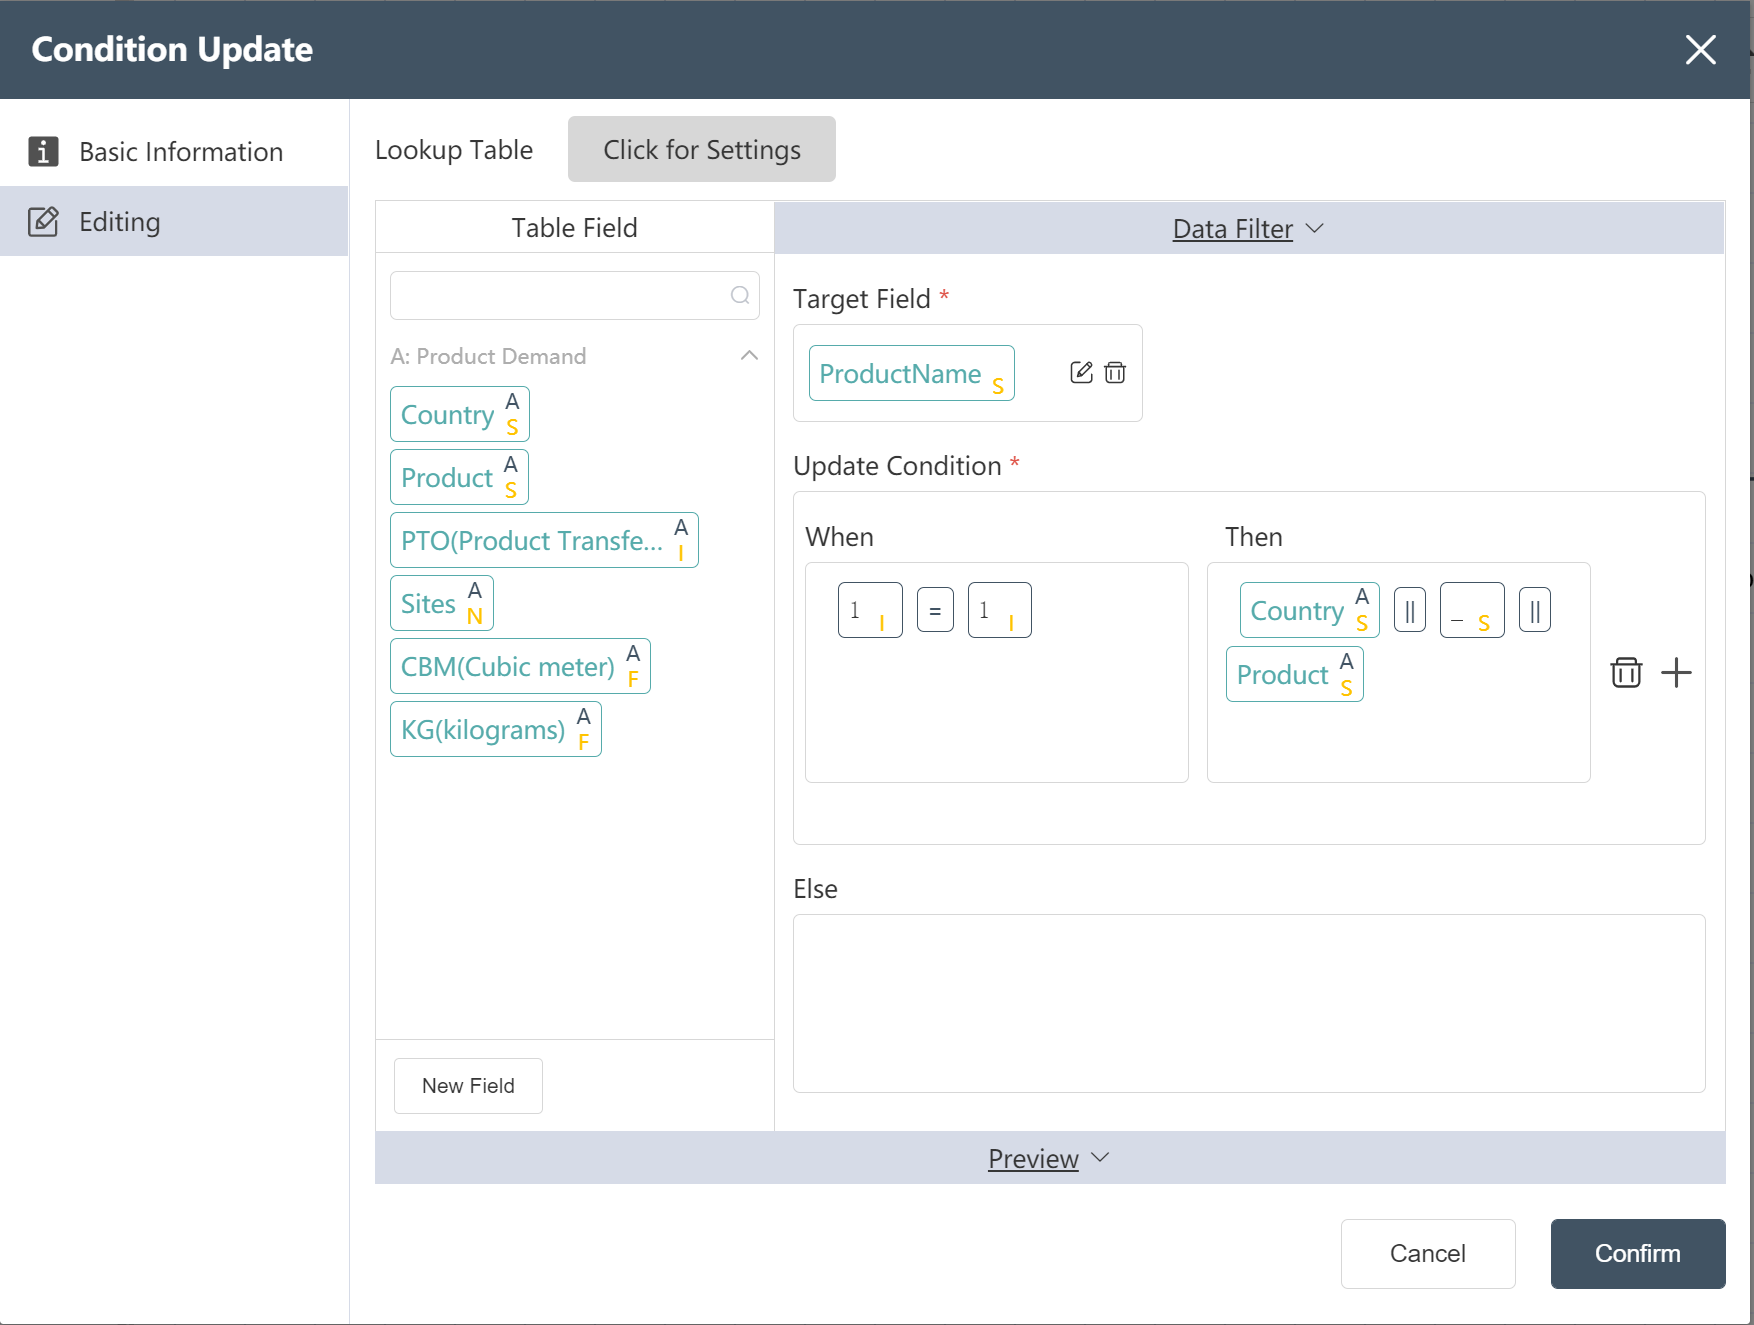
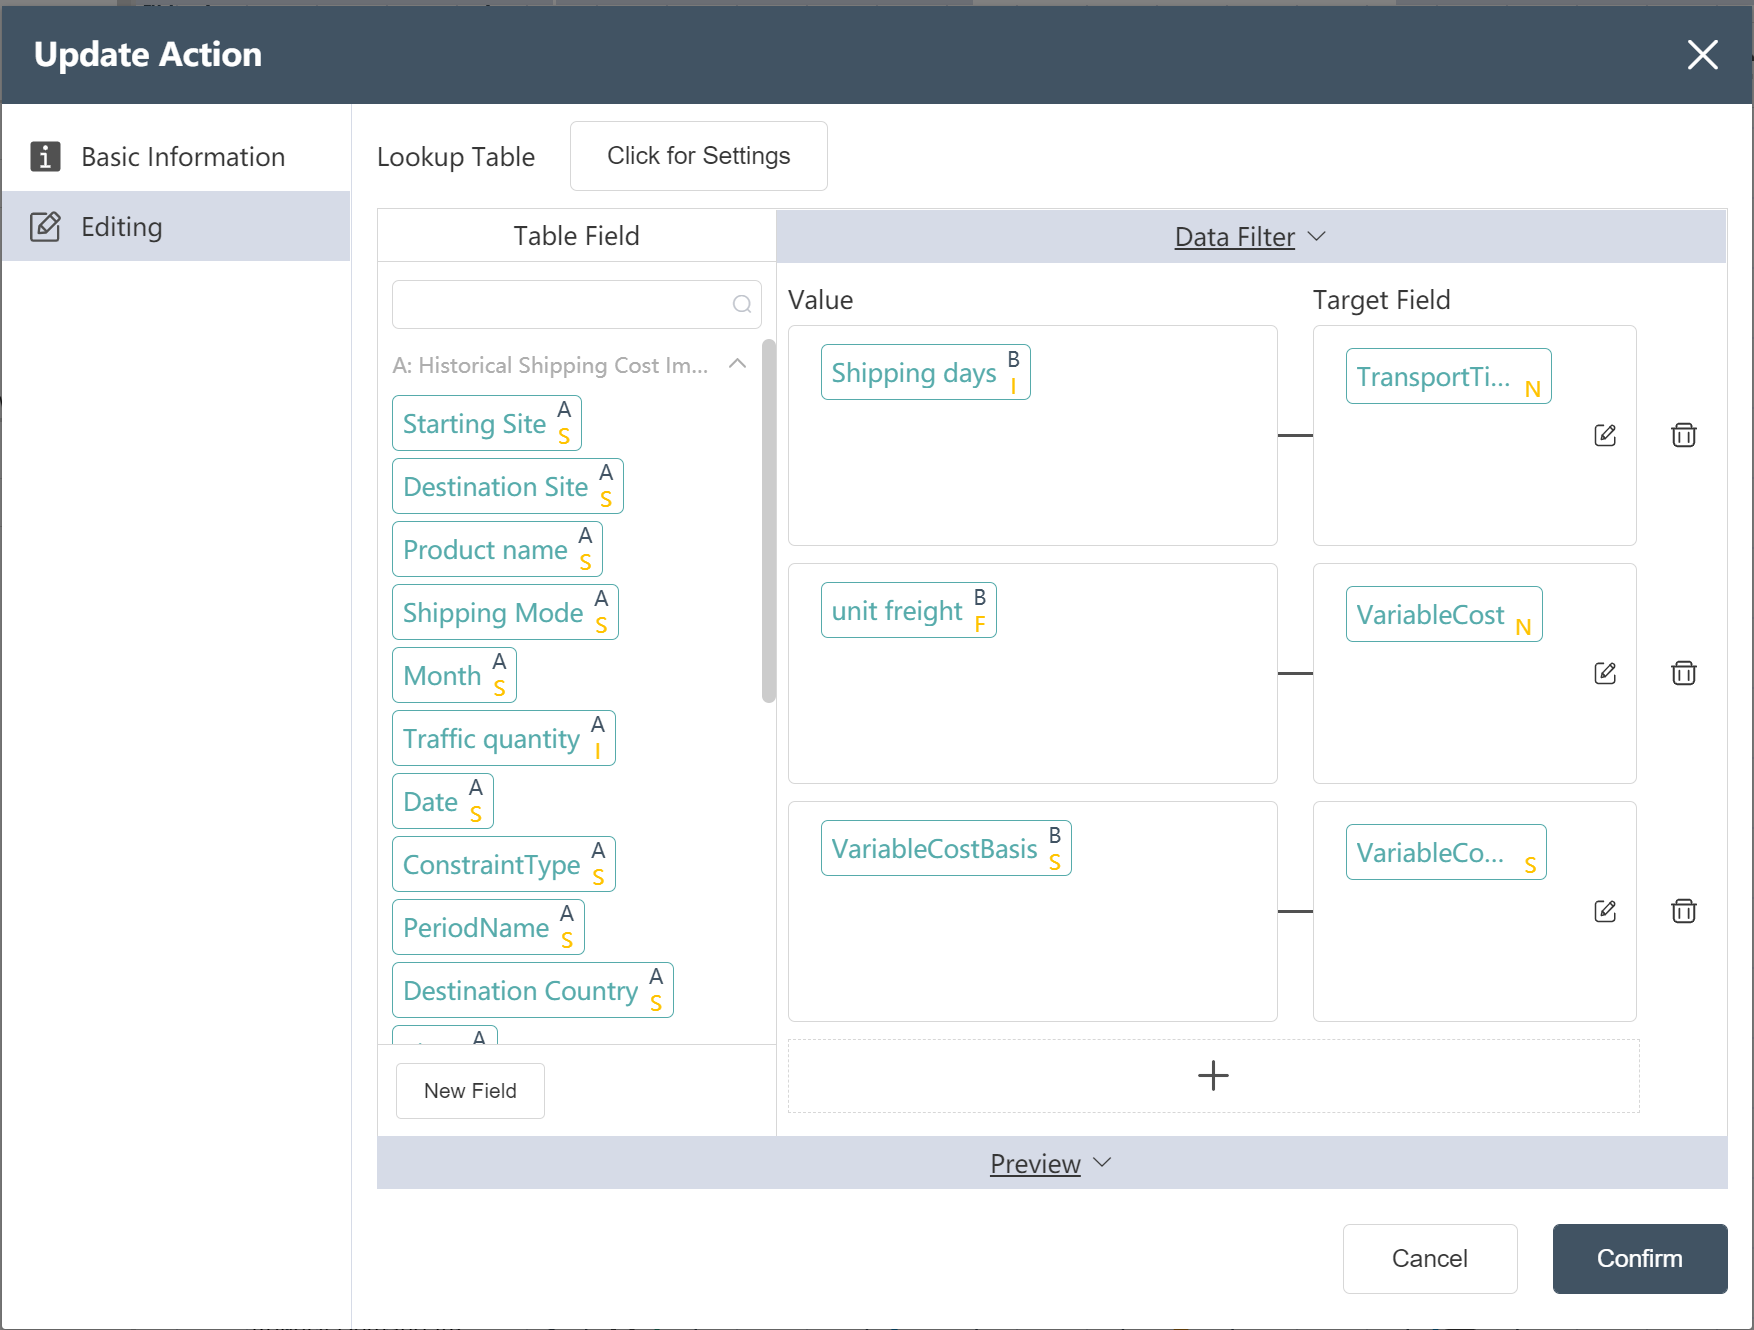
# New Node: Adding VariableCostBasis for International Transportation Cost
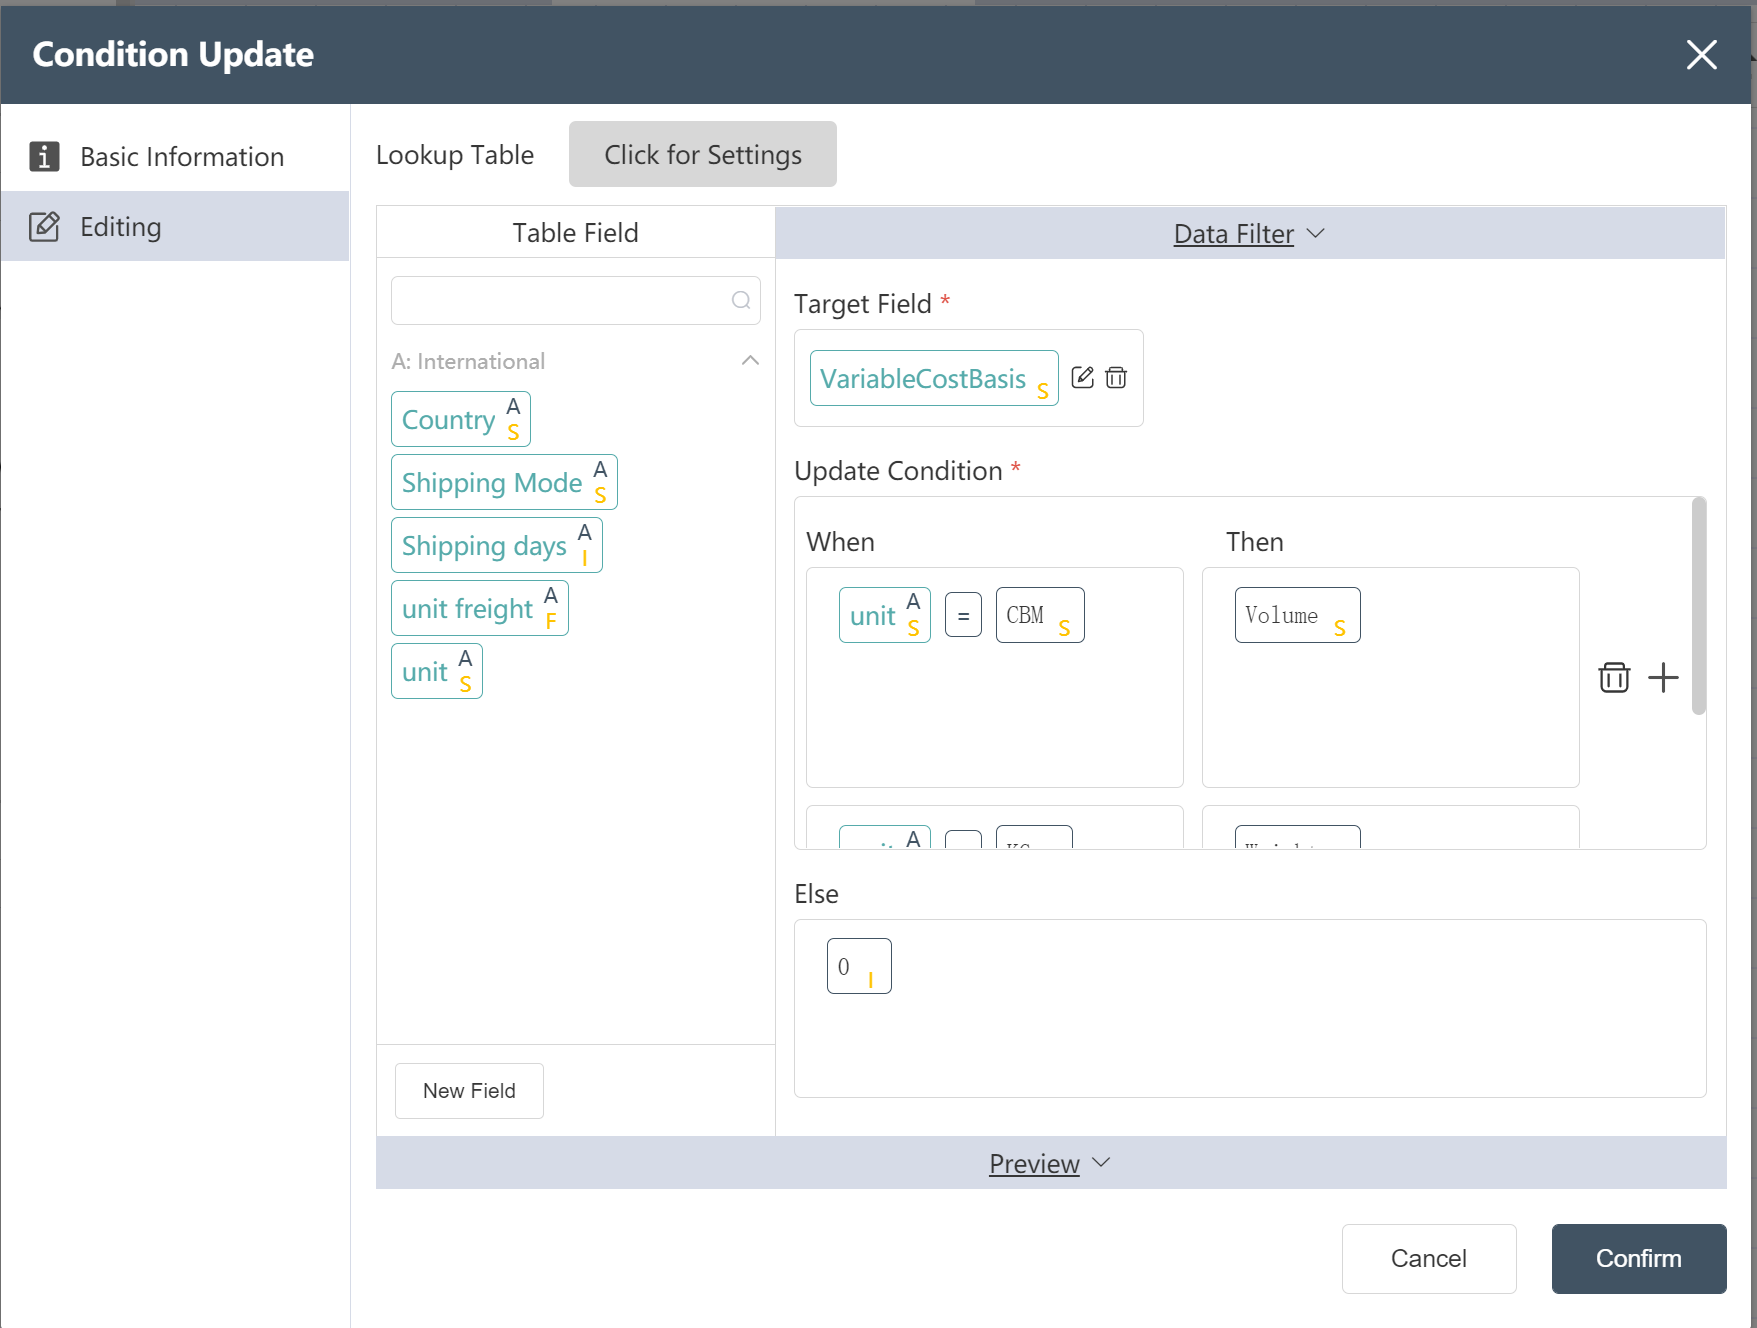
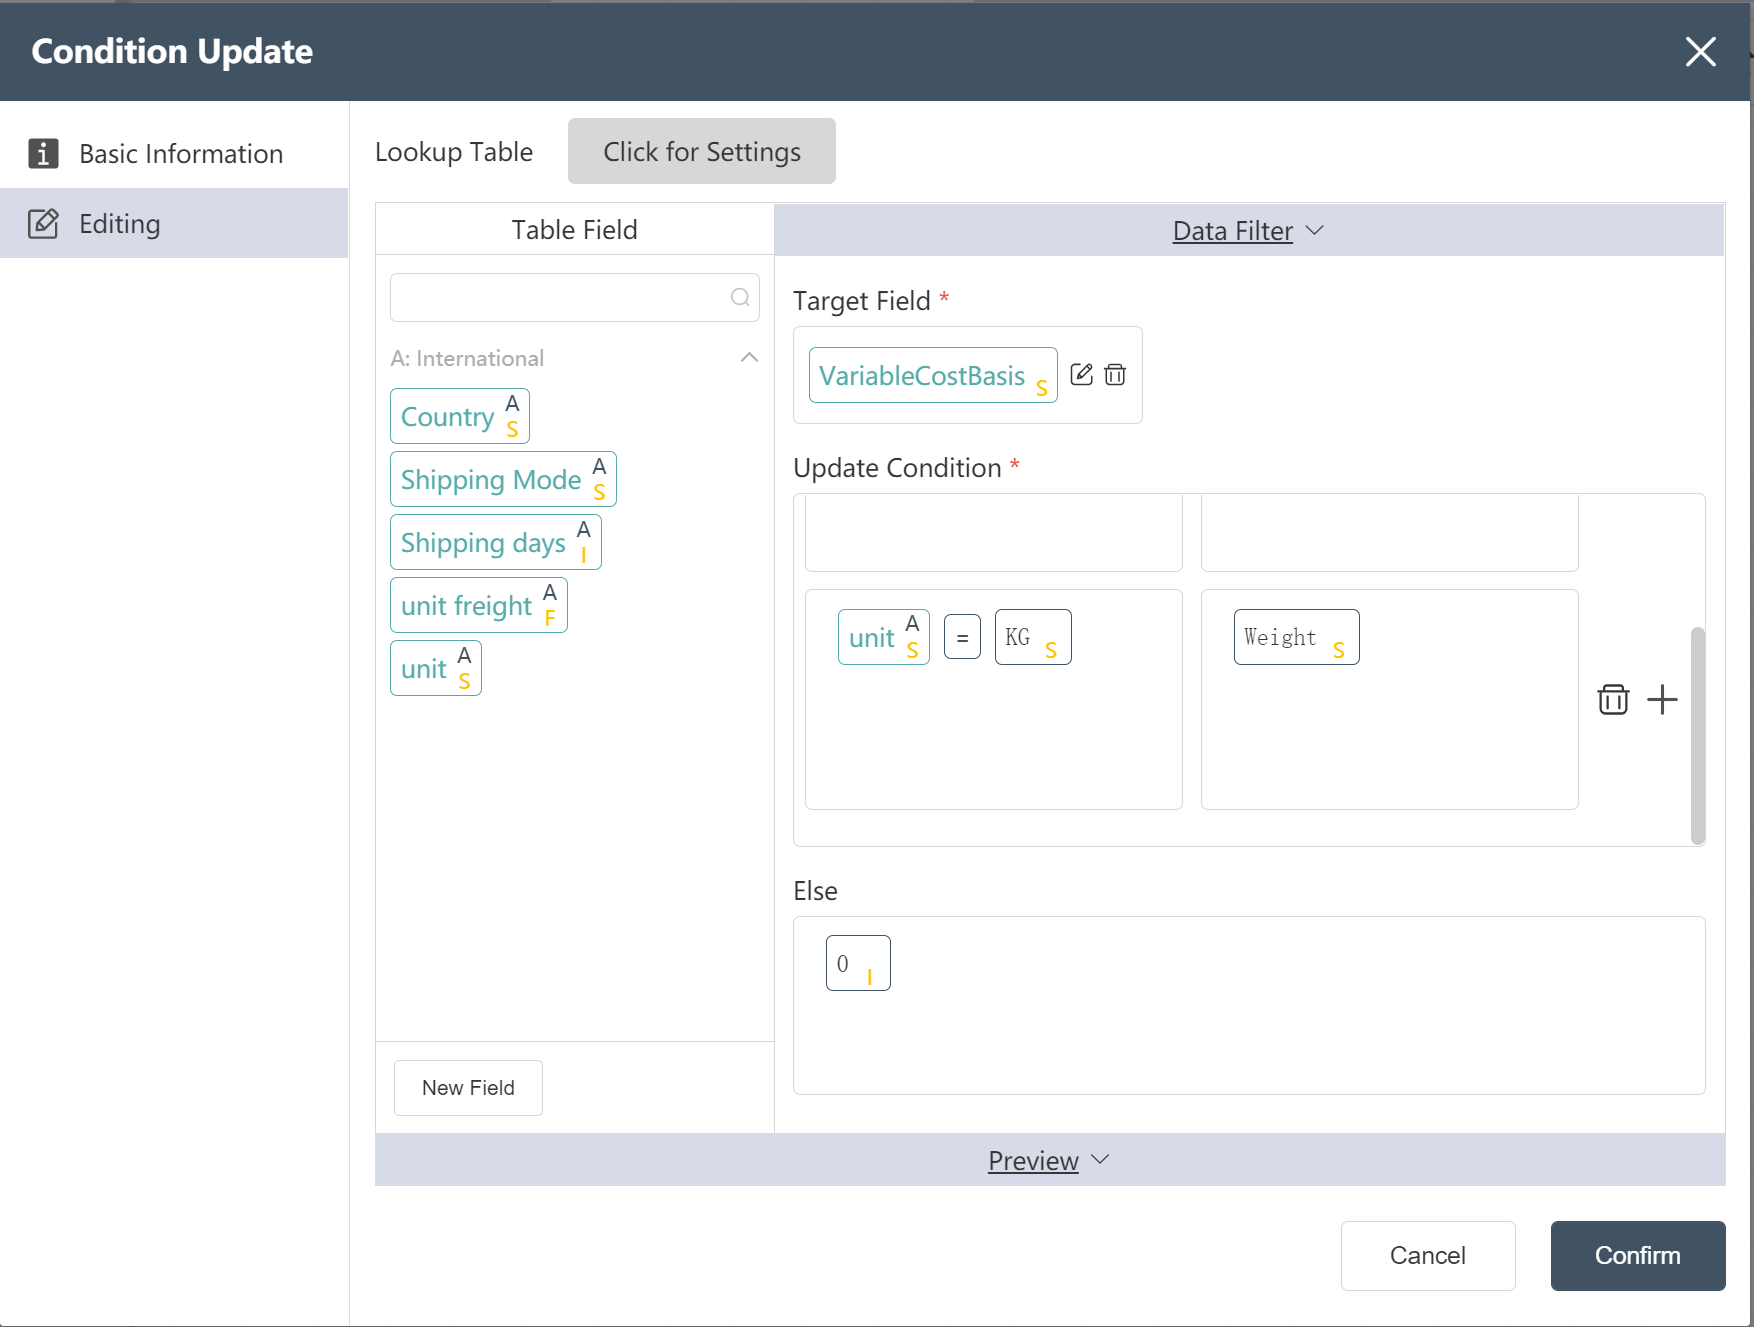
Goal: Prepare a shipping strategy table in Scatlas with a cost basis field. The cost basis in units of squares is Volume, and the cost basis in kilograms is Weight.
- Double click/drag the [Condition Update] node to the editing area
- custom node name
- Select target data
- In the data edit menu, drag the new field into the target field
- Set update conditions (IF, THEN, ELSE)
- Fill in "Data Edit" (see below)
- Click the edit icon to filter the corresponding output fields
- Click to confirm
- Connect to the previous node and hit run
After the operation is complete, you can click Preview to view the result.
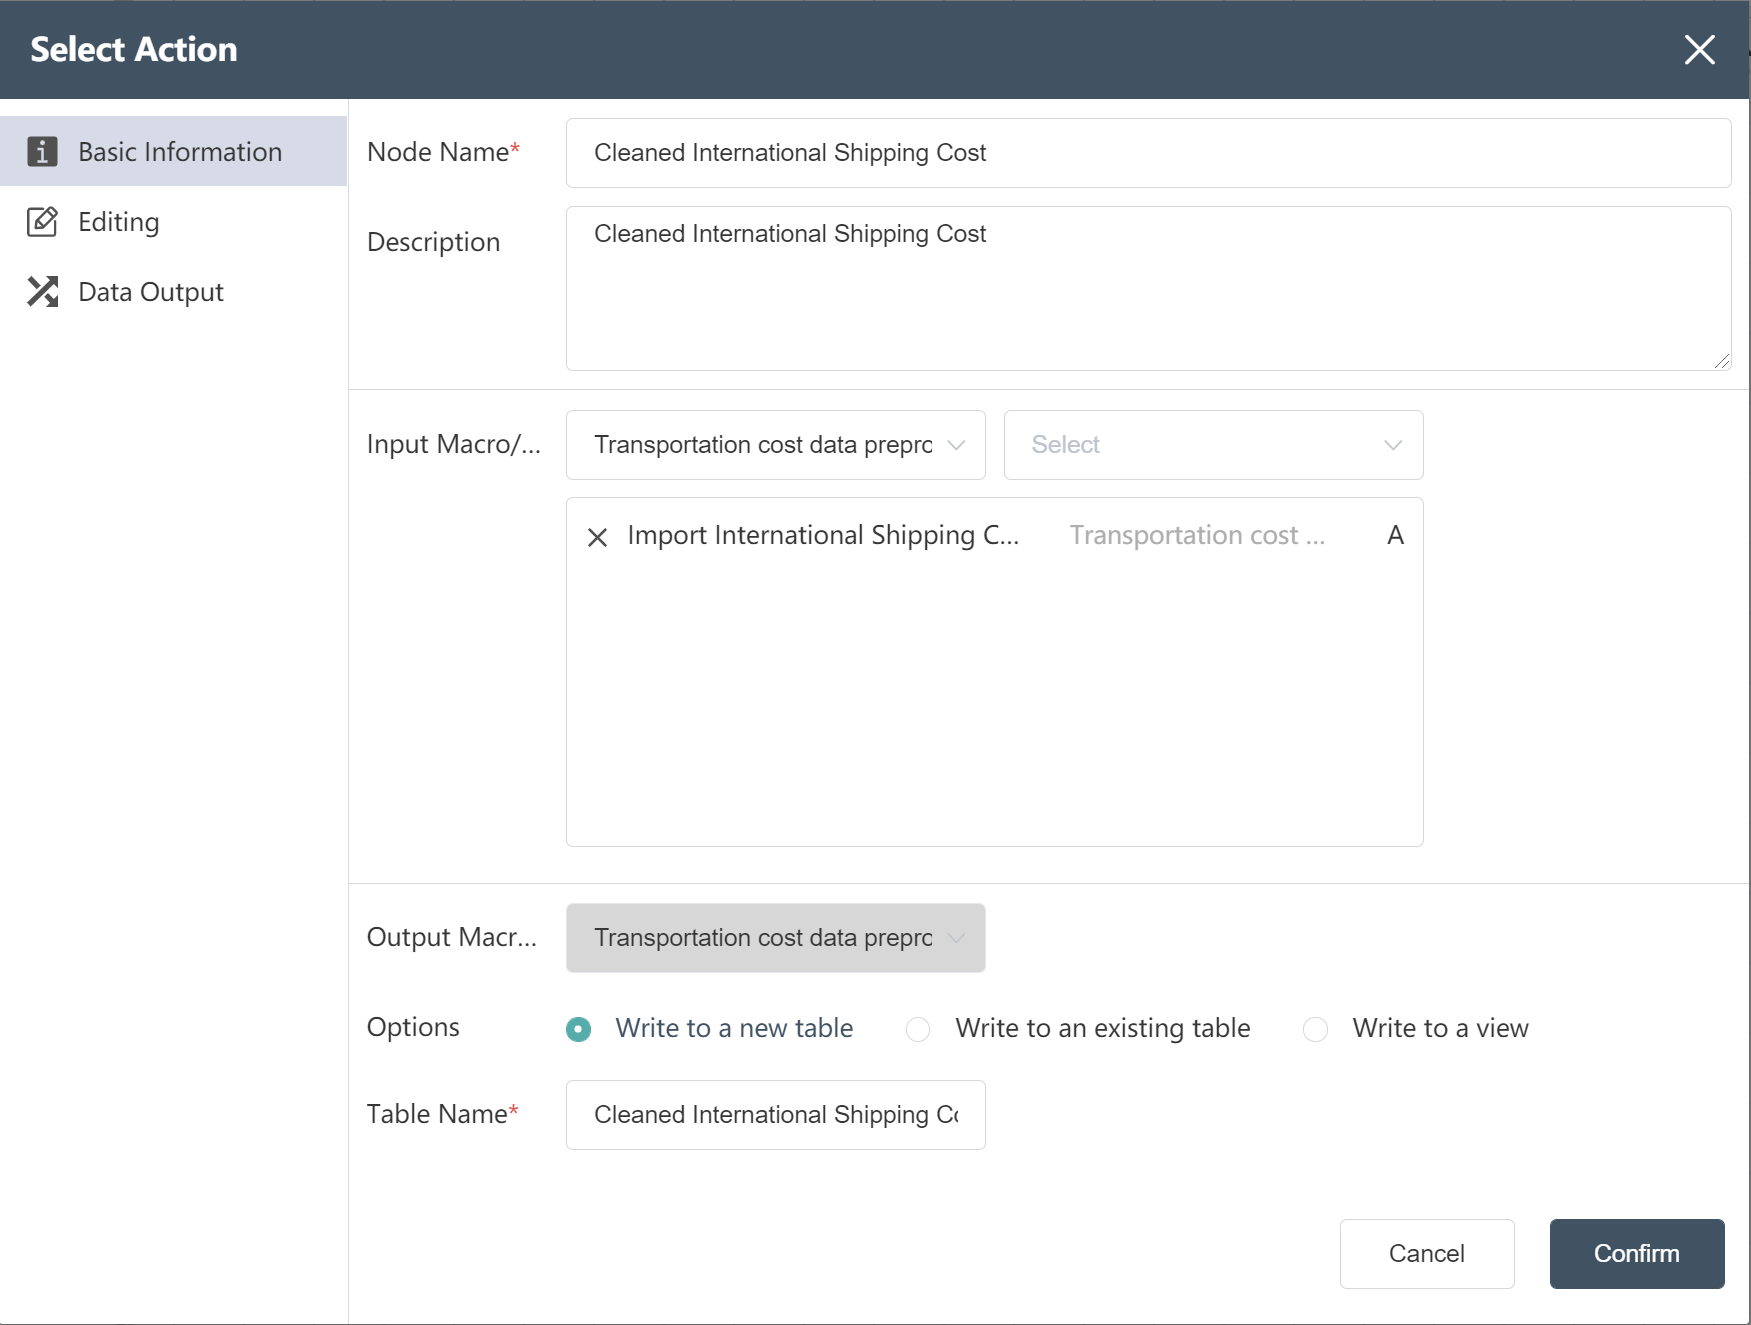
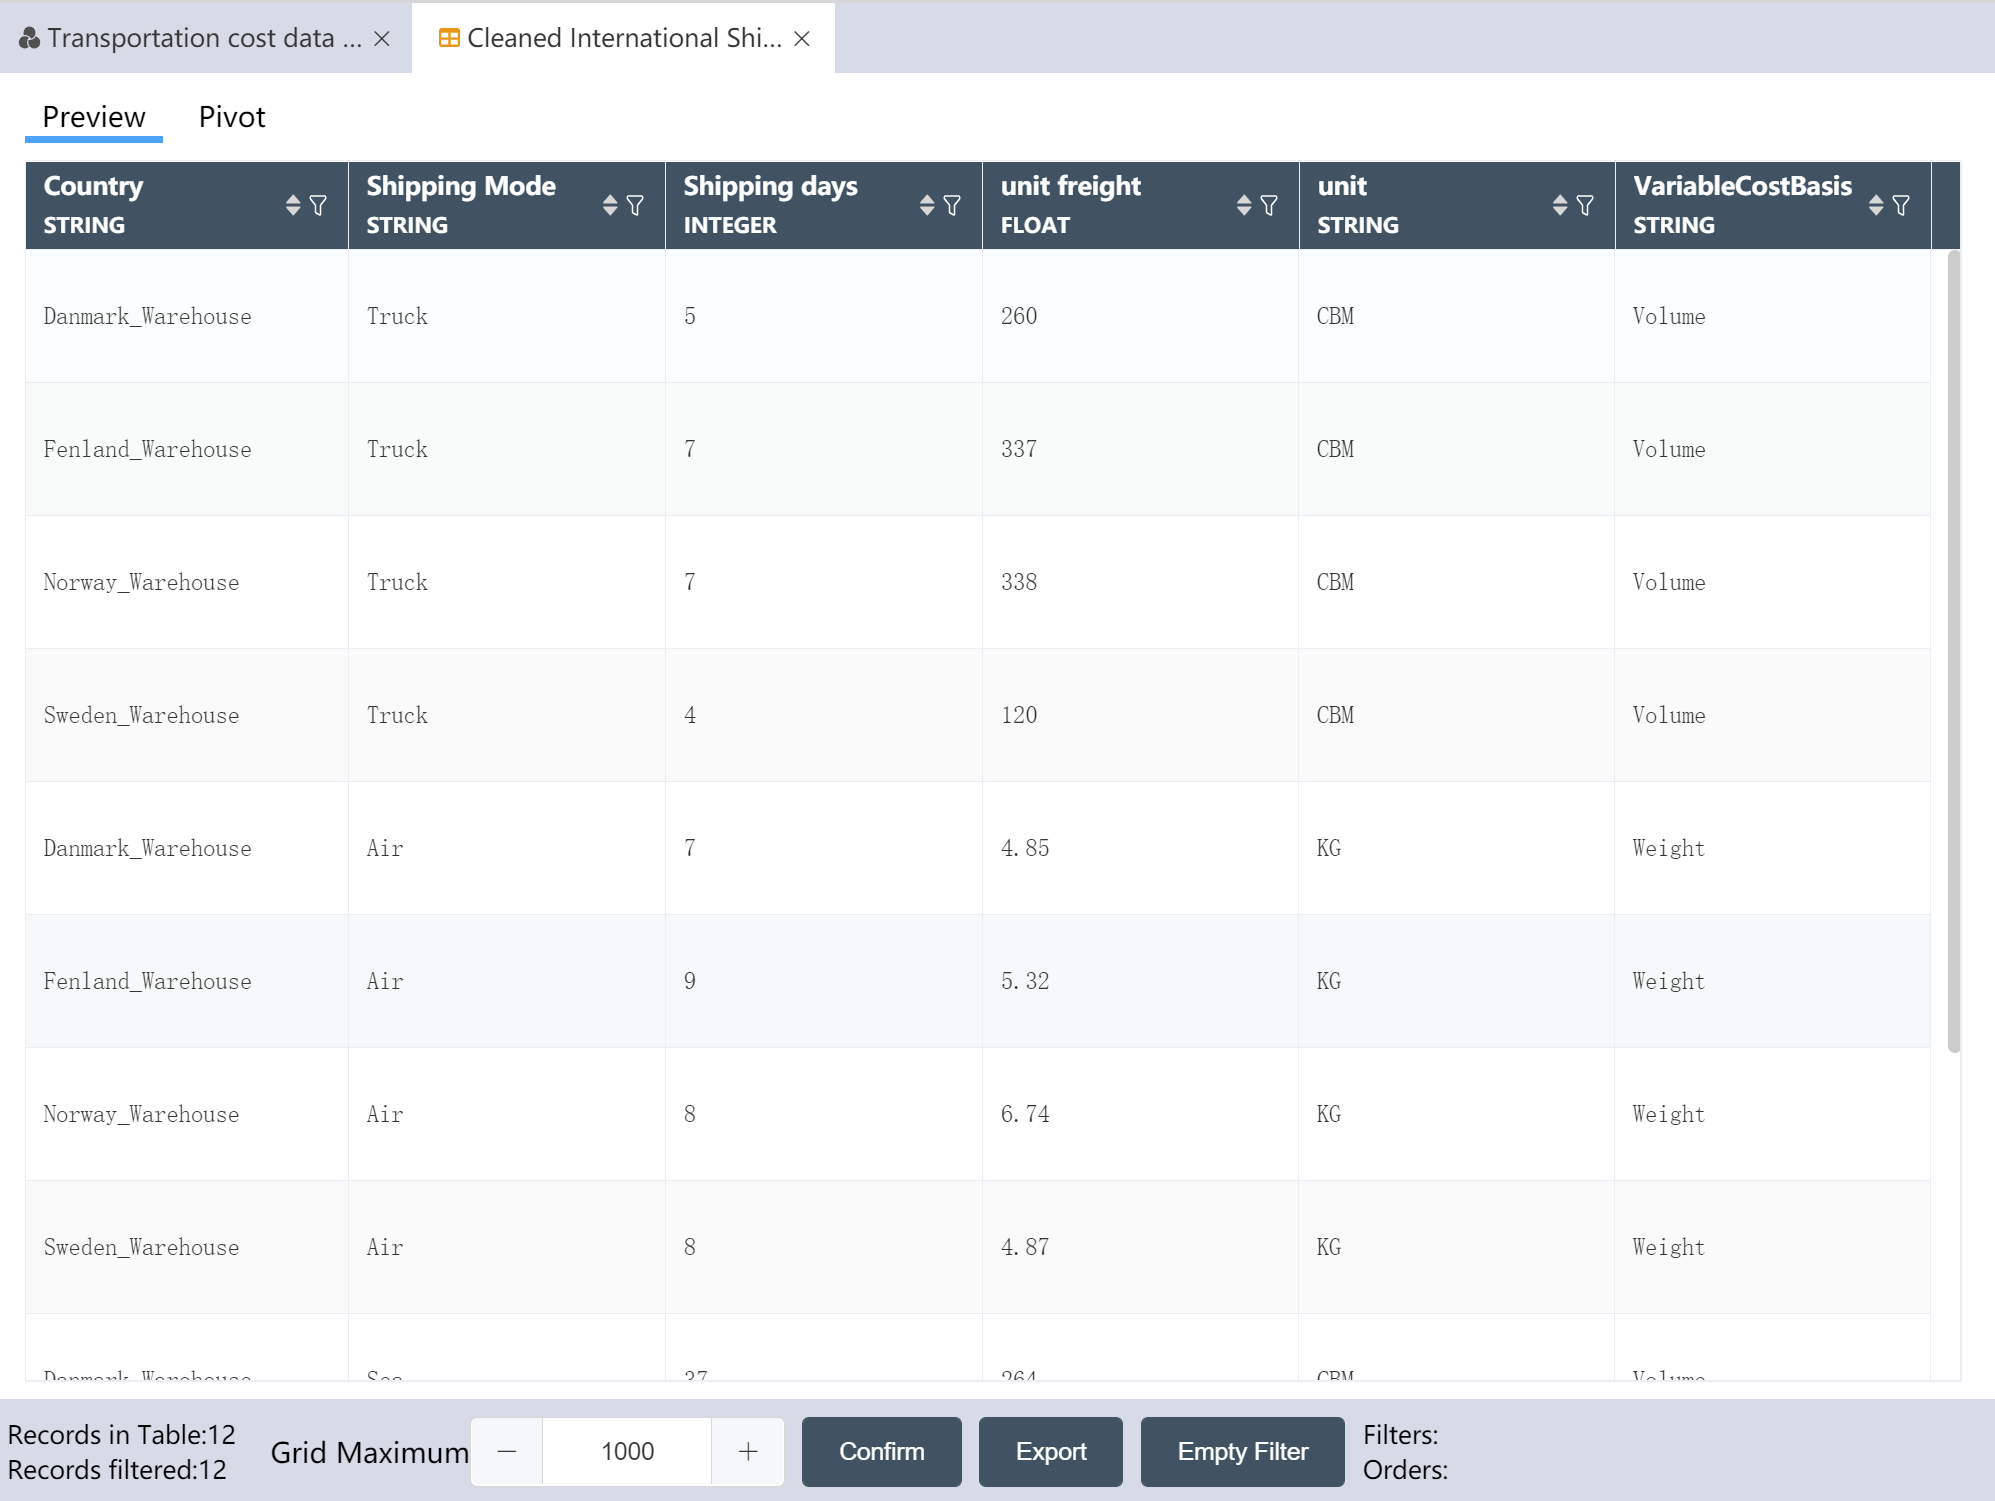
# New Node: Cleaned International Shipping Cost
- For operation steps, refer to New Node: Cleaned Facility Location Data
The operation is complete, and the cleaned international segment shipping quotation is written to a new table.
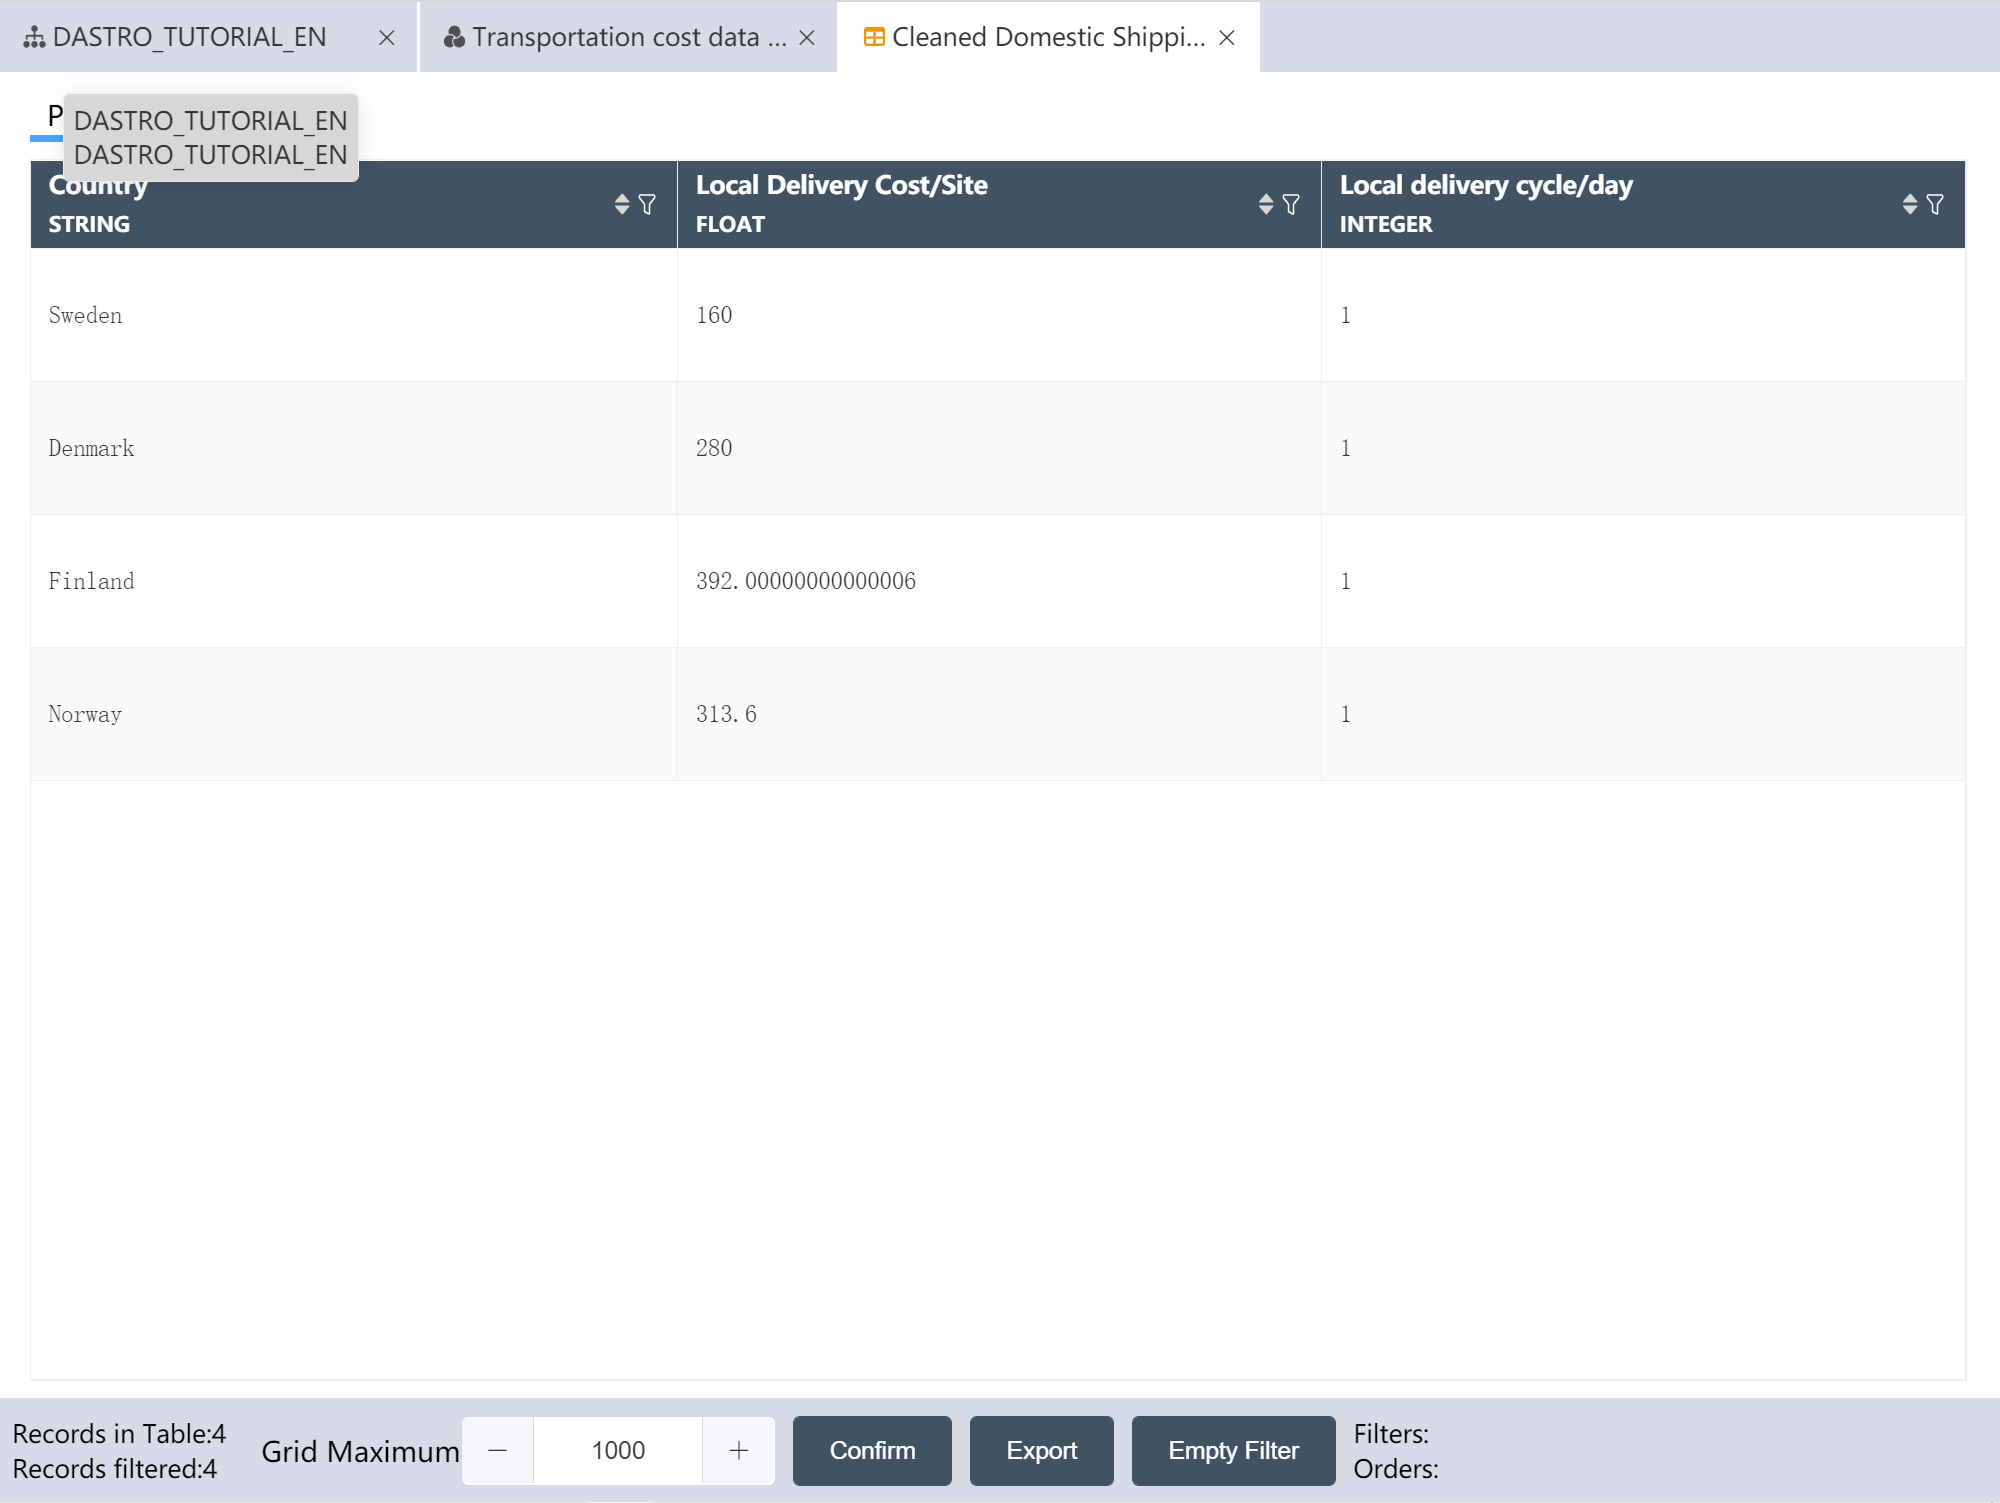
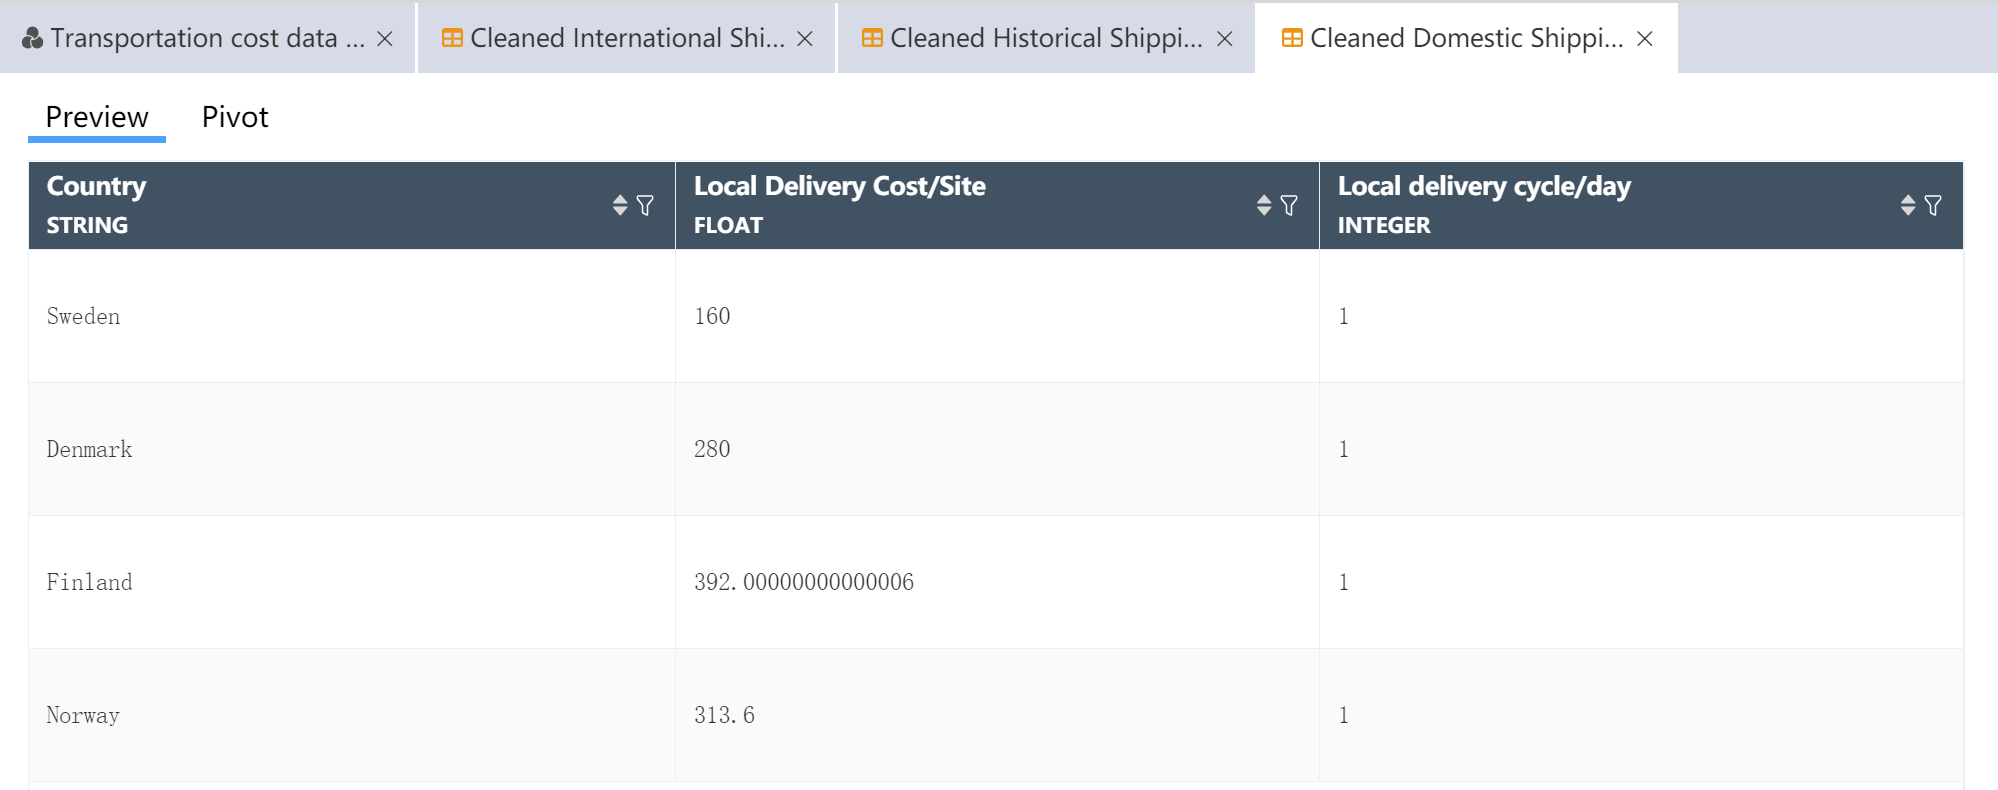
# Construction of local transportation quotation nodes
- Refer to New Node: Import International Section Transportation Quotation Create Node: Import Local Section Transportation Quotation
- Refer to New Node: Cleaned International Section Transportation Quote Create Node: Cleaned Local Section Transportation Quote
After the operation is completed, check whether the result is consistent with the following figure.
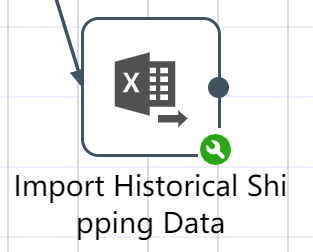
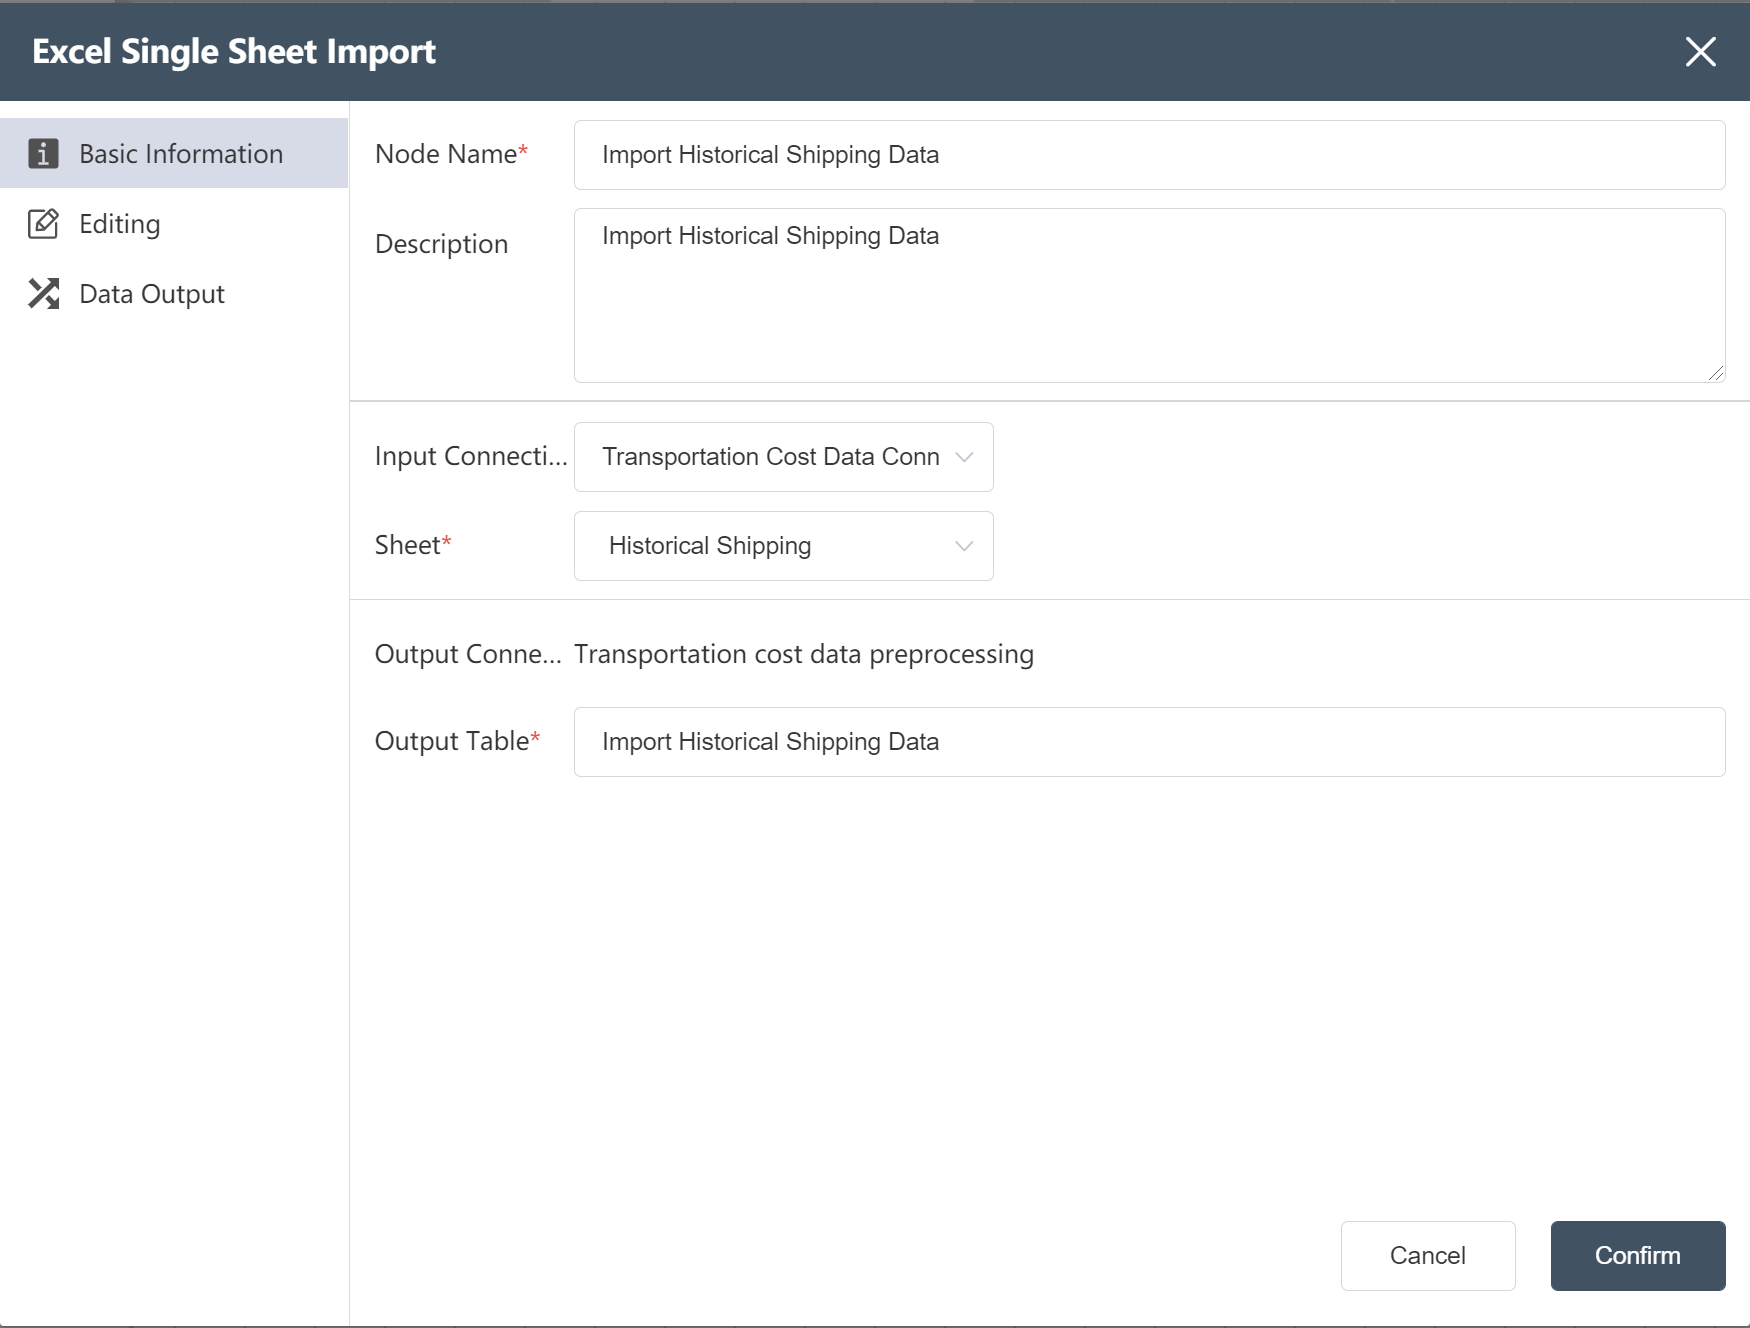
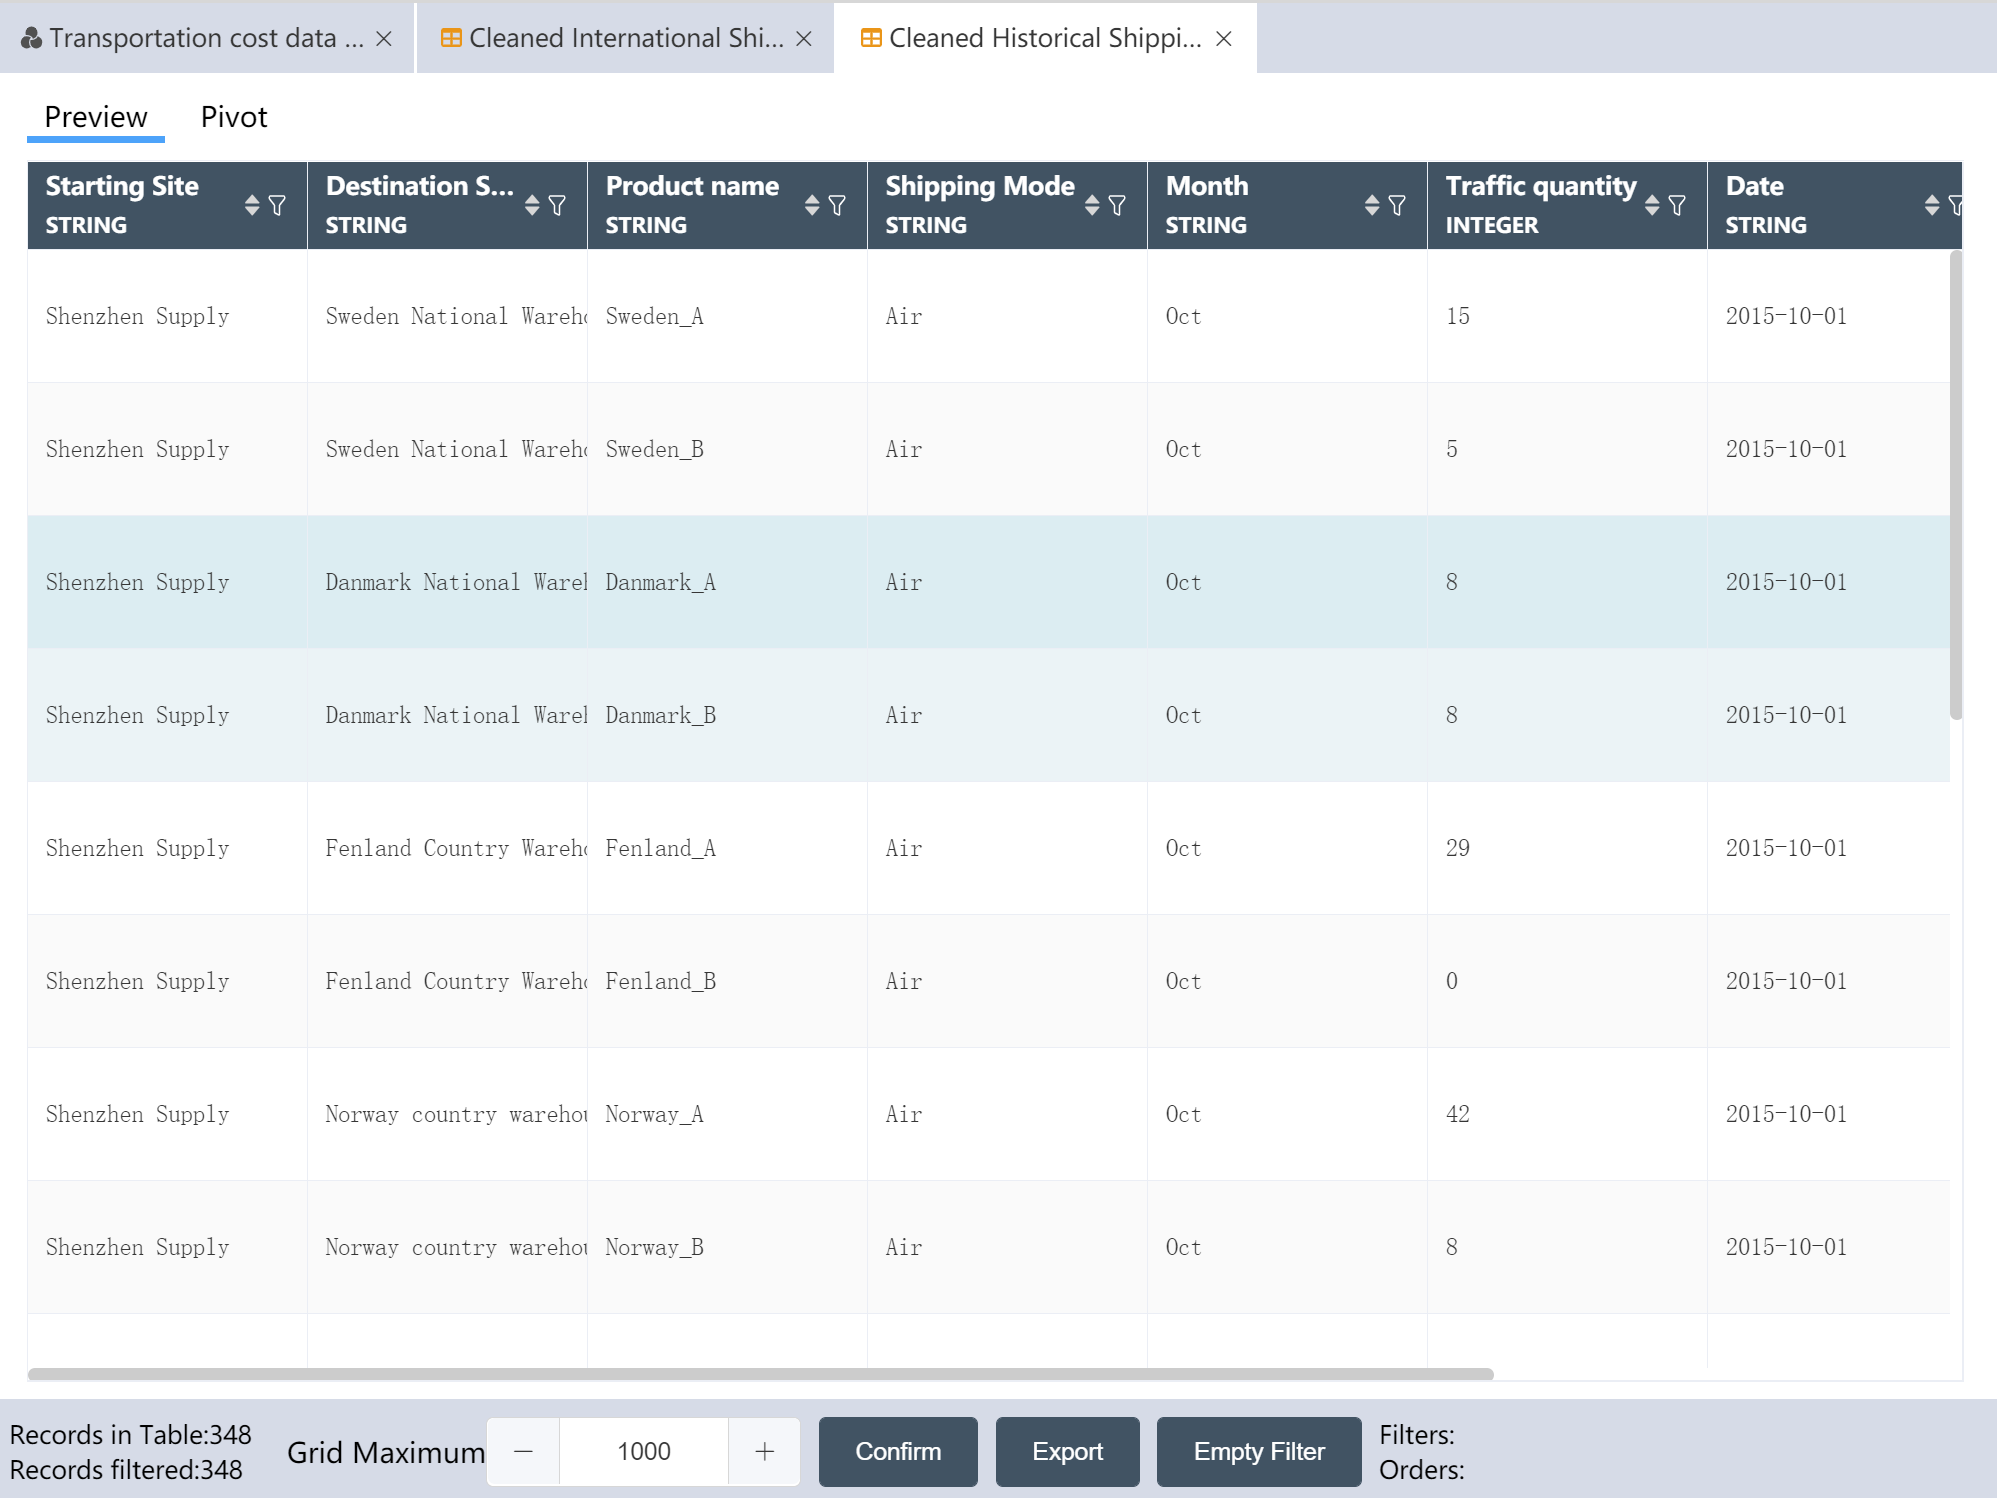
# Create a new node: Import historical shipping data
- For operation steps, refer to New Node: Importing Facility Location Data
After the operation is completed, the raw data of historical traffic is imported into the DASTRO® database.
# New node: Adding date to historical shipping
Goal: Add date based on month, first day of month
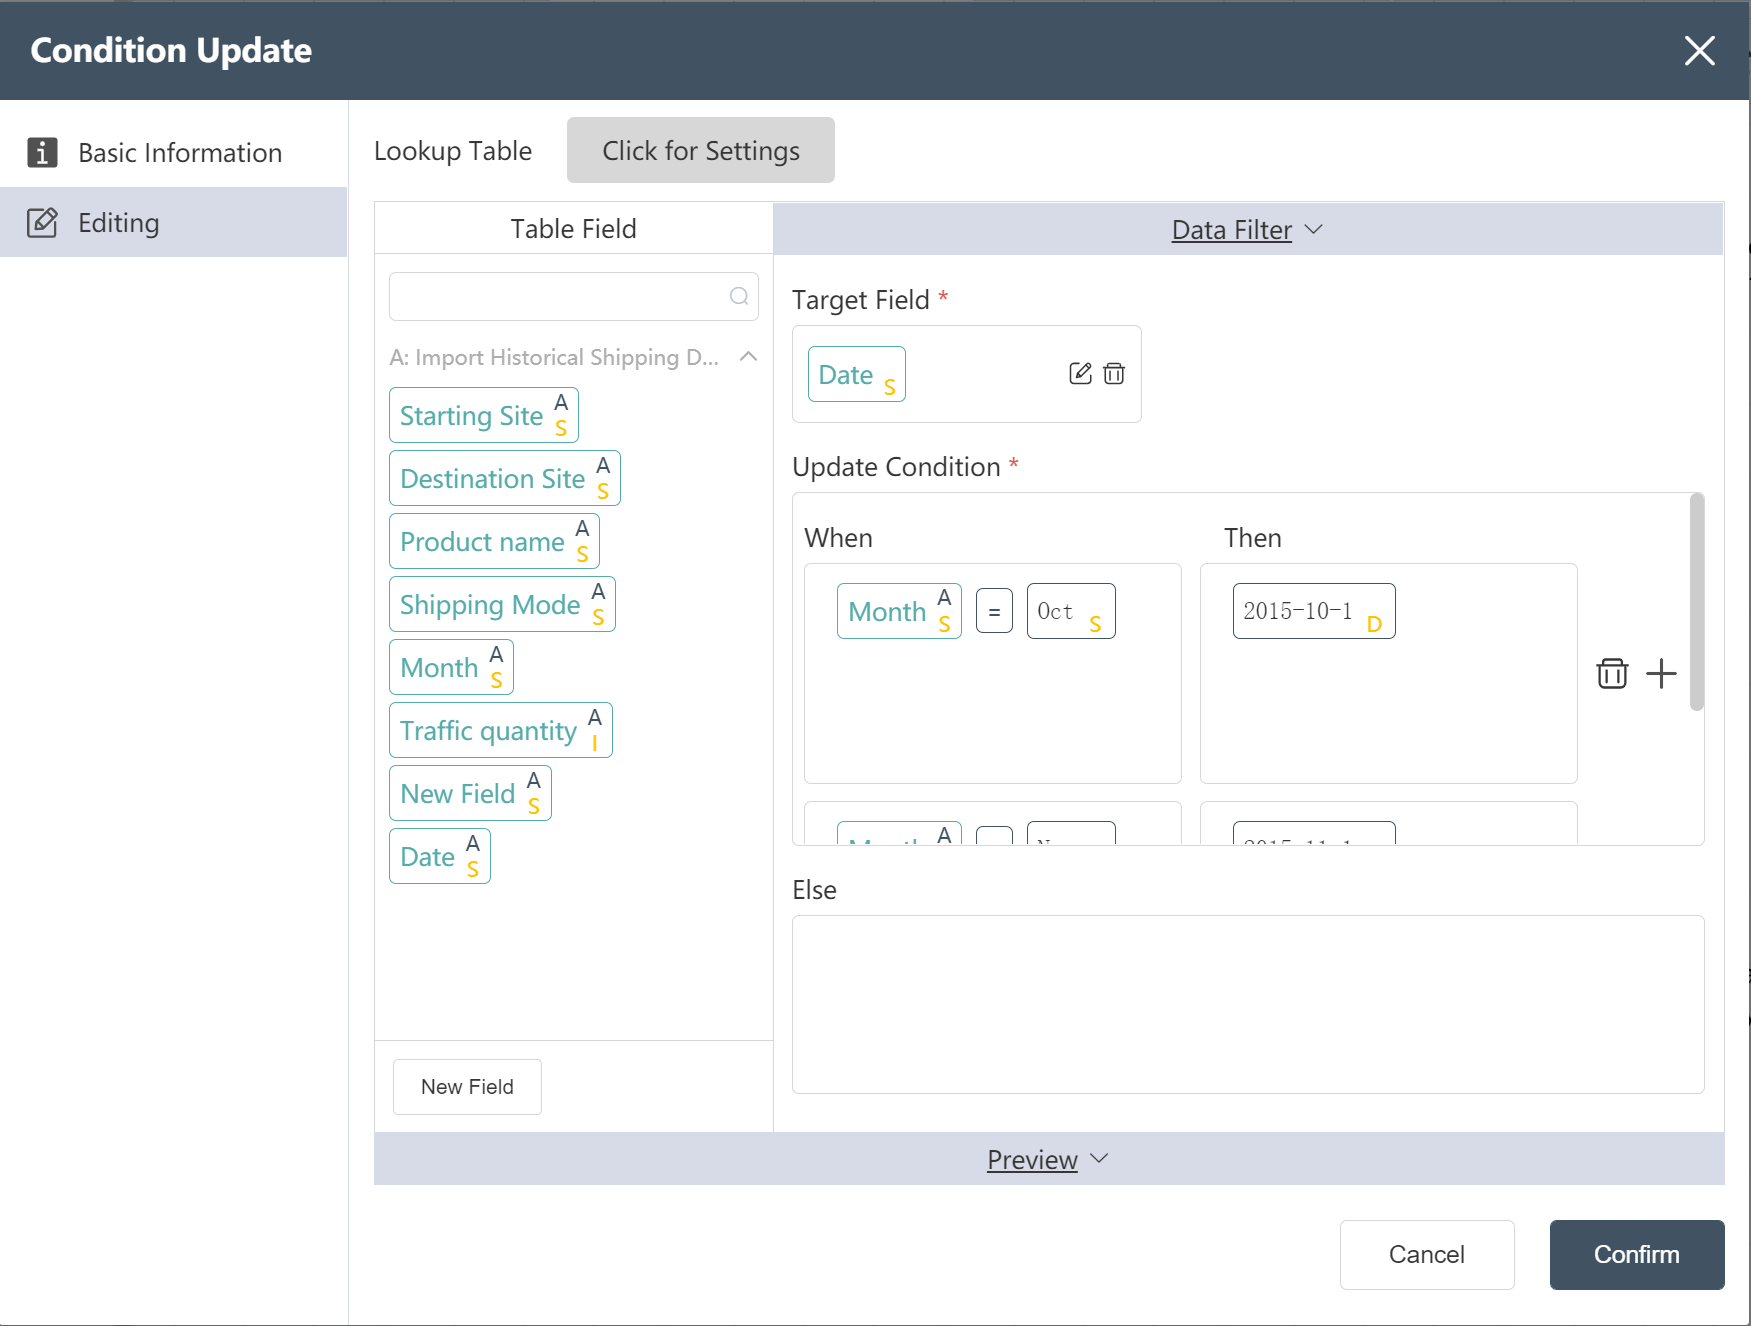
- Double click/drag condition update node to edit area
- custom node name
- Select target data
- In the data edit menu, drag the new field into the target field
- Set update conditions (IF, THEN, ELSE)
- Fill in "Data Edit" (see below)
- Click the edit icon to filter the corresponding output fields
- Click to confirm
After the operation is completed, you can click Preview to view the result, and the date is set to the first day of the corresponding month.
# New Node: Adding PeriodName and ConstraintType to historical shipping
- Refer to New Node: New Site Type for Facility Table
- Set the restriction type to "Fixed"
- Set the cycle name to "HORIZON"
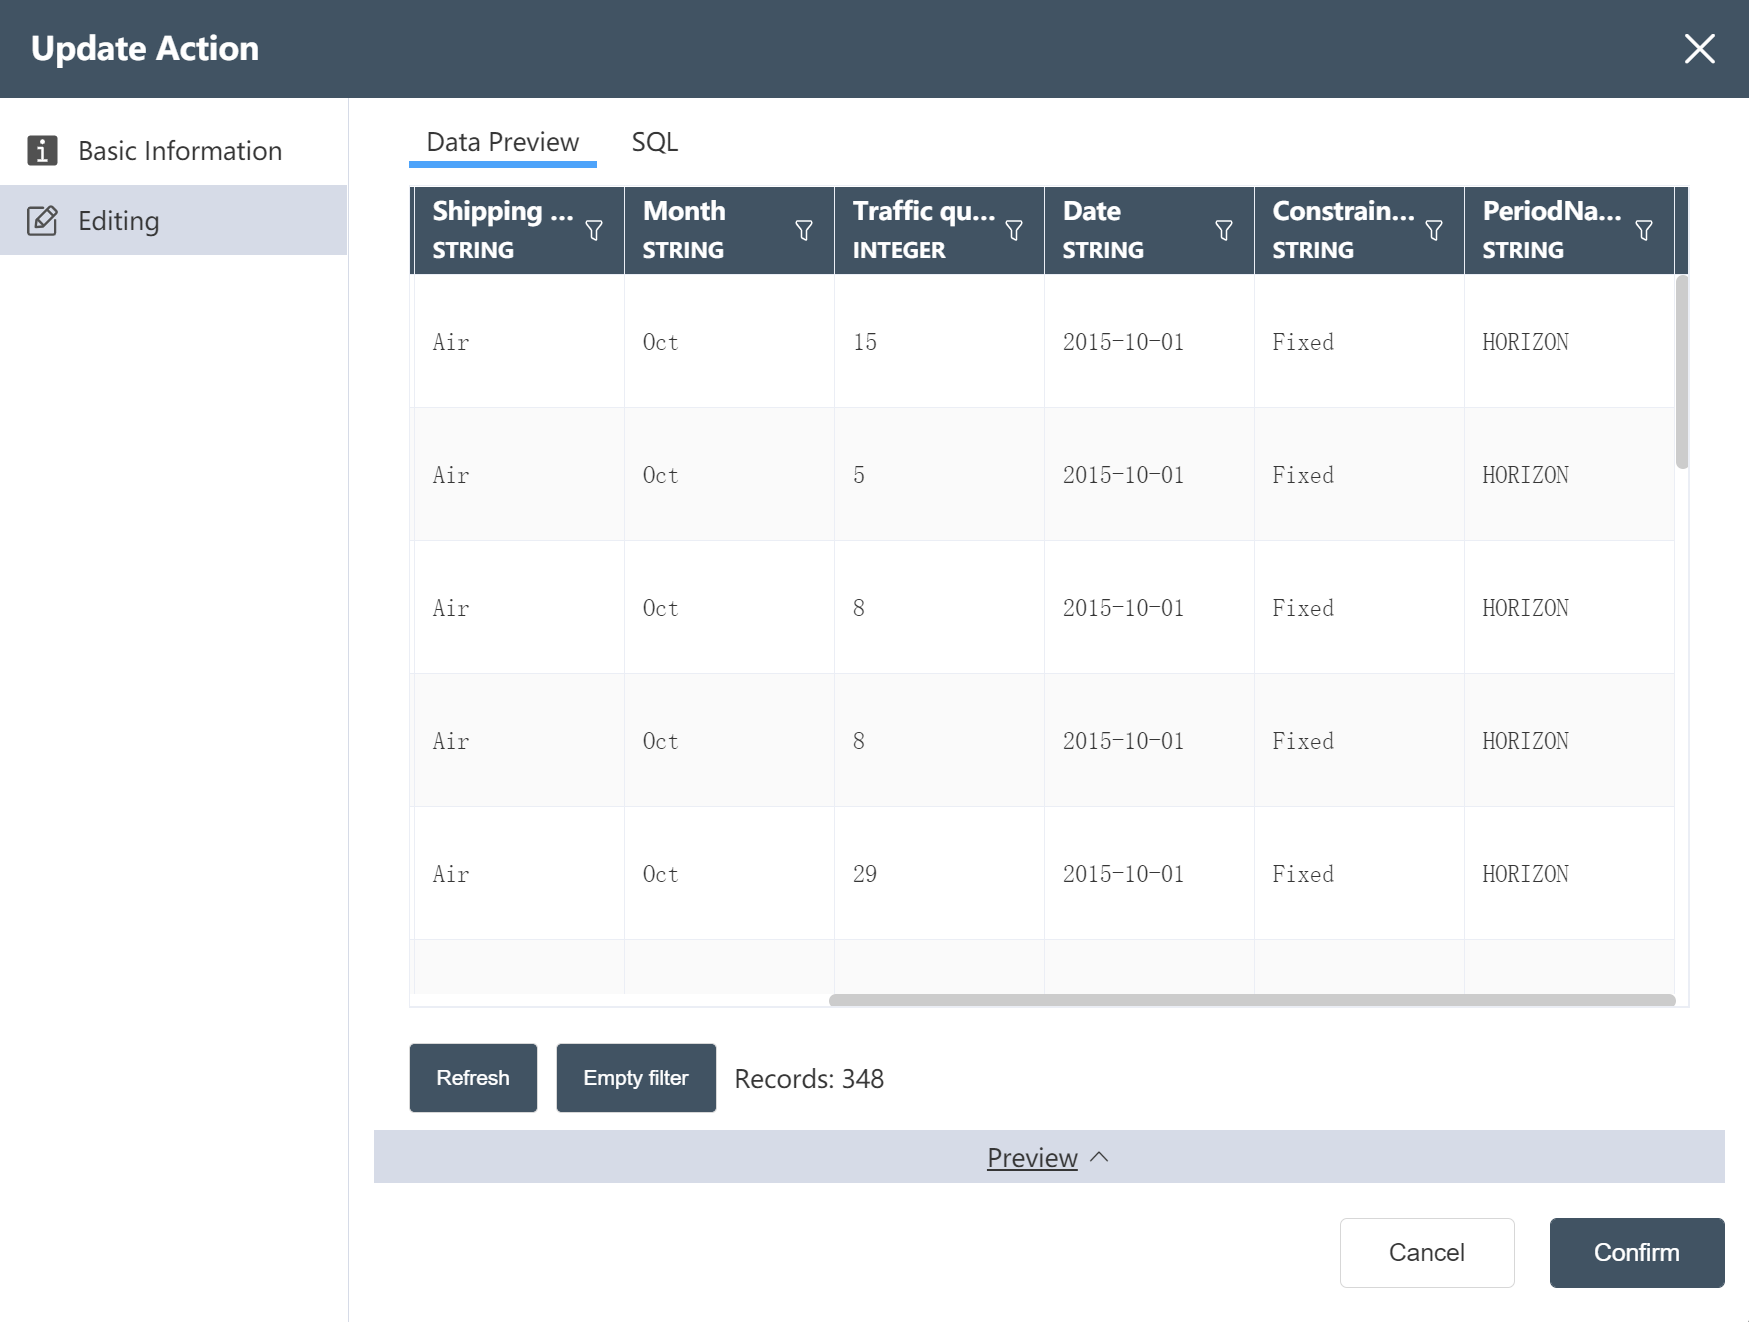
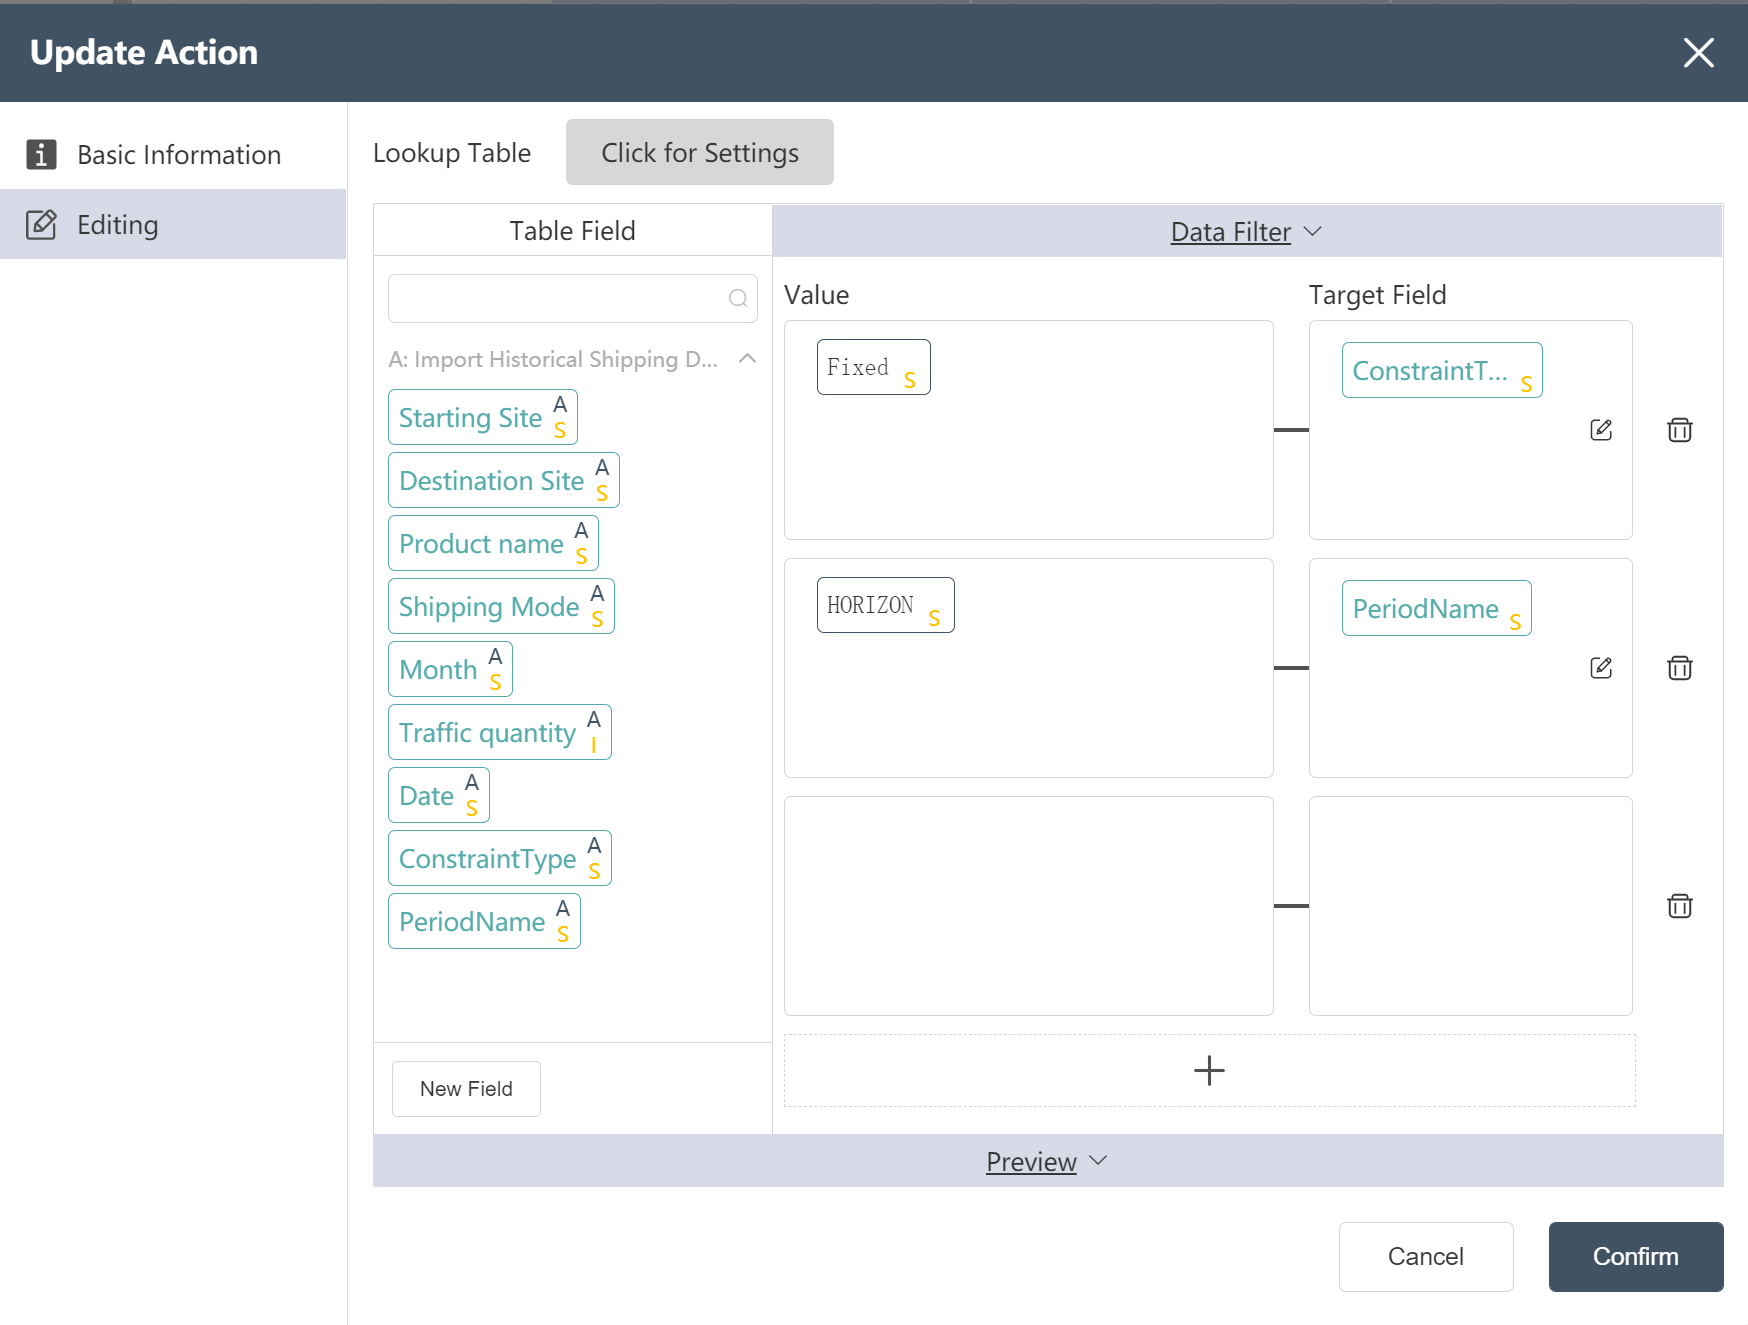 After the operation is completed, you can click Preview to check whether it is consistent with the image below.
# New Node: Cleaned Historical Shipping Data
- For operation steps, refer to New Node: Cleaned Facility Location Data
The operation is complete, and the processed historical traffic is written to the new table.
# Run Node Group: Transport Quote Data Import Preprocessing
- Connect according to the steps shown in the figure
- Click the Execute button in the upper right corner of the canvas
- Check the results of the run: - Transport quotation data import preprocessing
After the operation is completed, 3 output tables are obtained: the international section transportation quotation has been cleaned, the local section transportation quotation has been cleaned, and the historical transportation volume has been processed.
# Node Group 3: Demand Data Preprocessing
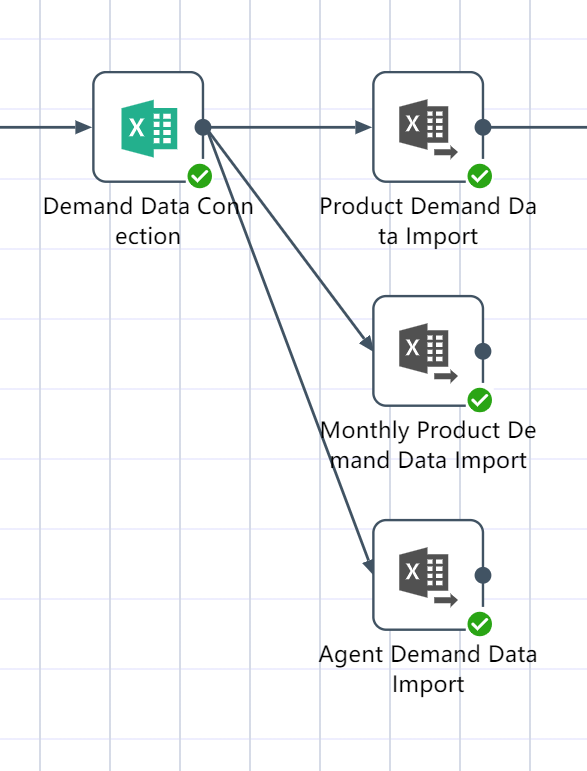
# New node: Demand forecast data connection, demand data import
- Refer to the Excel connection tutorial to create a new node: Demand forecast data connection
- Refer to the Excel single sheet import tutorial to create a new node: product demand data import
- Refer to the Excel single sheet import tutorial to create a new node: monthly demand data import
- Refer to the Excel single sheet import tutorial to create a new node: importing agency demand data
# Product demand data processing node construction:
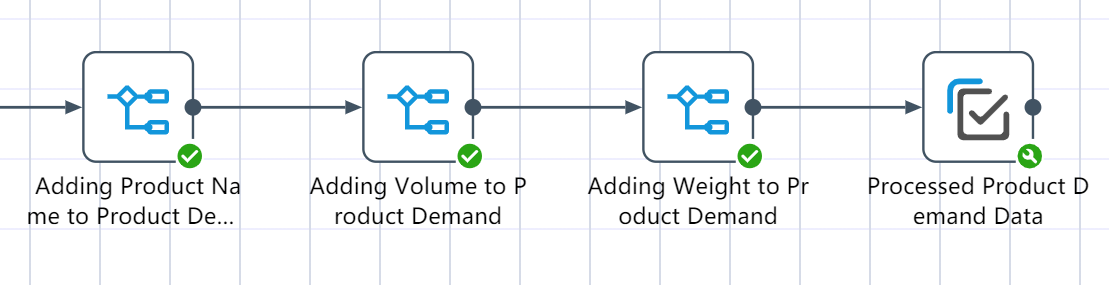
- Add a new field ProductName and assign it to country_product
The value is updated to country||_||product (|| means concatenating two strings before and after)
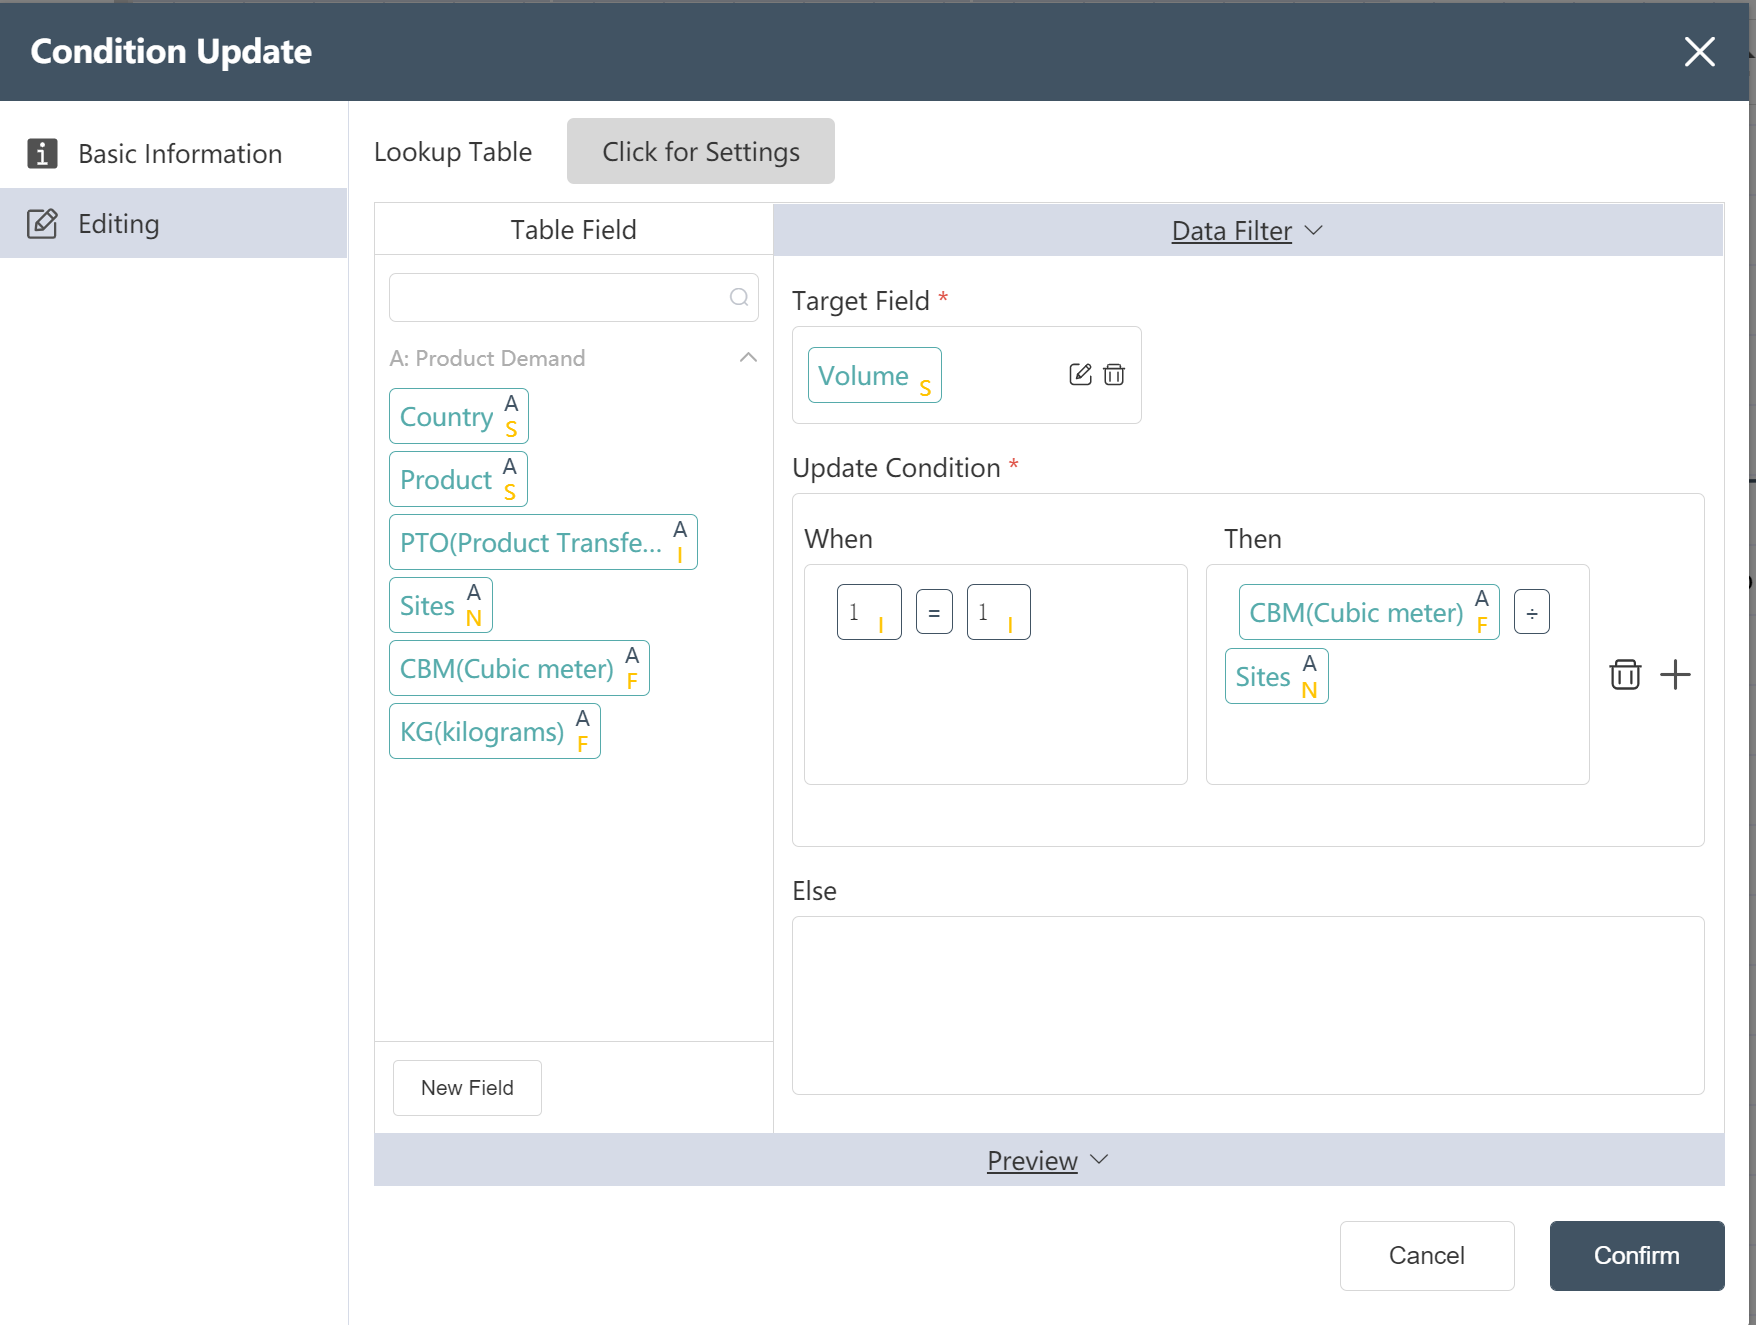
- The unit volume of the newly added product is assigned as volume CBM/site number sites
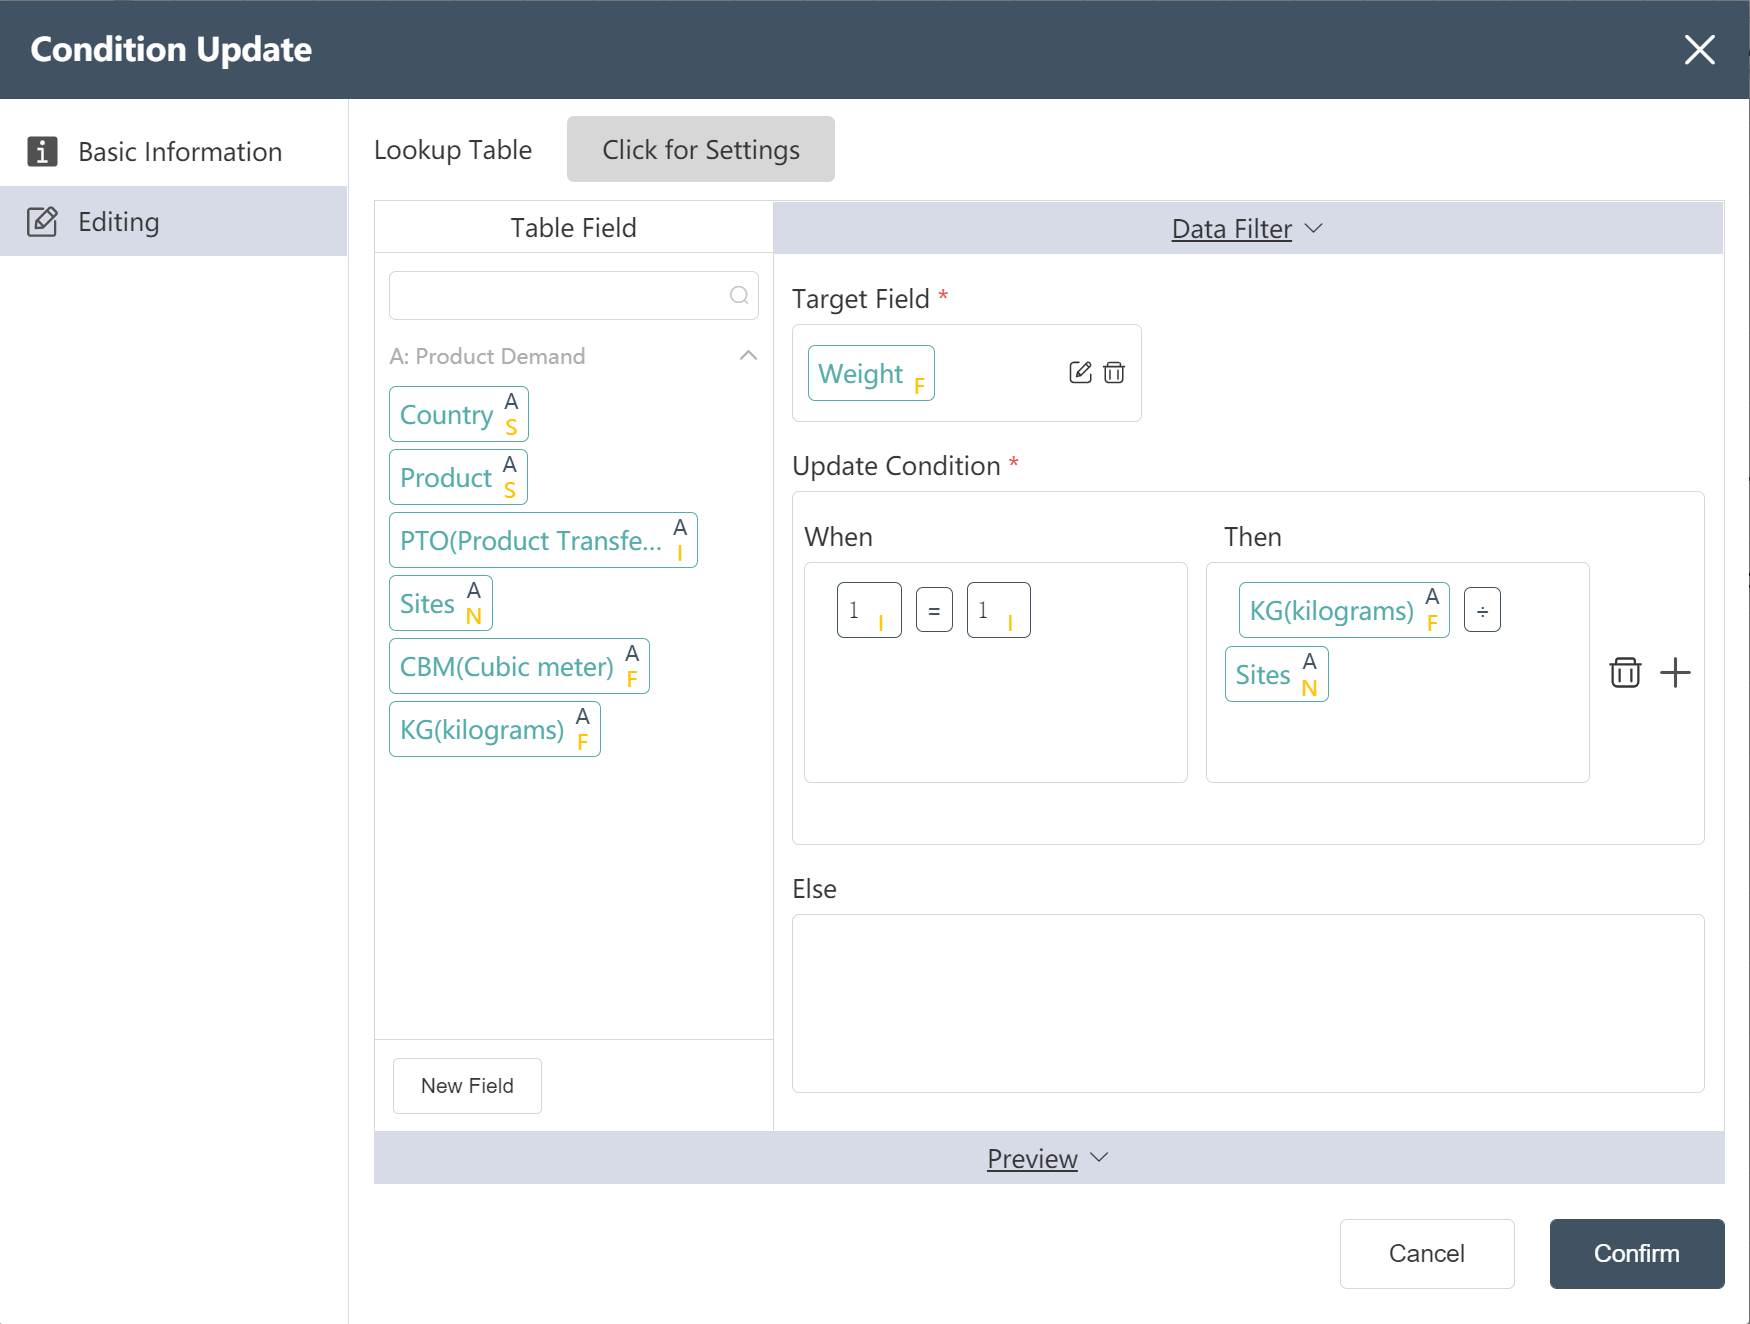
- The unit weight of the new product is assigned as weight KG/site number sites
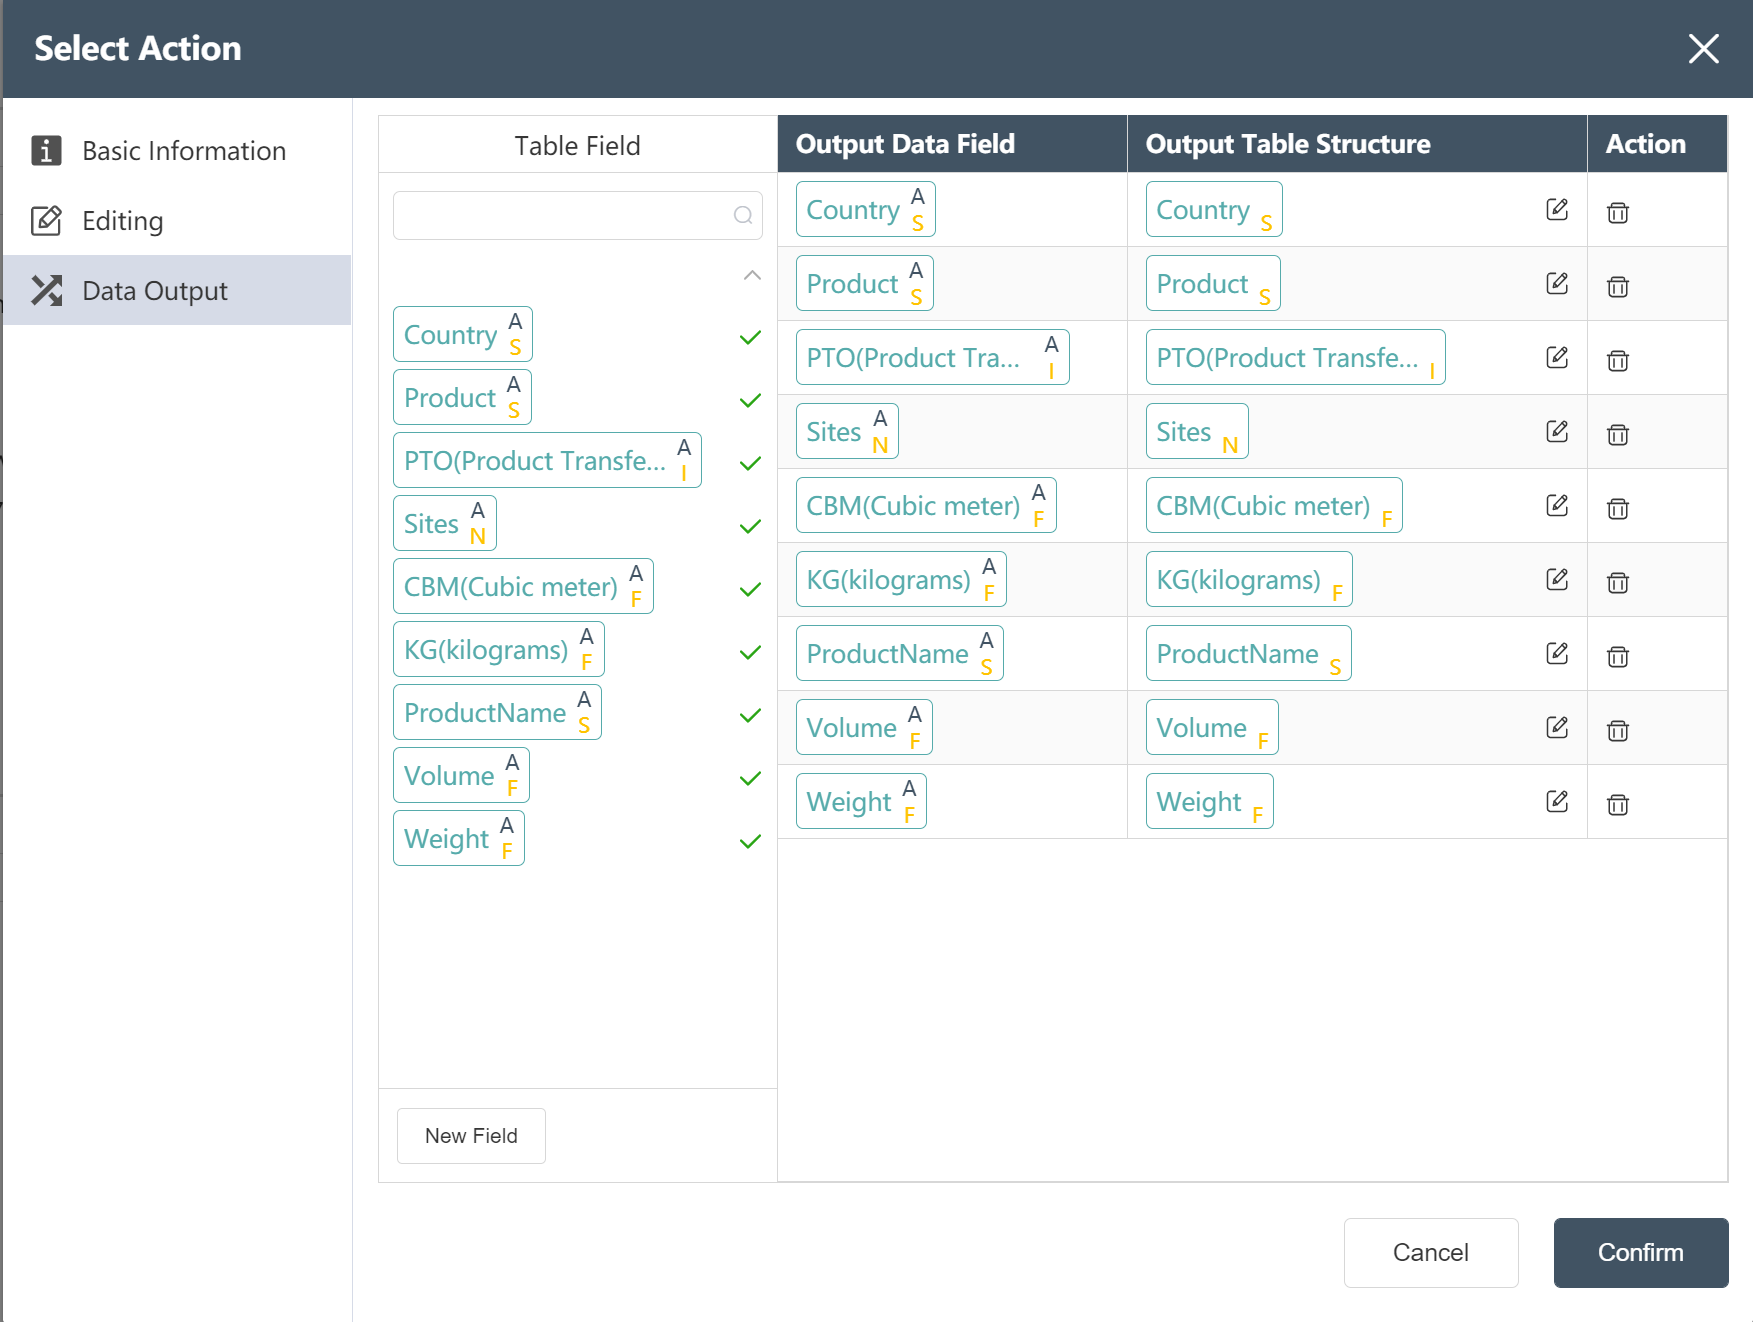
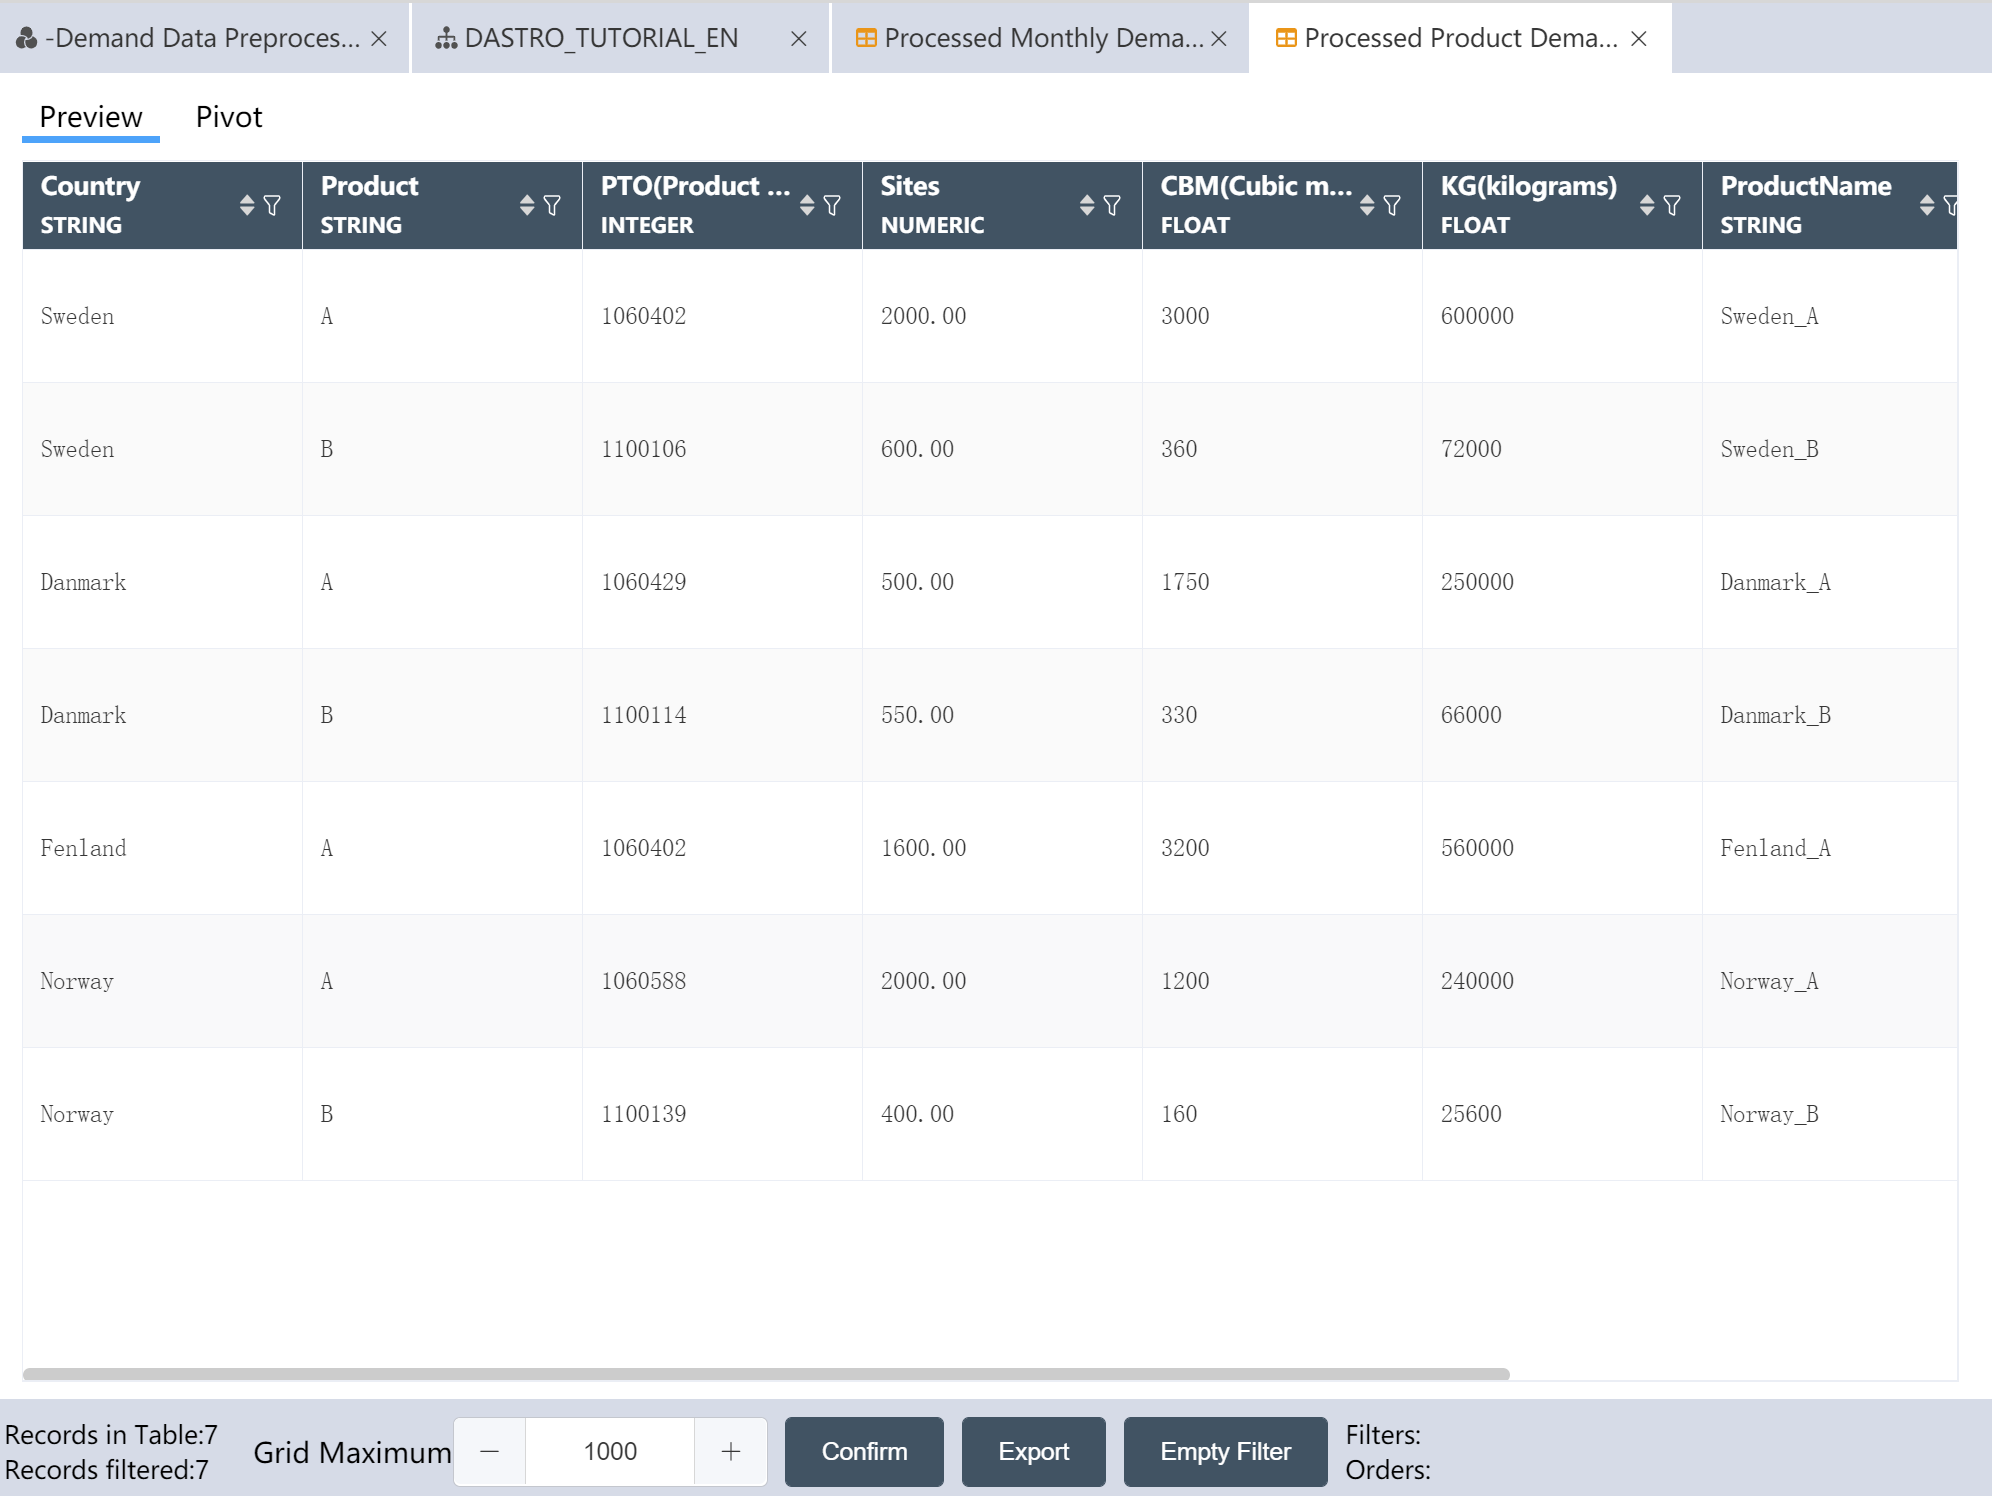
- Write Processed Product Demand Data to a New Table: Processed Product Demand Data
- In the data selection node, the following figure prompts you to modify the data output menu
# Monthly demand data processing node construction:
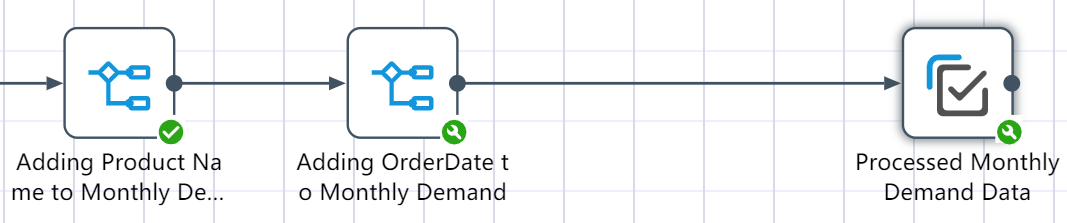
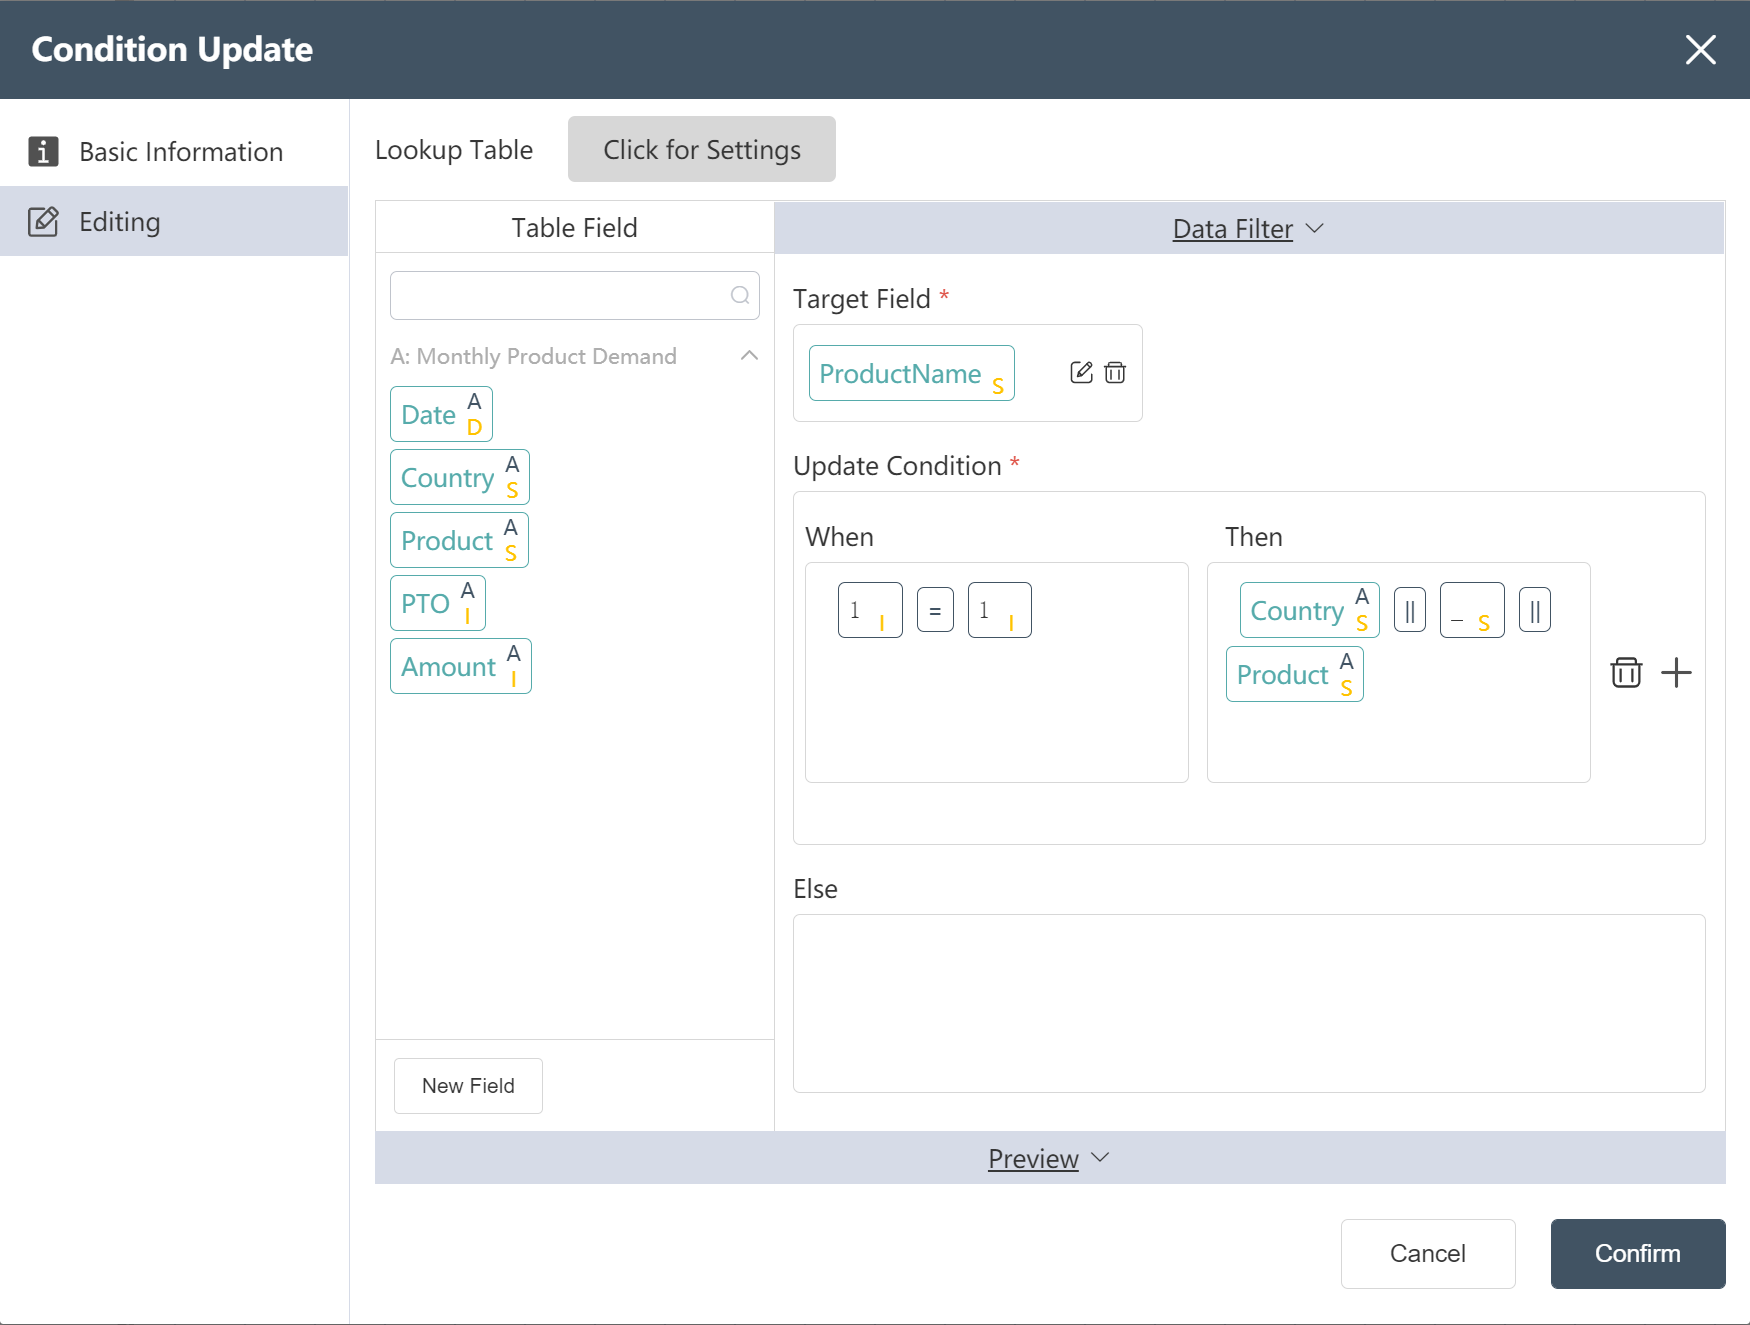
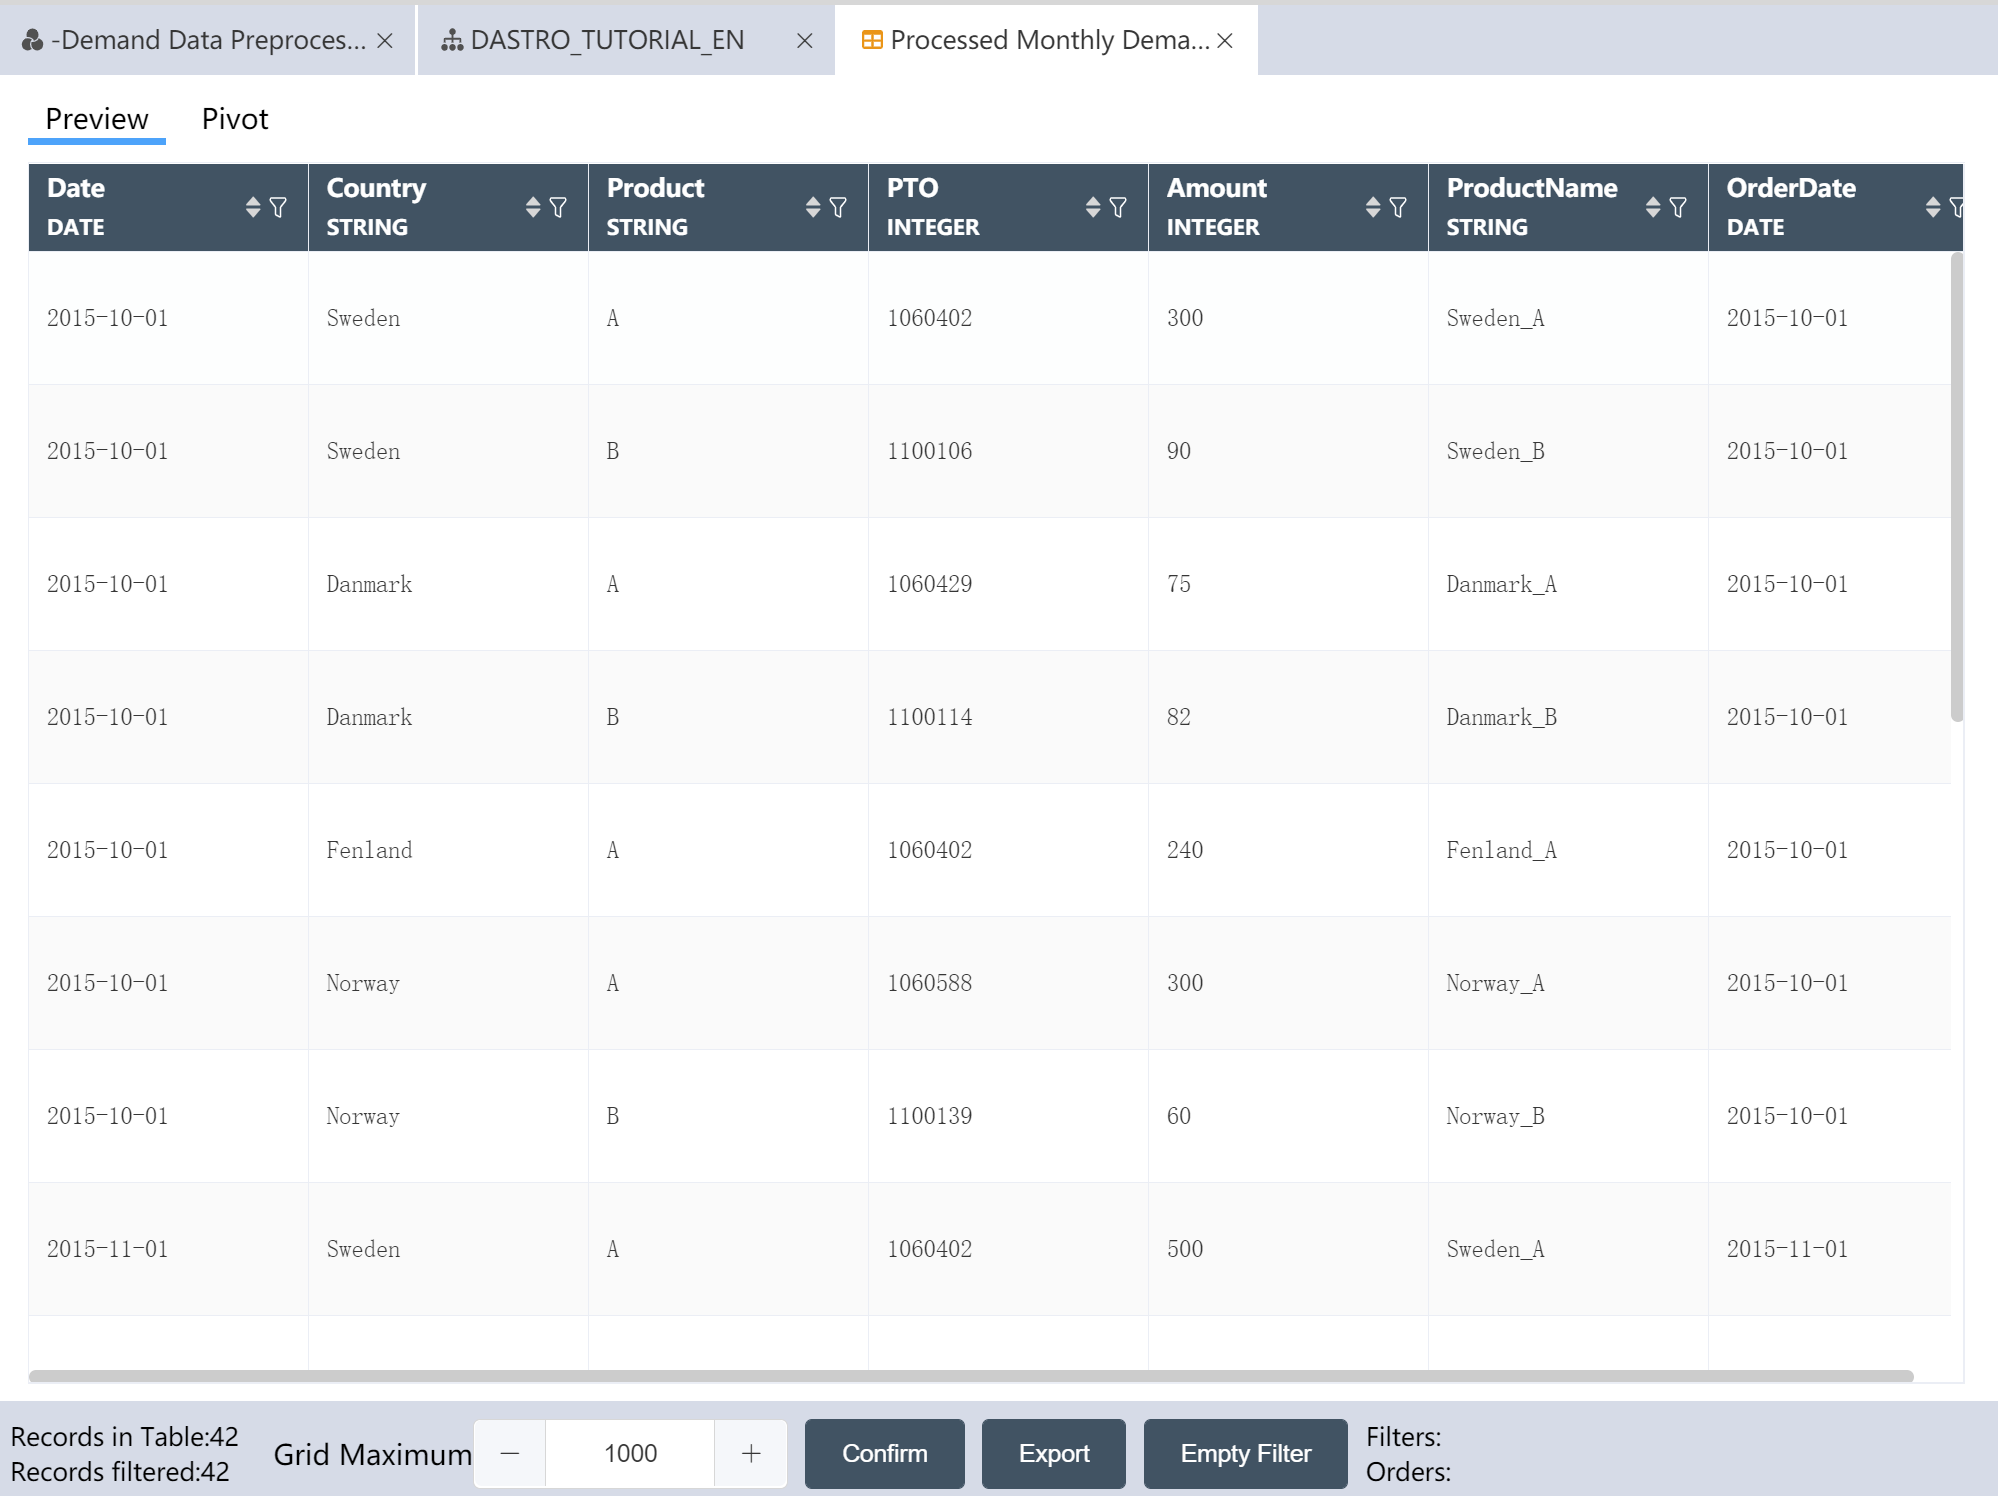
- Add a new field ProductName and assign it to country_product
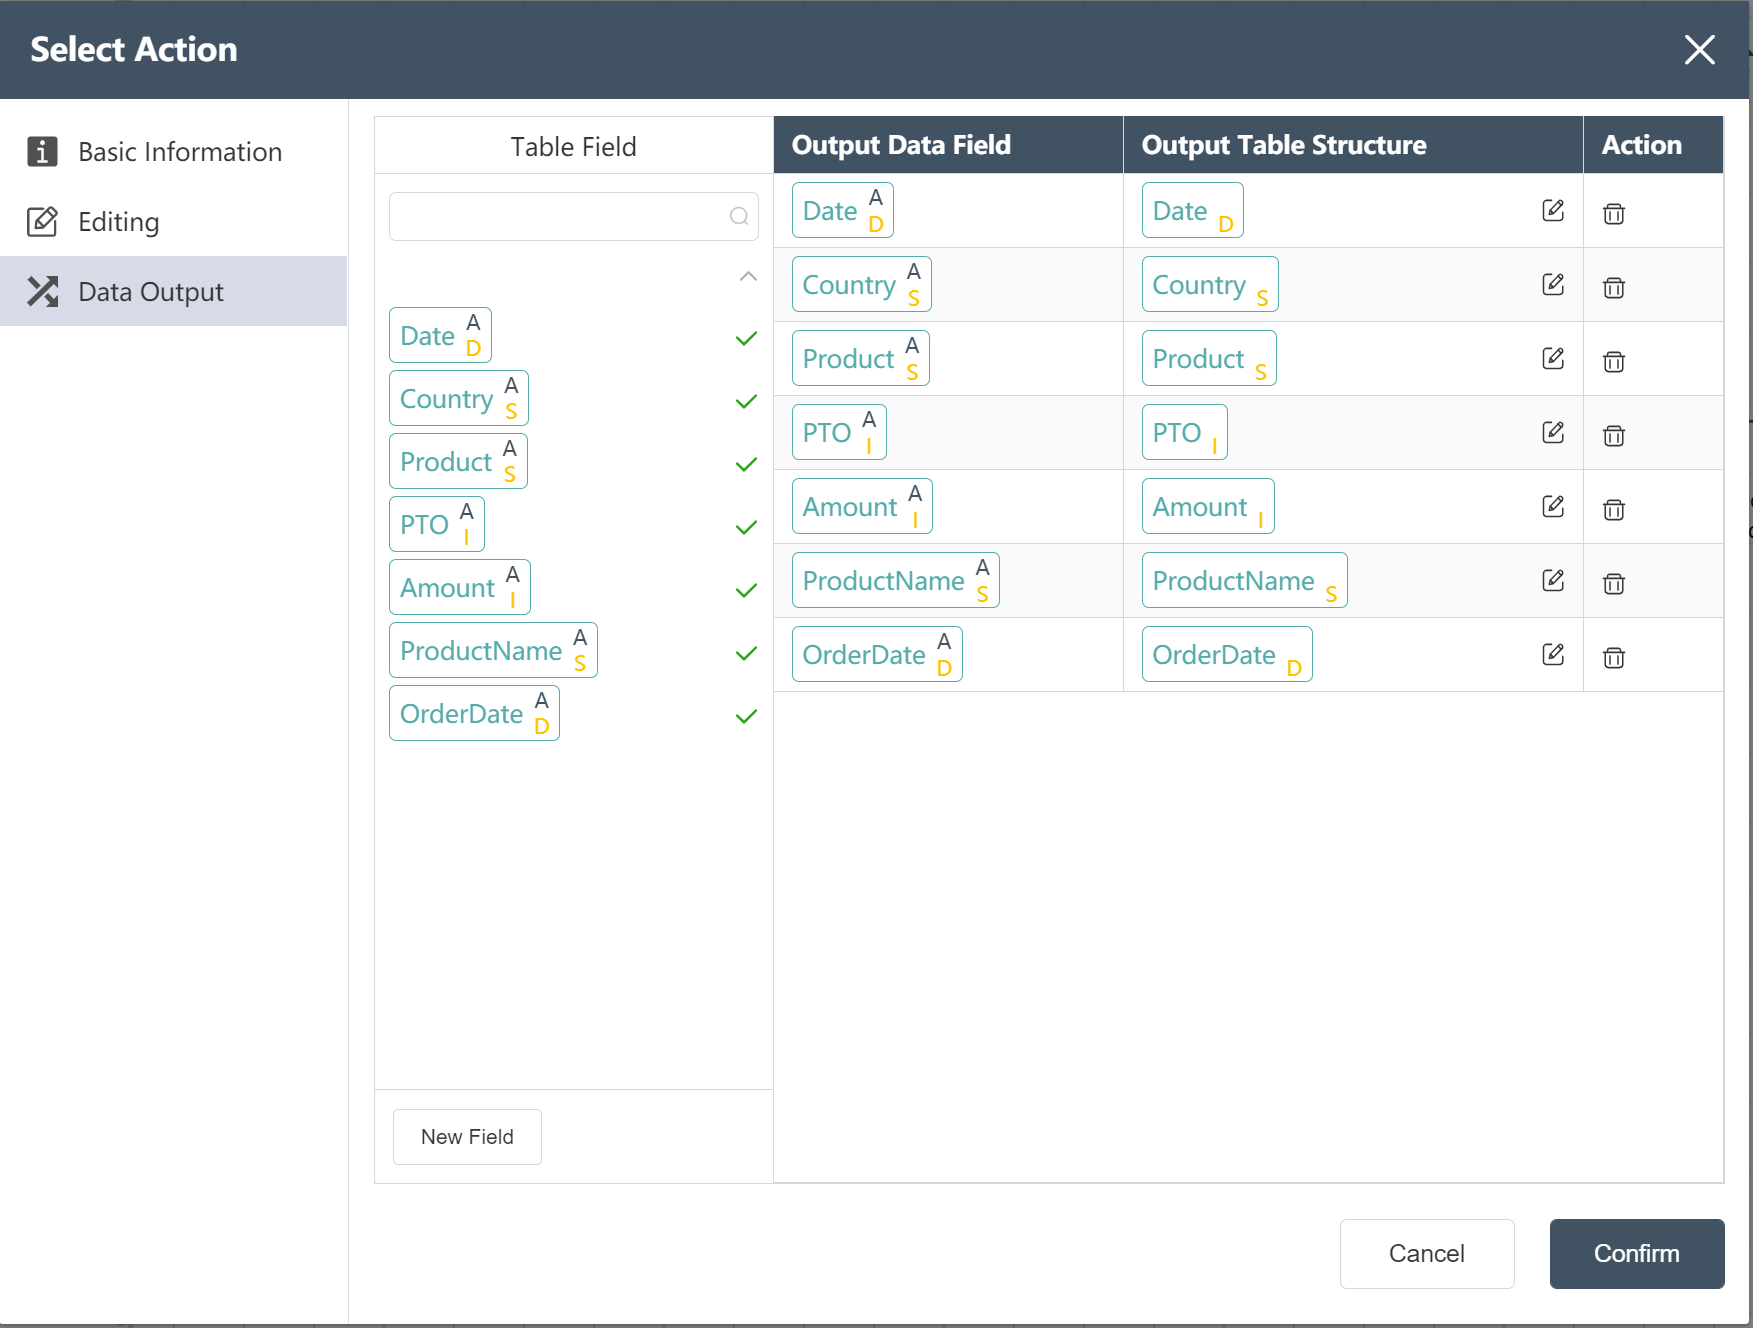
- Add a new field order date, assign the value to month, and set the data type to Date

- Write Processed Monthly Demand Data to a New Table: Processed Monthly Demand Data
# The construction of the Agency demand data processing node:
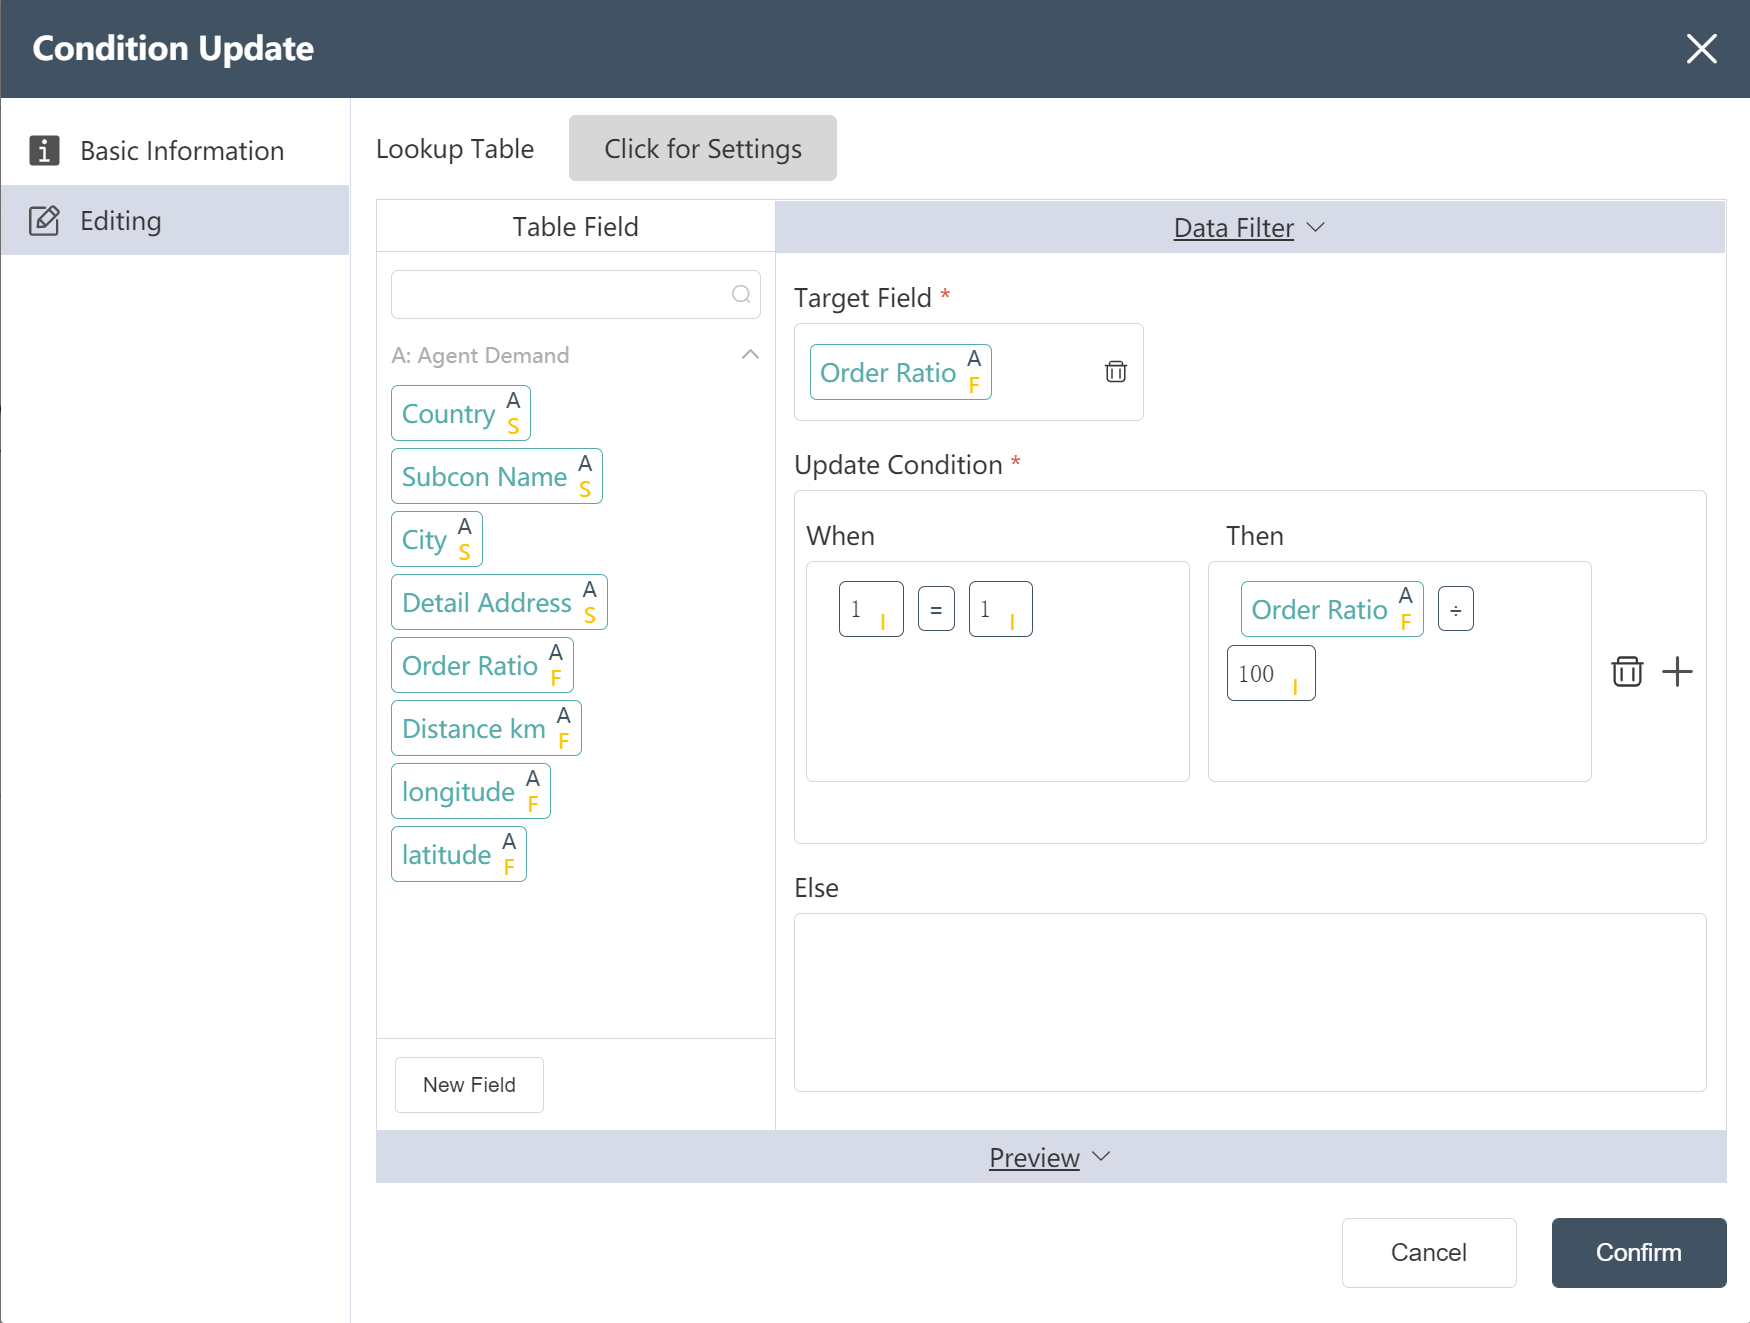
Goal: Change the proportion of the quantity in the form of a percentage to a decimal form, for example, 20% becomes 0.2
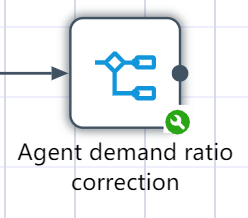
- New node: Agency demand ratio correction
Goal: Turn 20 into 0.2
# The construction of the agency demand volume data processing node:
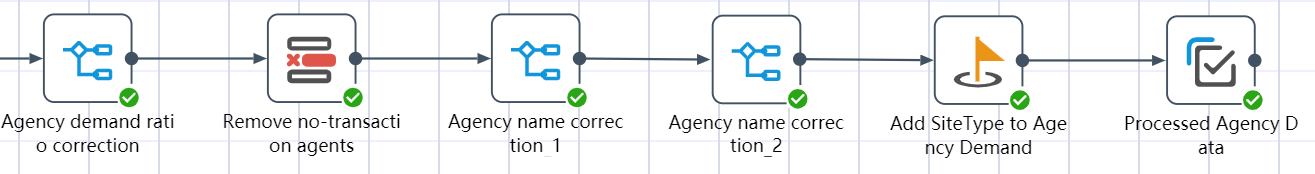
①New node: remove no-transaction agencies, remove agency data with a volume ratio of 0 or missing countries
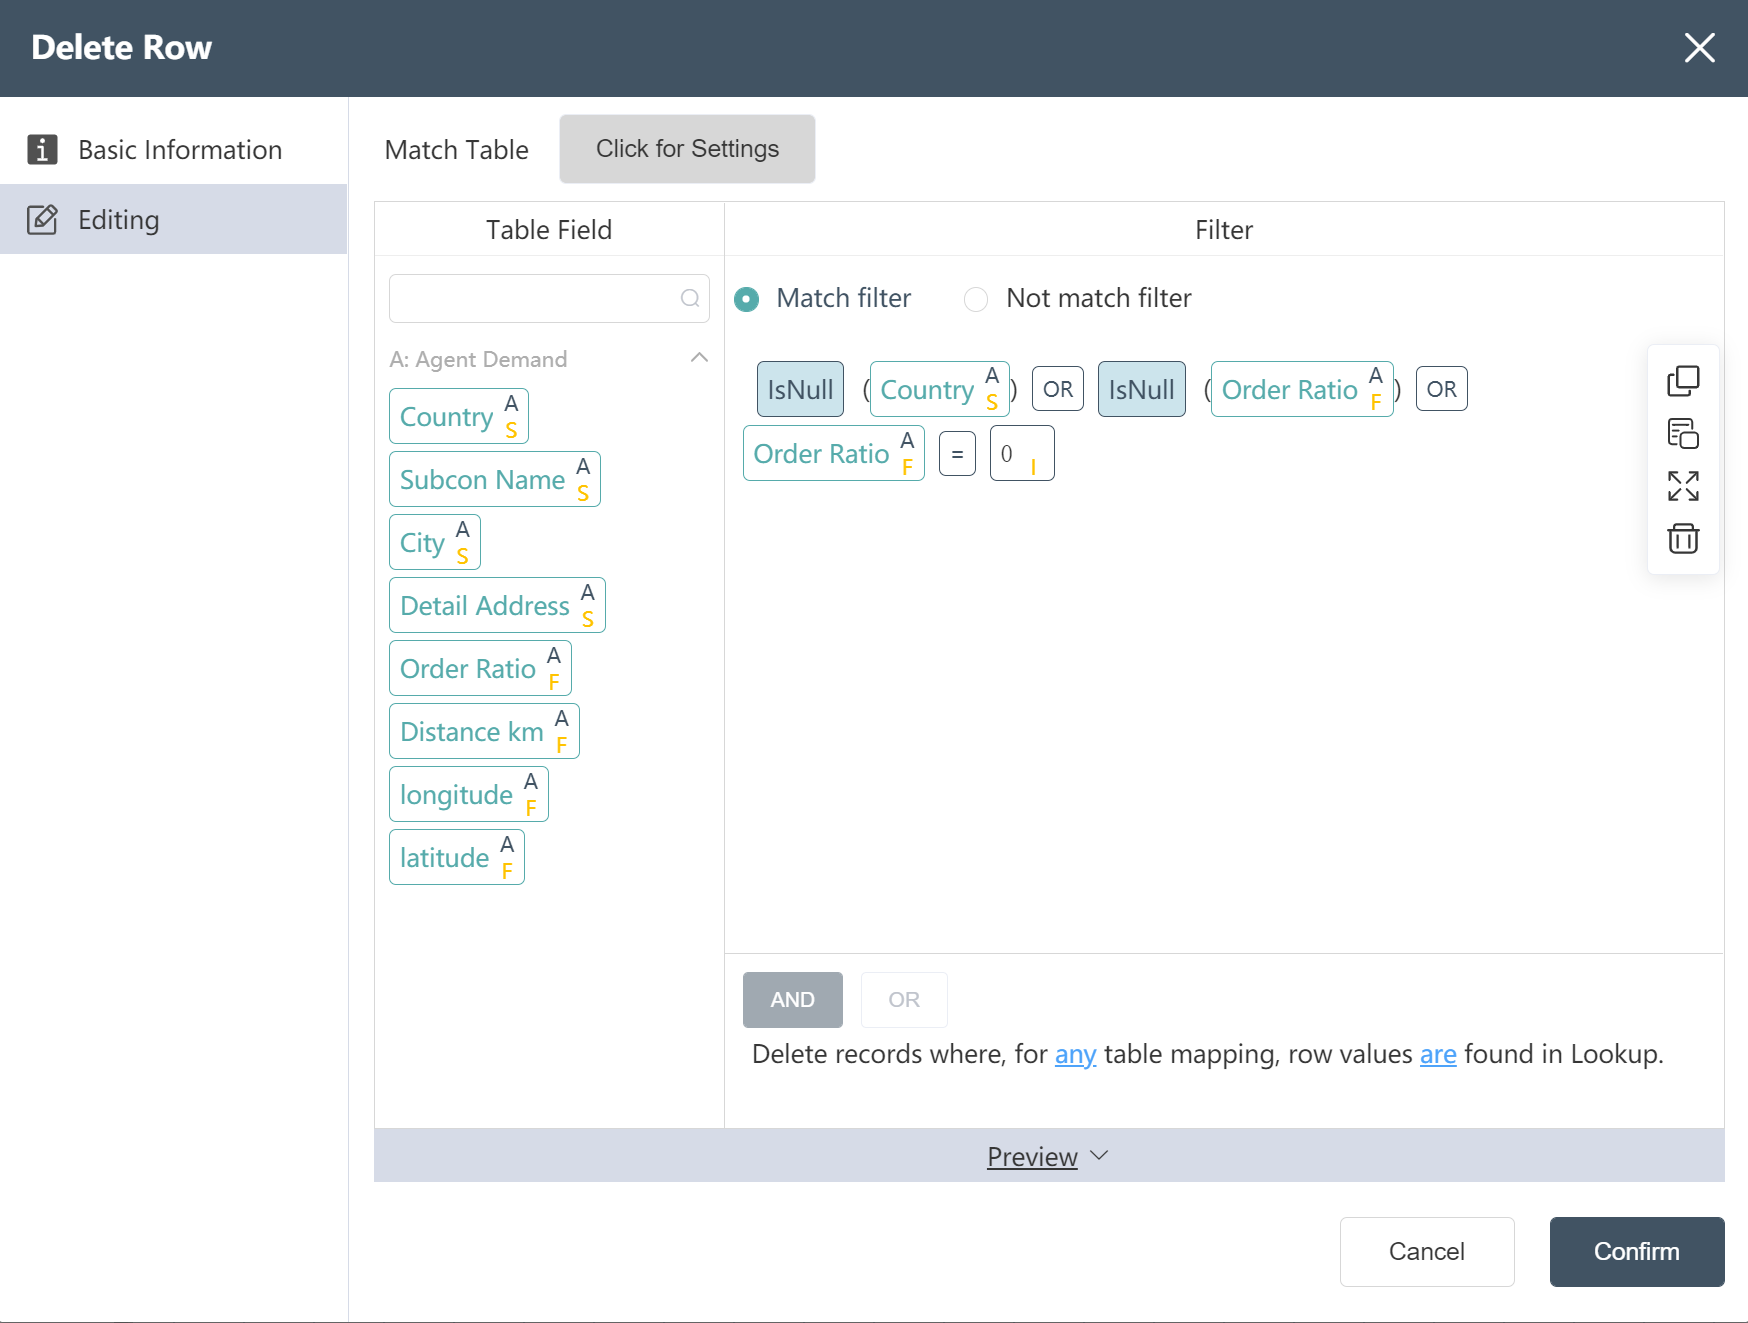
②New node: agency name correction 1
Change the agency name to "CZ_" + city
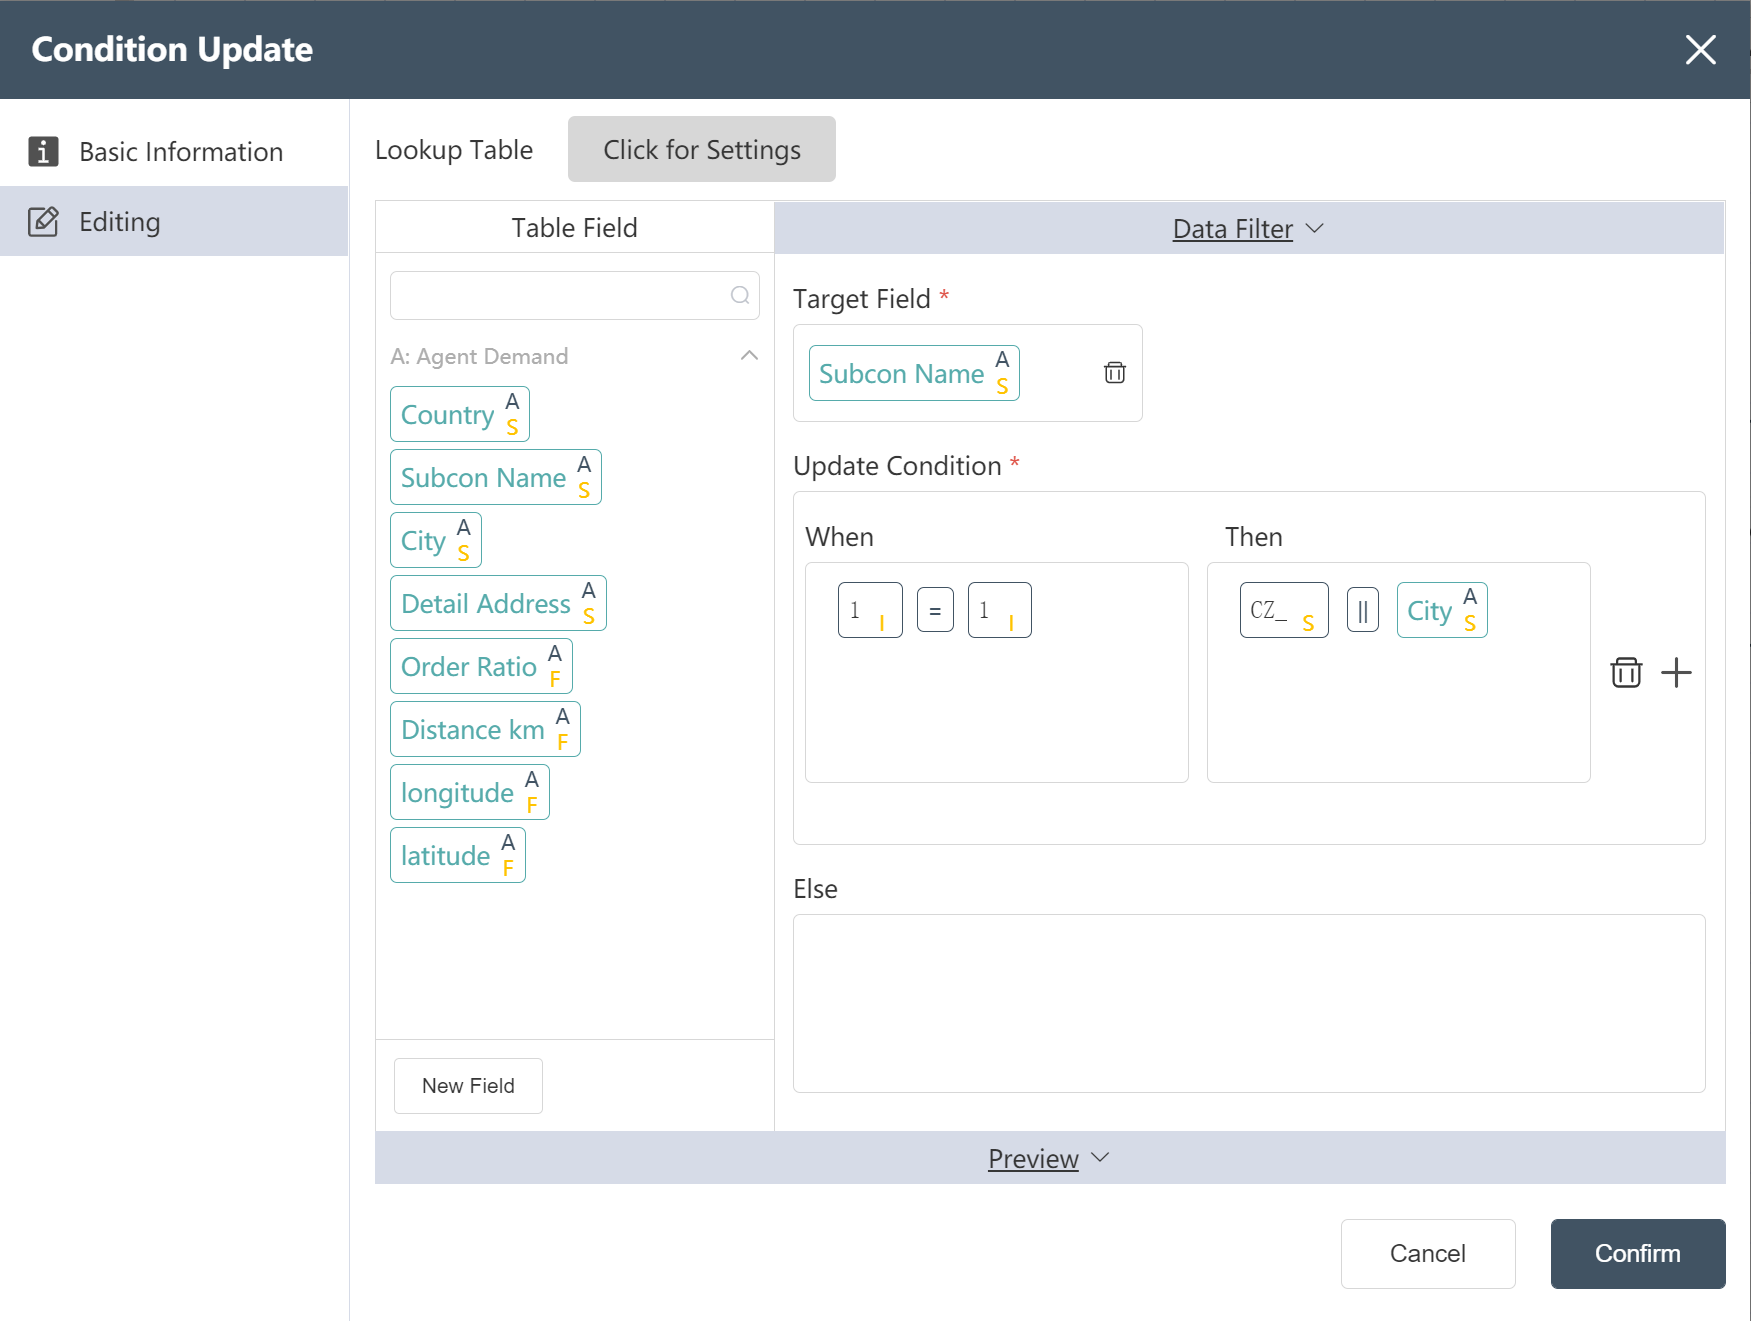
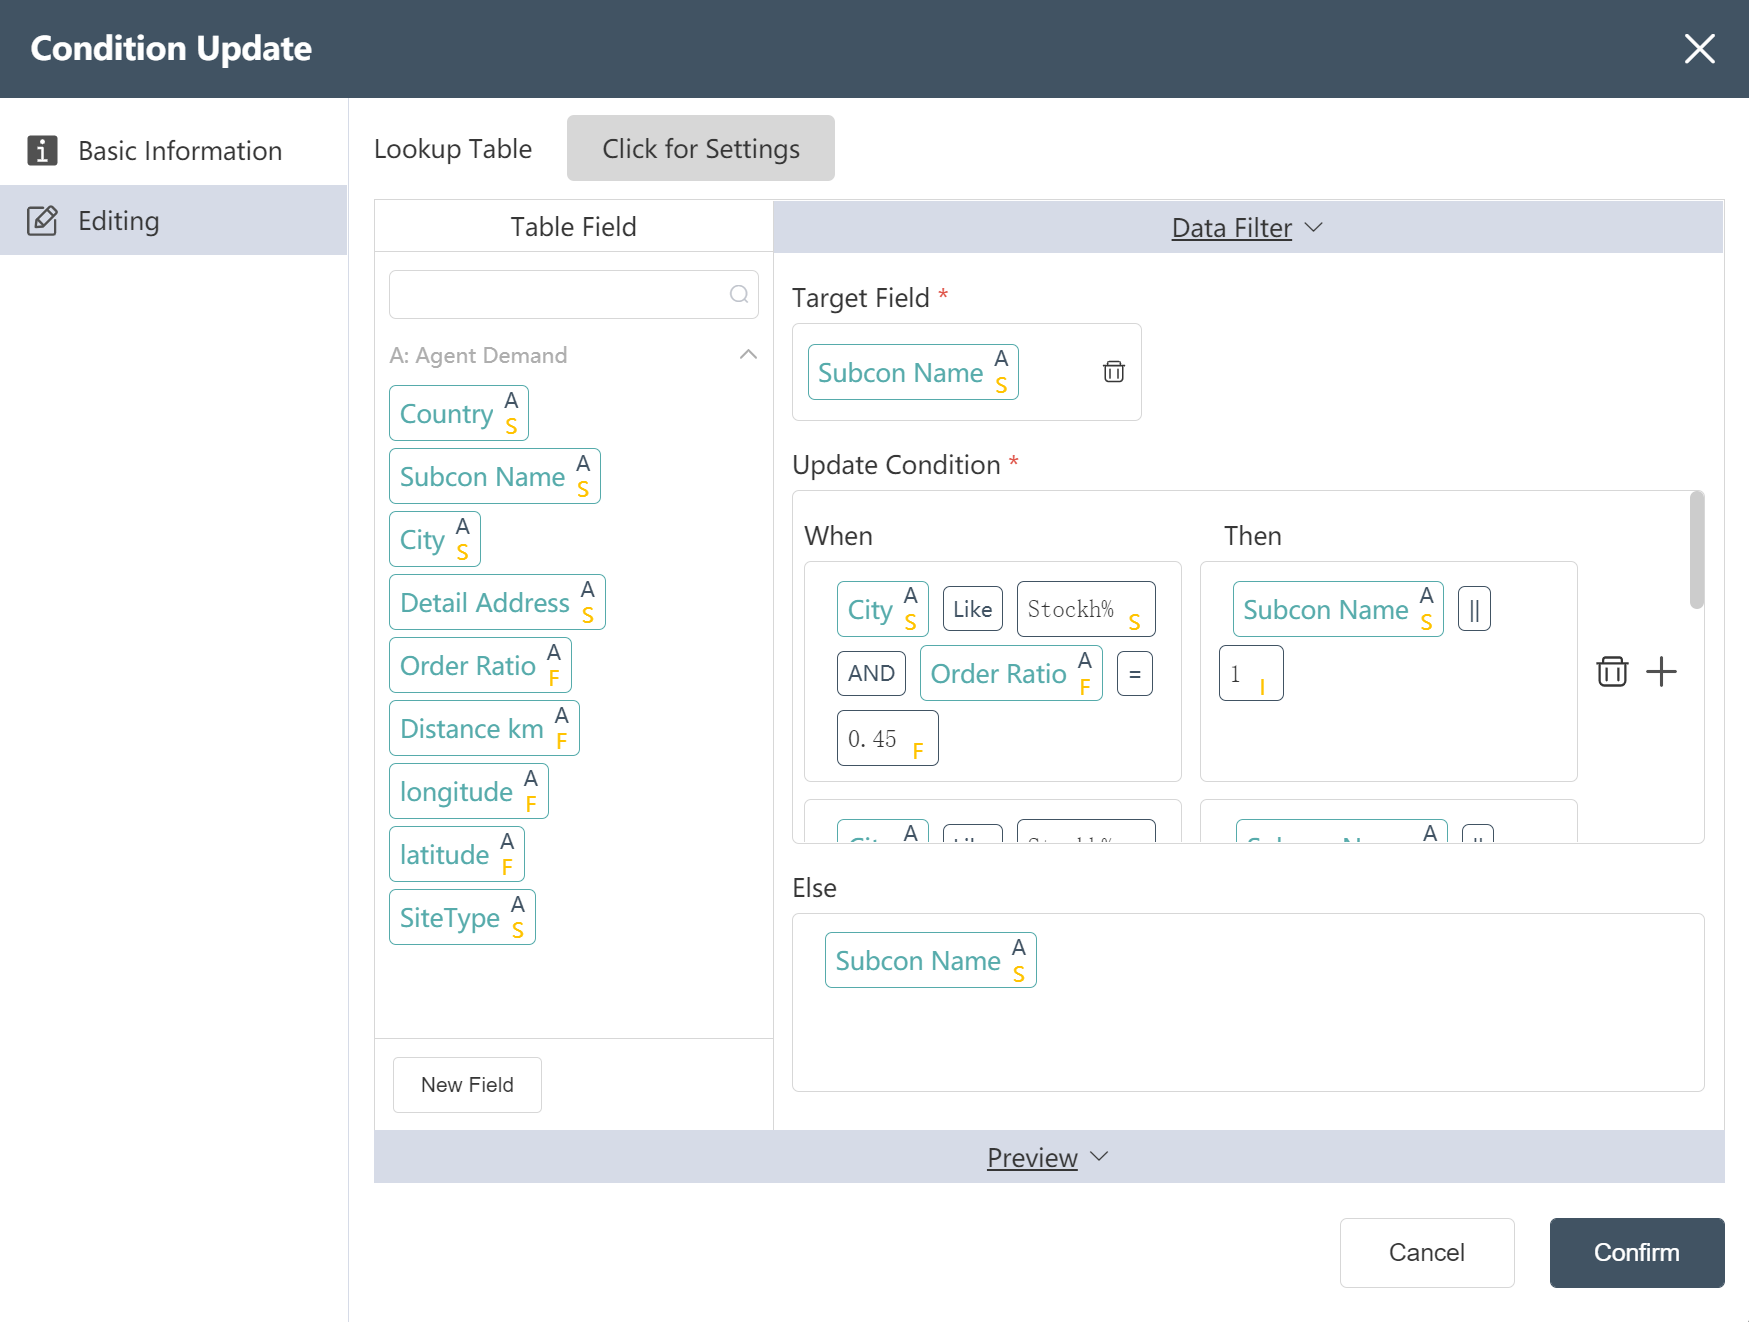
③New node: agency name correction 2
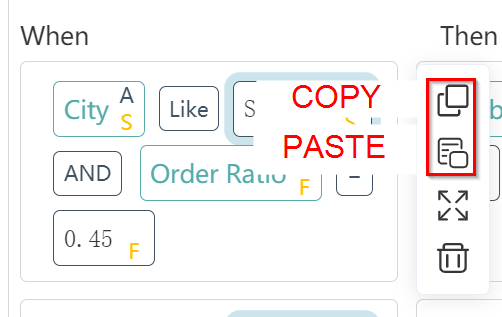
If there are multiple agencies in a city, in order to avoid repeated agency names, add numbers after these agency names. Cities to be dealt with include Stockholm, Rovaniemi.
Update conditions (as shown in the figure):
Satisfy City like Stockh% and order ratio = 0.45 Update the value to Subcon Name || 1
Satisfy City like Stockh% and order ratio = 0.30 The value is updated to Subcon Name || 2
Satisfy City like Rovan% and order ratio = 0.30 Value updated to Subcon Name || 1
Satisfy City like Rovan% and order ratio = 0.20 Value updated to Subcon Name || 2
Hover the mouse over the input box, a toolbar will appear on the right, and you can copy and paste the content of the input box.
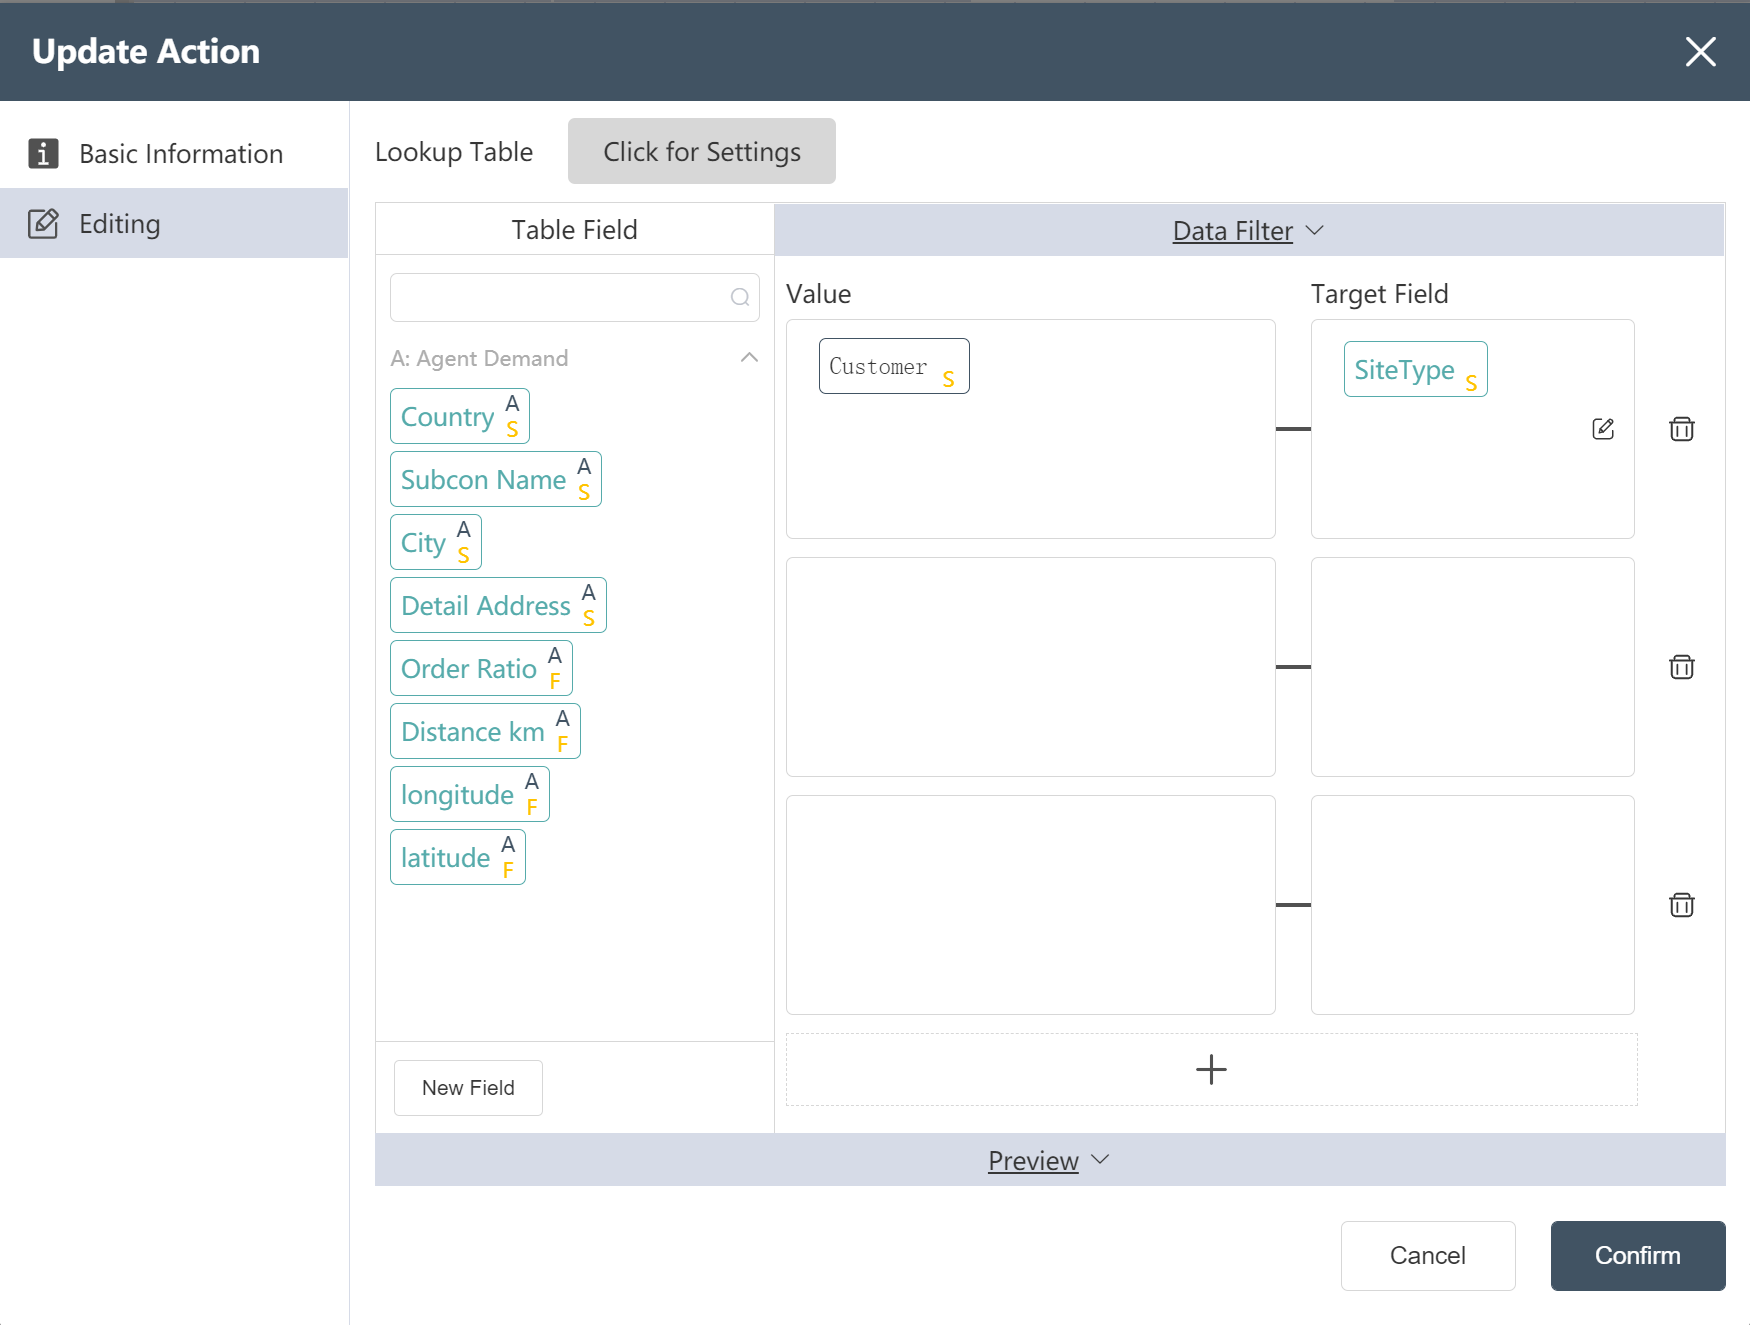
- New Node: Add SiteType to Agency Demand table
Goal: Prepare for site master table creation
Select Subcon for the target data.
In the data editing menu, click on the new field, name it "Site Type", and assign the value to Customer (as shown in the figure).
- New Node: Processed Agency Data
Write Processed Agency Data to a New Table: Processed Agency Data
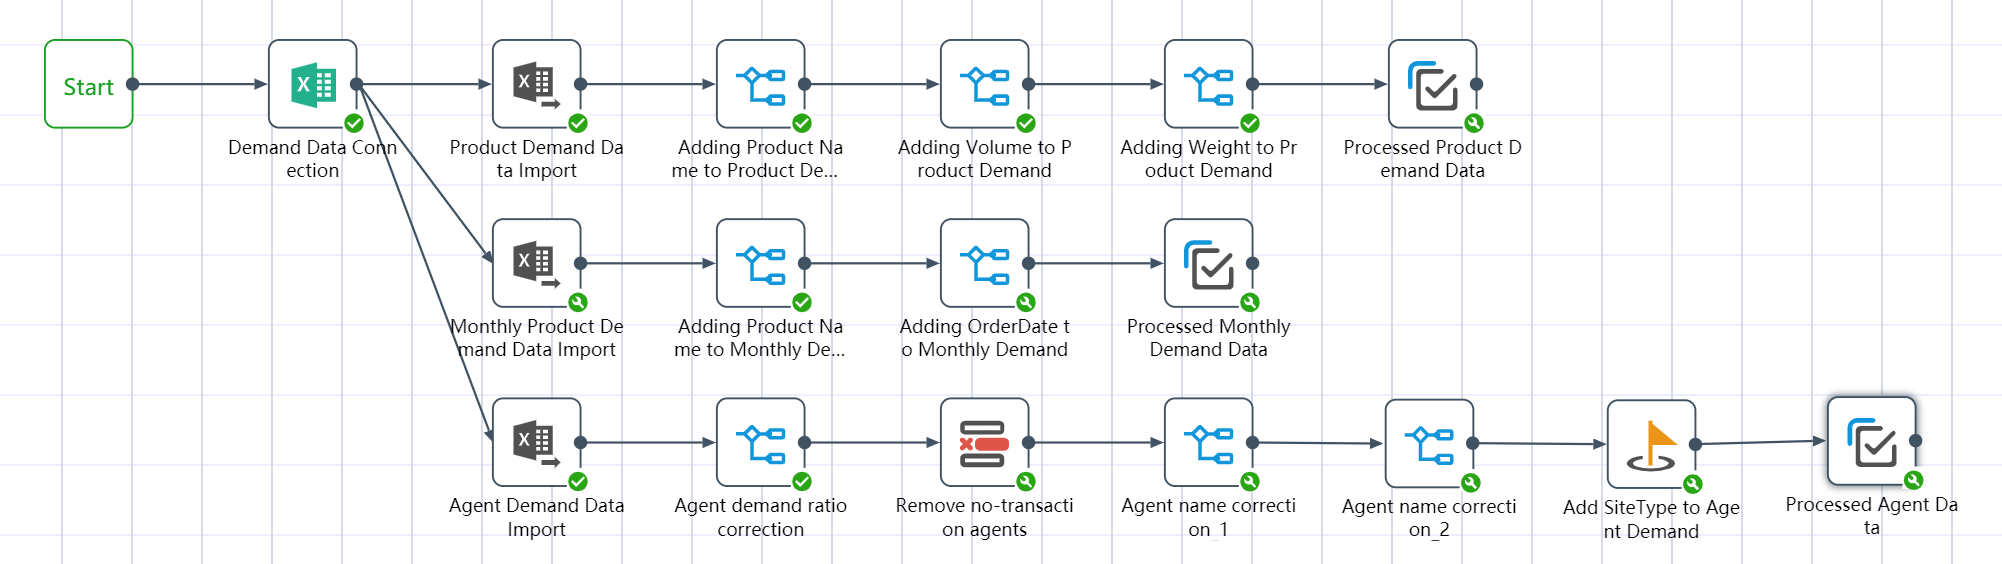
# Running Node Group: Demand Forecast Data Import Preprocessing
- Connect according to the steps shown in the figure
- Click the Execute button in the upper right corner of the canvas
- Check the running results: - Demand forecast data import preprocessing
After the operation is completed, three output tables are obtained: processed product demand data, processed monthly demand data, and processed agency data.
Processed product demand data
Processed monthly demand data
Processed Agency data

# Node Group 4: SCATLAS® Empty Table Import
 Goal: Connect to SCATLAS®, import possible input tables into the DASTRO® database, import empty tables in order to get their headers so that you can quickly match the collated data with the headers.
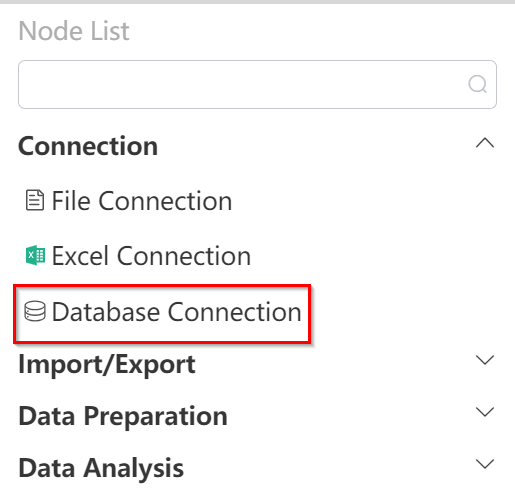
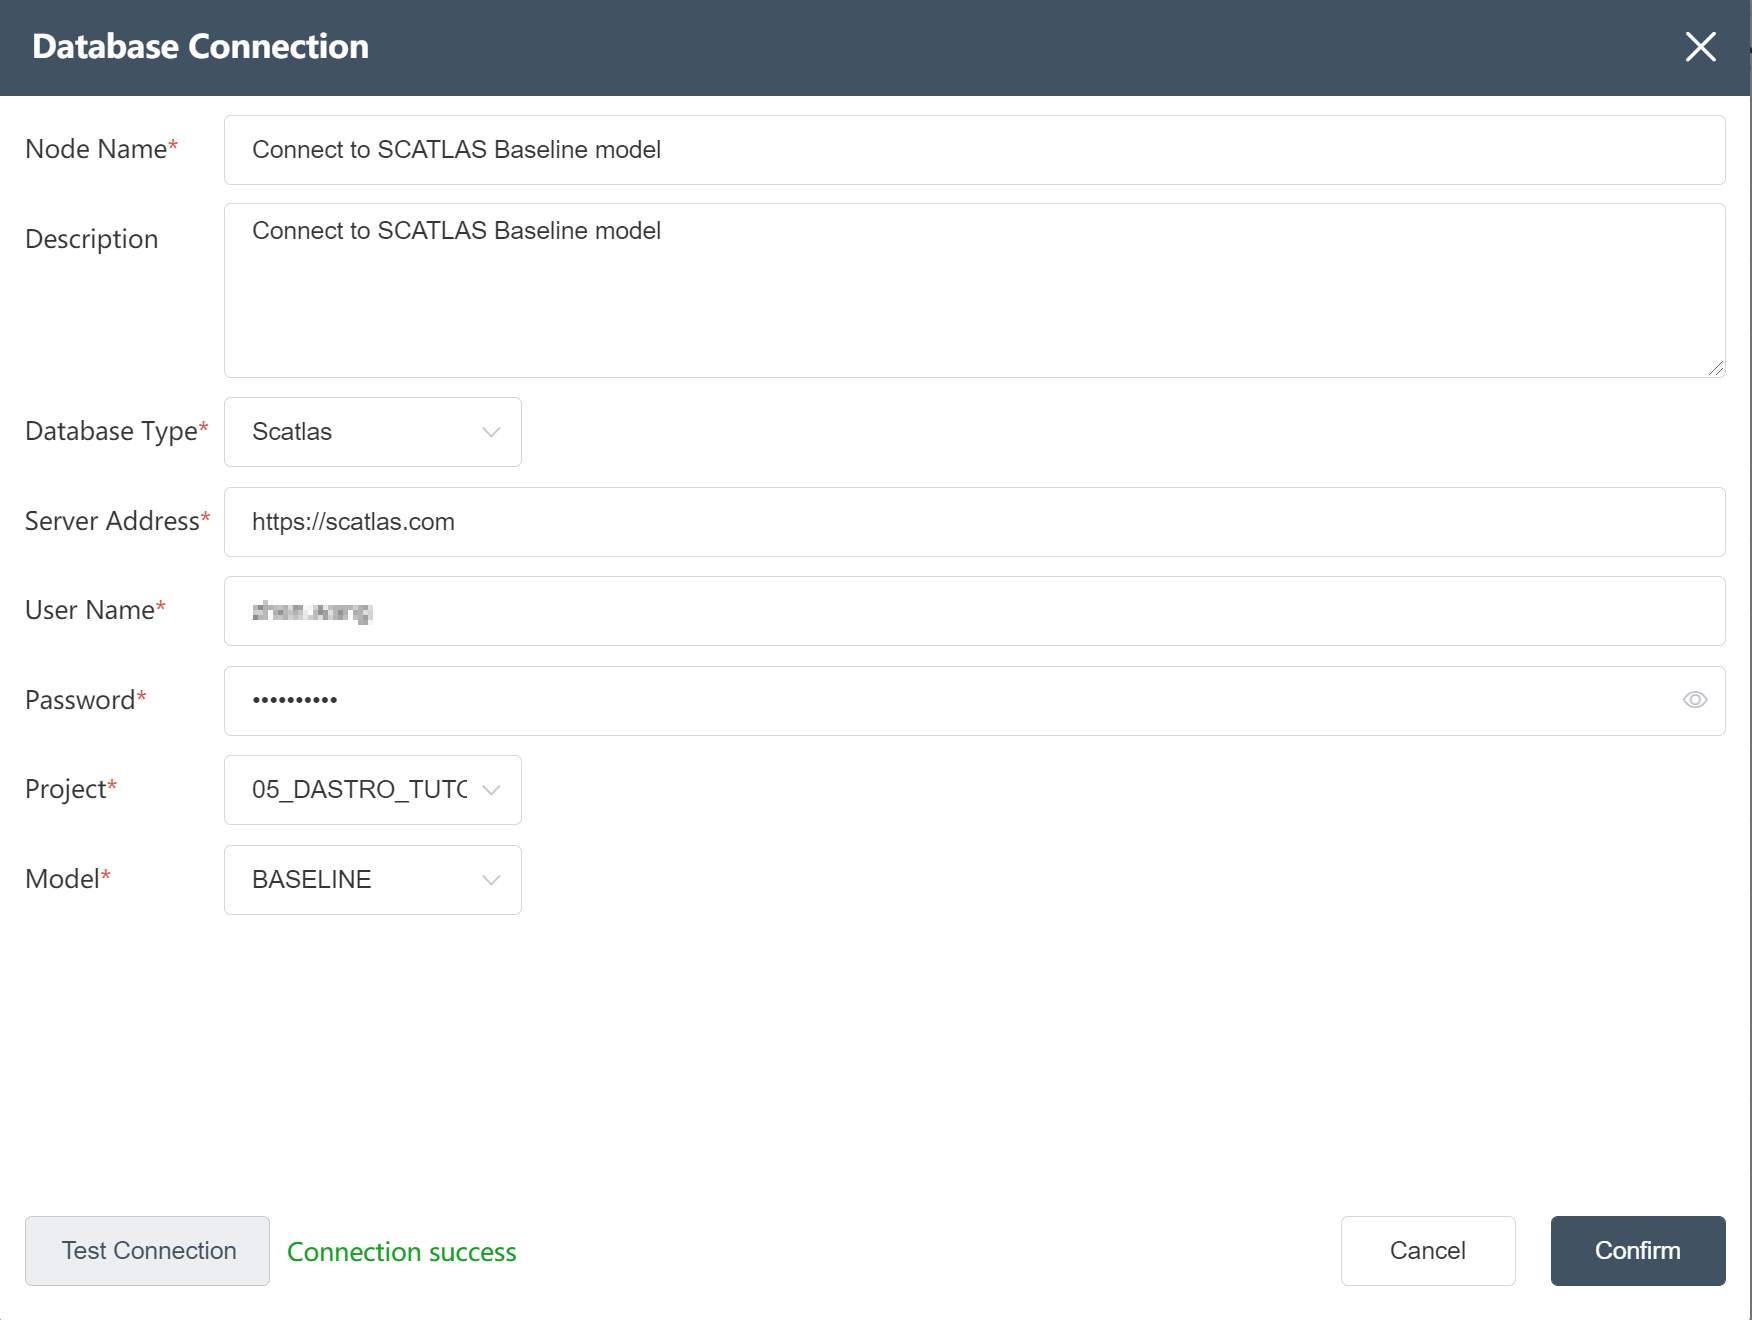
# New node: SCATLAS-Baseline empty table connection
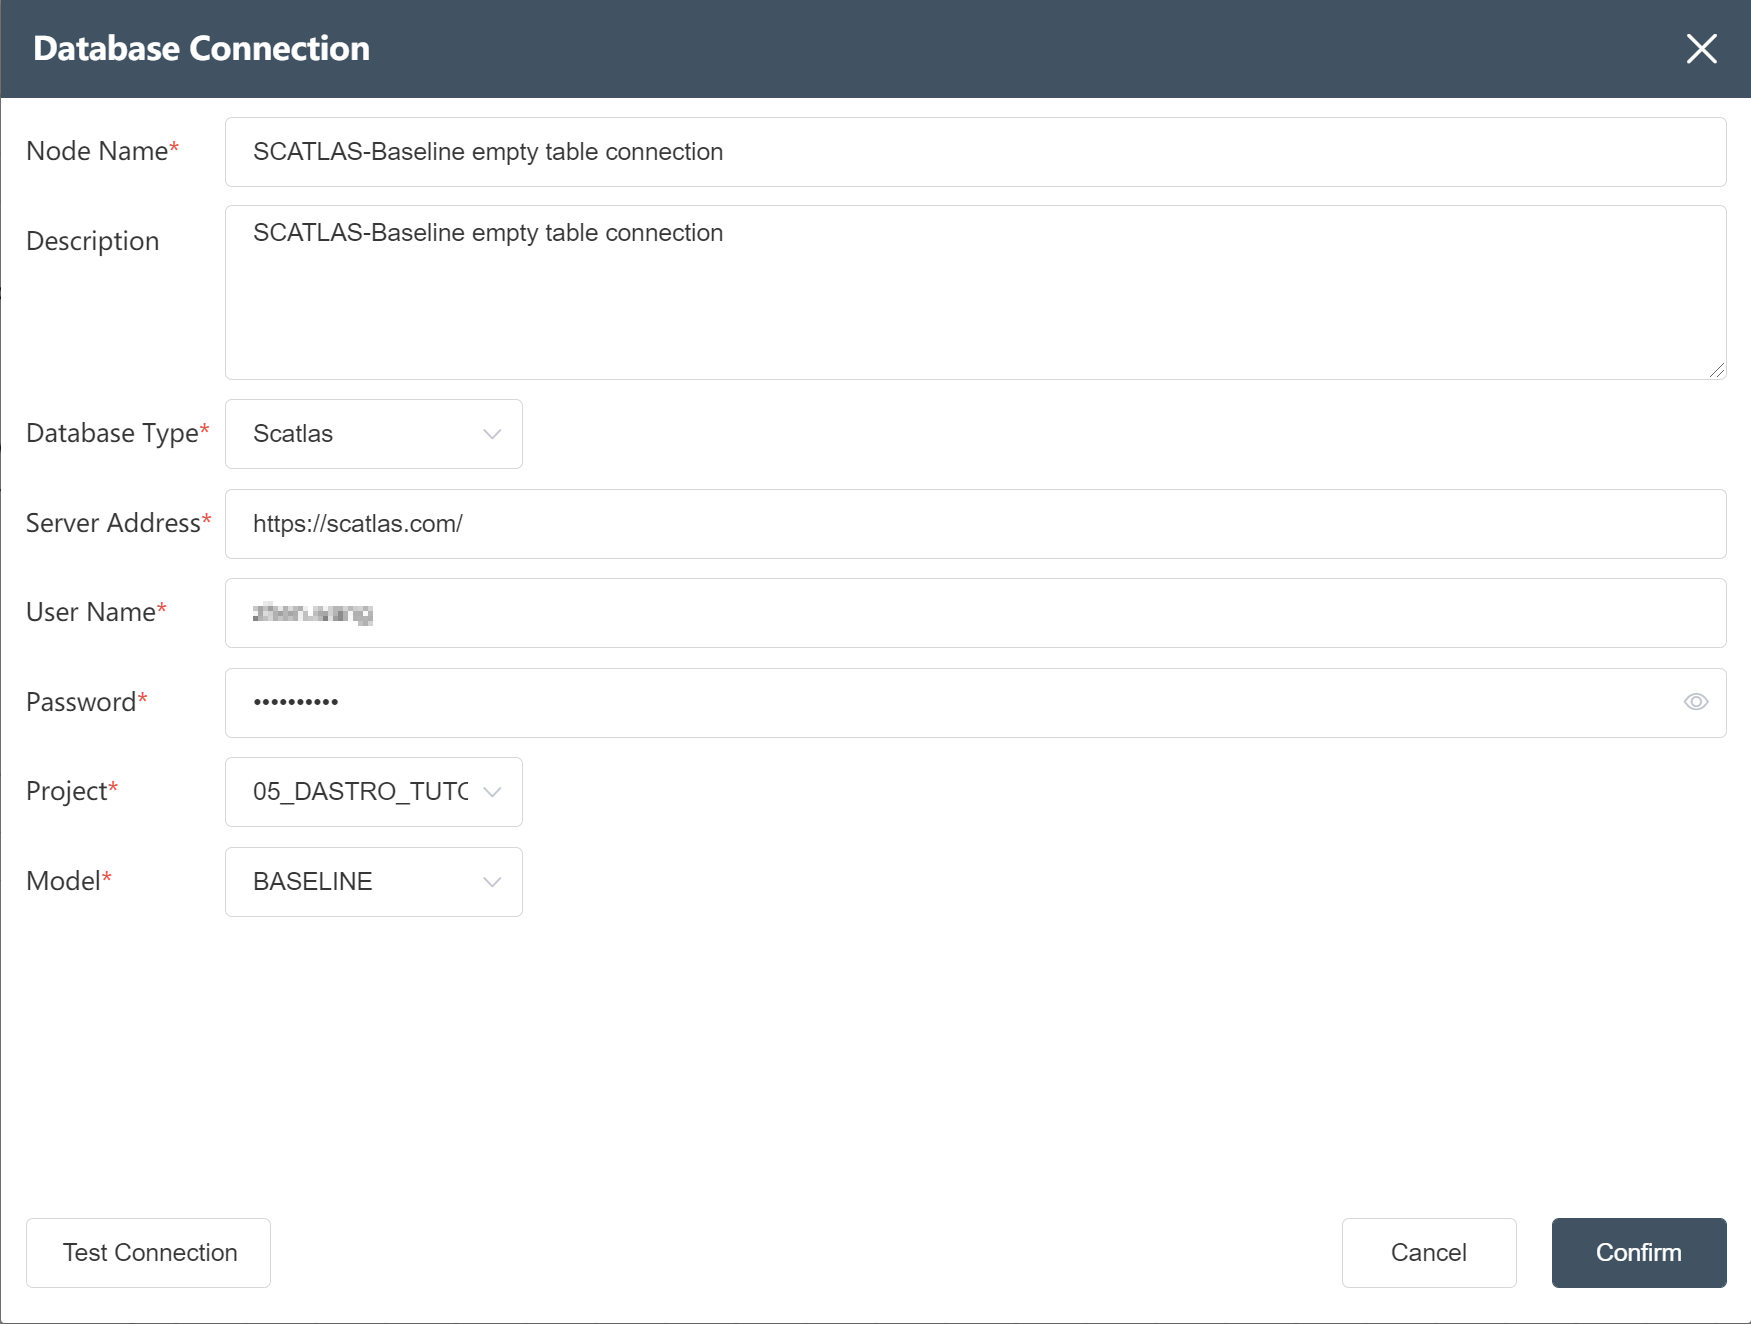
- Select "Database Connection".
- Fill in the node name: SCATLAS-Baseline empty table connection
- Select database type: SCATLAS
- Fill in the server address: https://scatlas.com/ (opens new window)
- Enter account and password
- Select a folder and the models under that folder
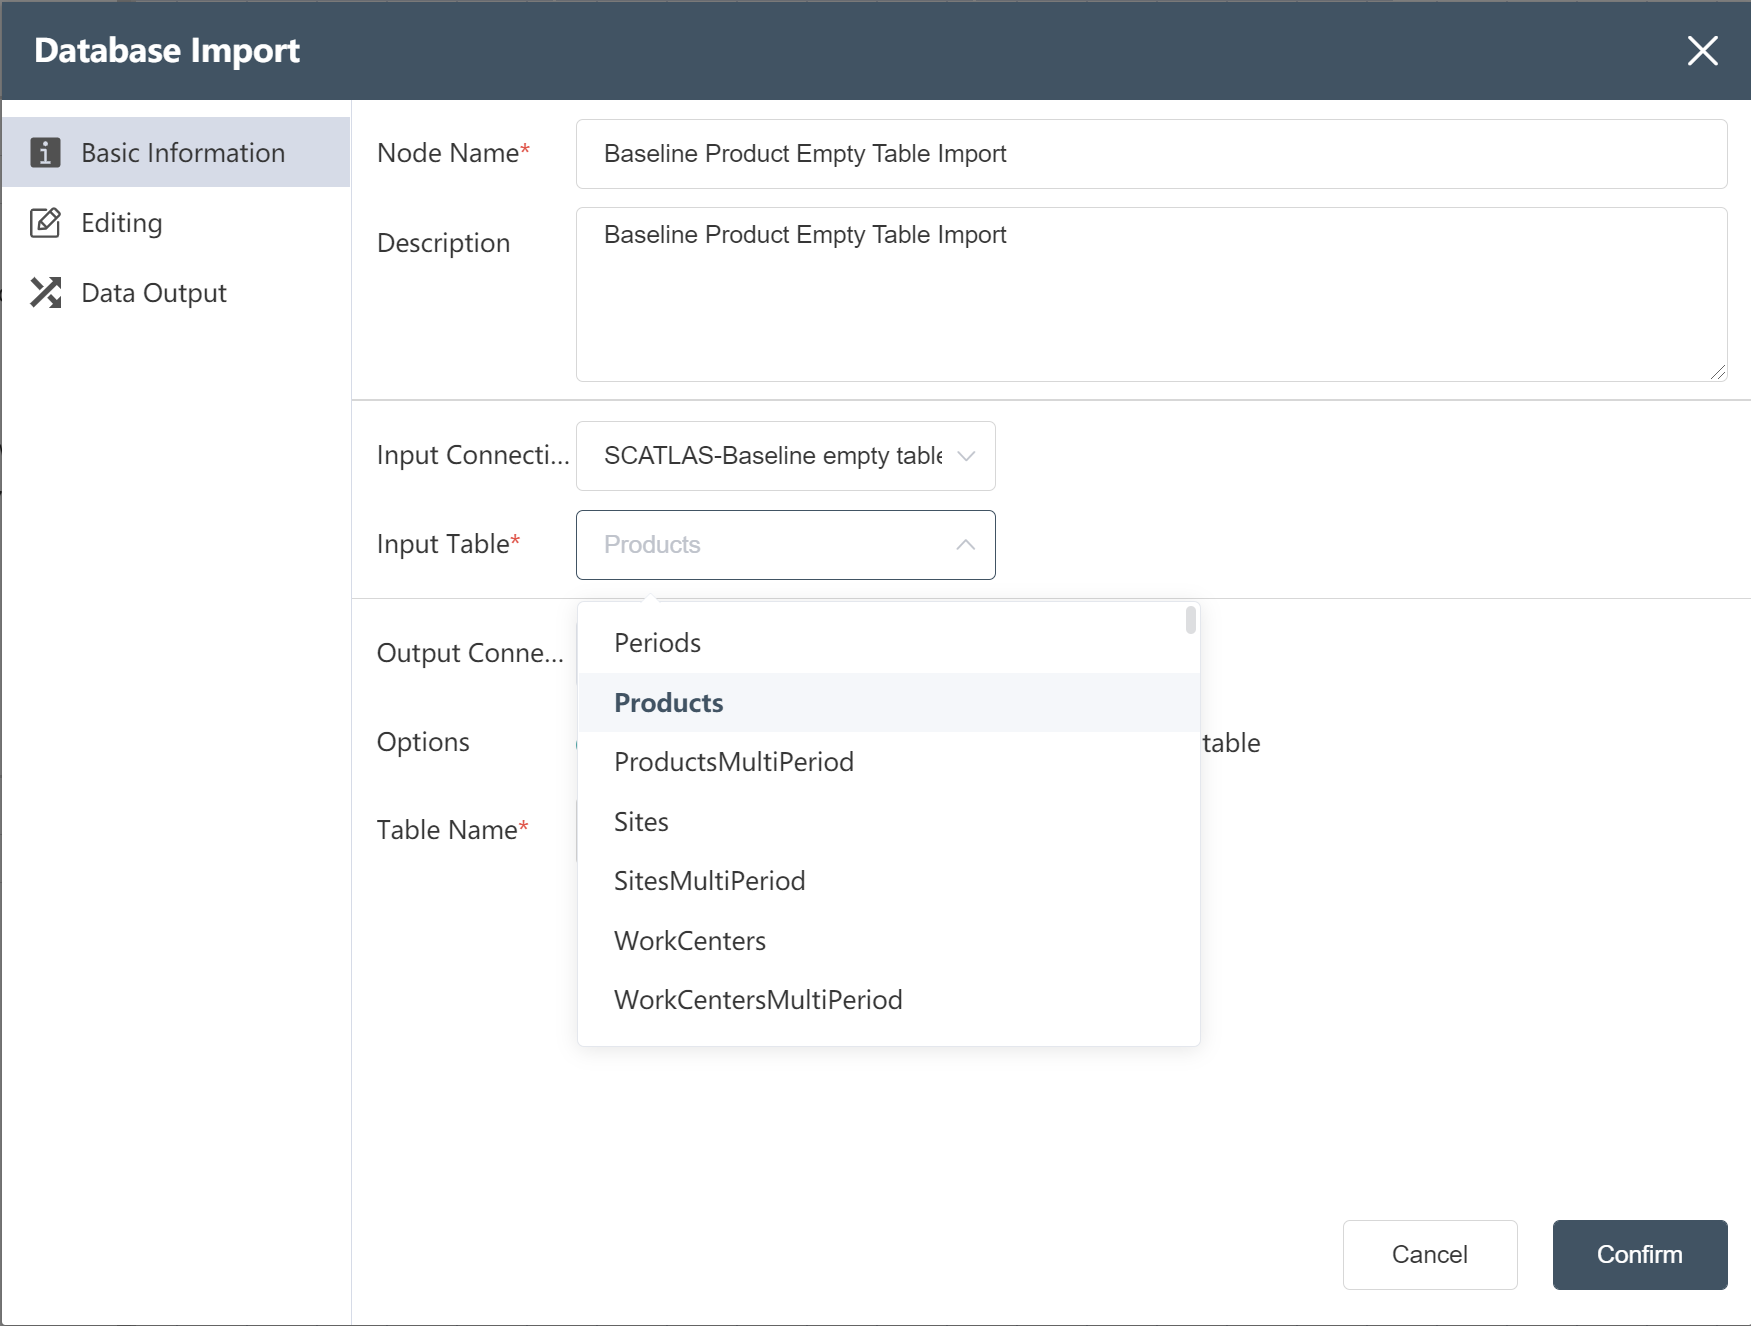
# SCATLAS® Empty Table Import:
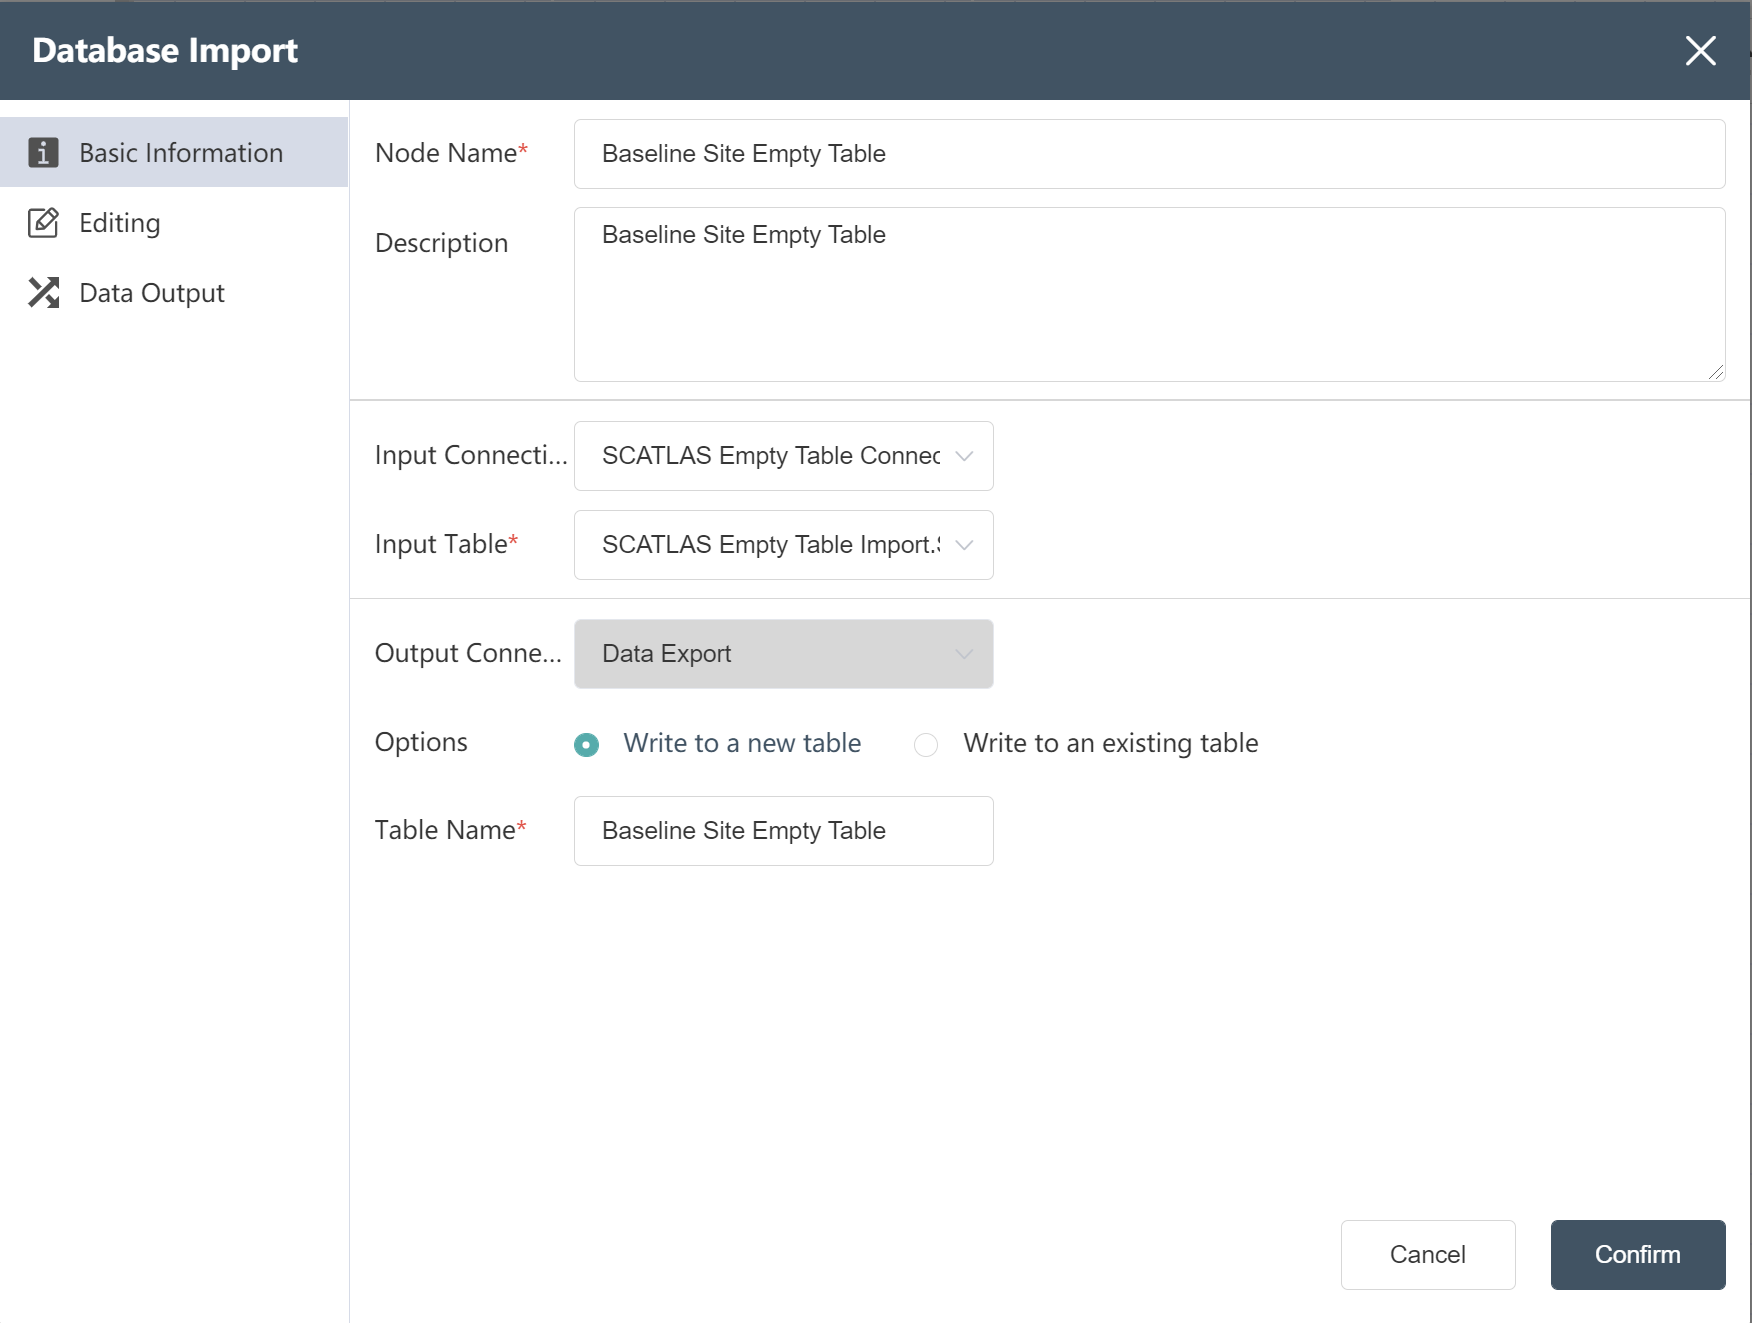
- Select "Database Import"
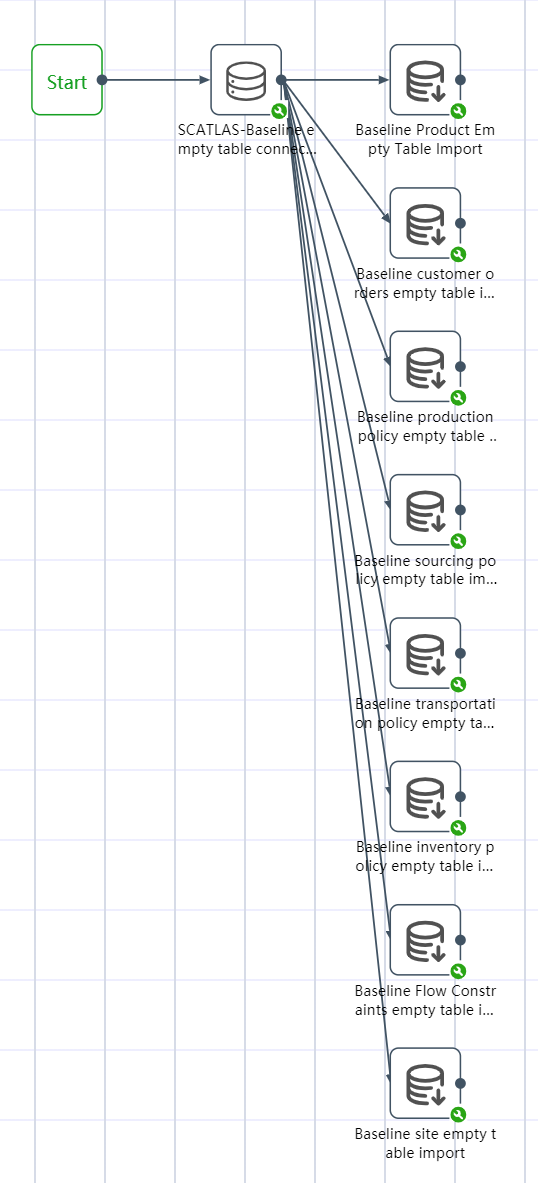
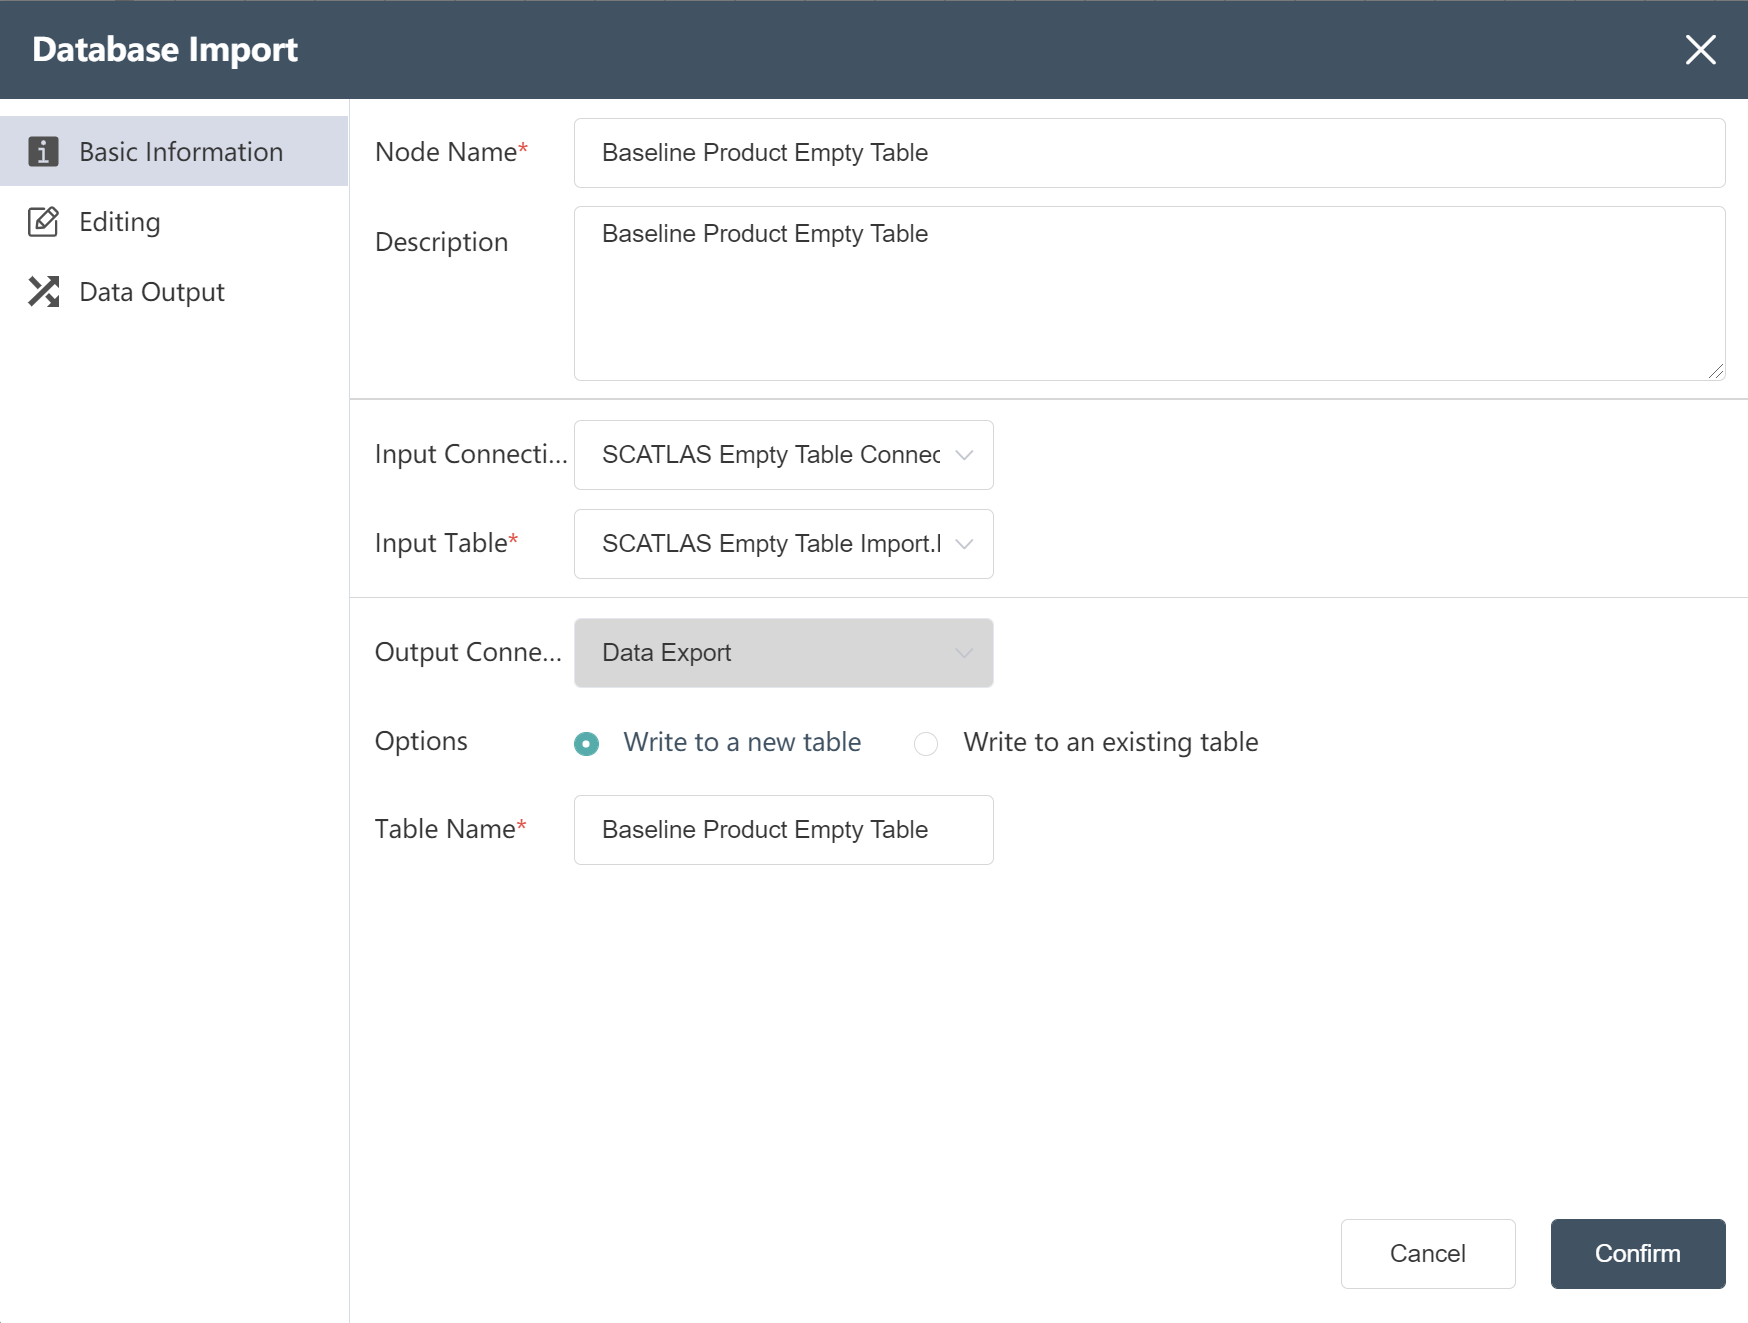
- New Node: Baseline Product Empty Table Import
- Fill in the node name
- Select input link: SCATLAS-Baseline empty table join (previous node)
- Select product by table name
- write mode select write new table
- Fill in the form name:
- Baseline product empty table;
- Create new nodes according to the methods ①~⑦:
Join the following empty tables in the same way:
- Baseline site empty table import;
- Baseline customer orders empty table import;
- Baseline production policy empty table import;
- Baseline sourcing policy empty table import;
- Baseline transportation policy empty table import;
- Baseline inventory policy empty table import;
- Baseline Flow Constraints empty table import.
# Step 2: Data Analysis
Organize the cleaned raw data into the format of the model input table in the data cleaning analysis node group:
First connect and import the data of the previous node group; then you can perform operations such as merging tables, updating multiple tables, and data grouping and aggregation; and finally writing to a new table for use.
# Node Group 5: Data Wrangling and Analysis
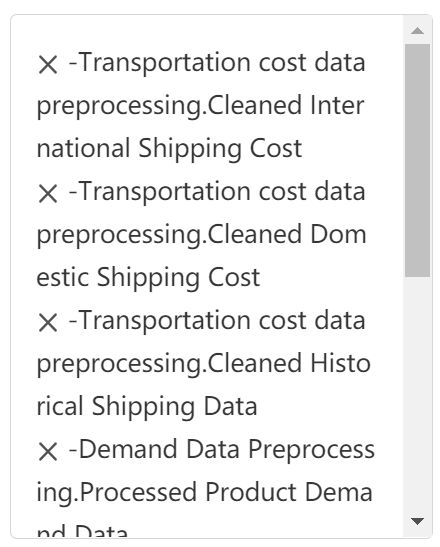
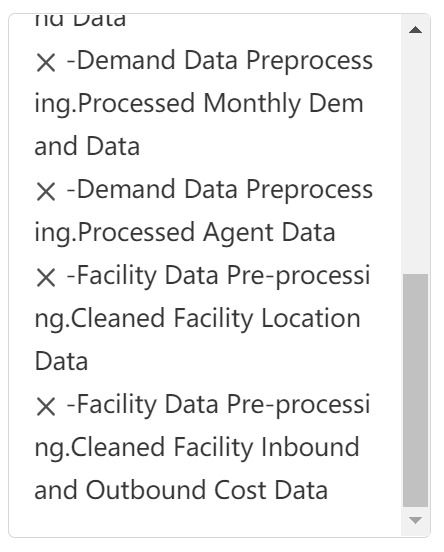
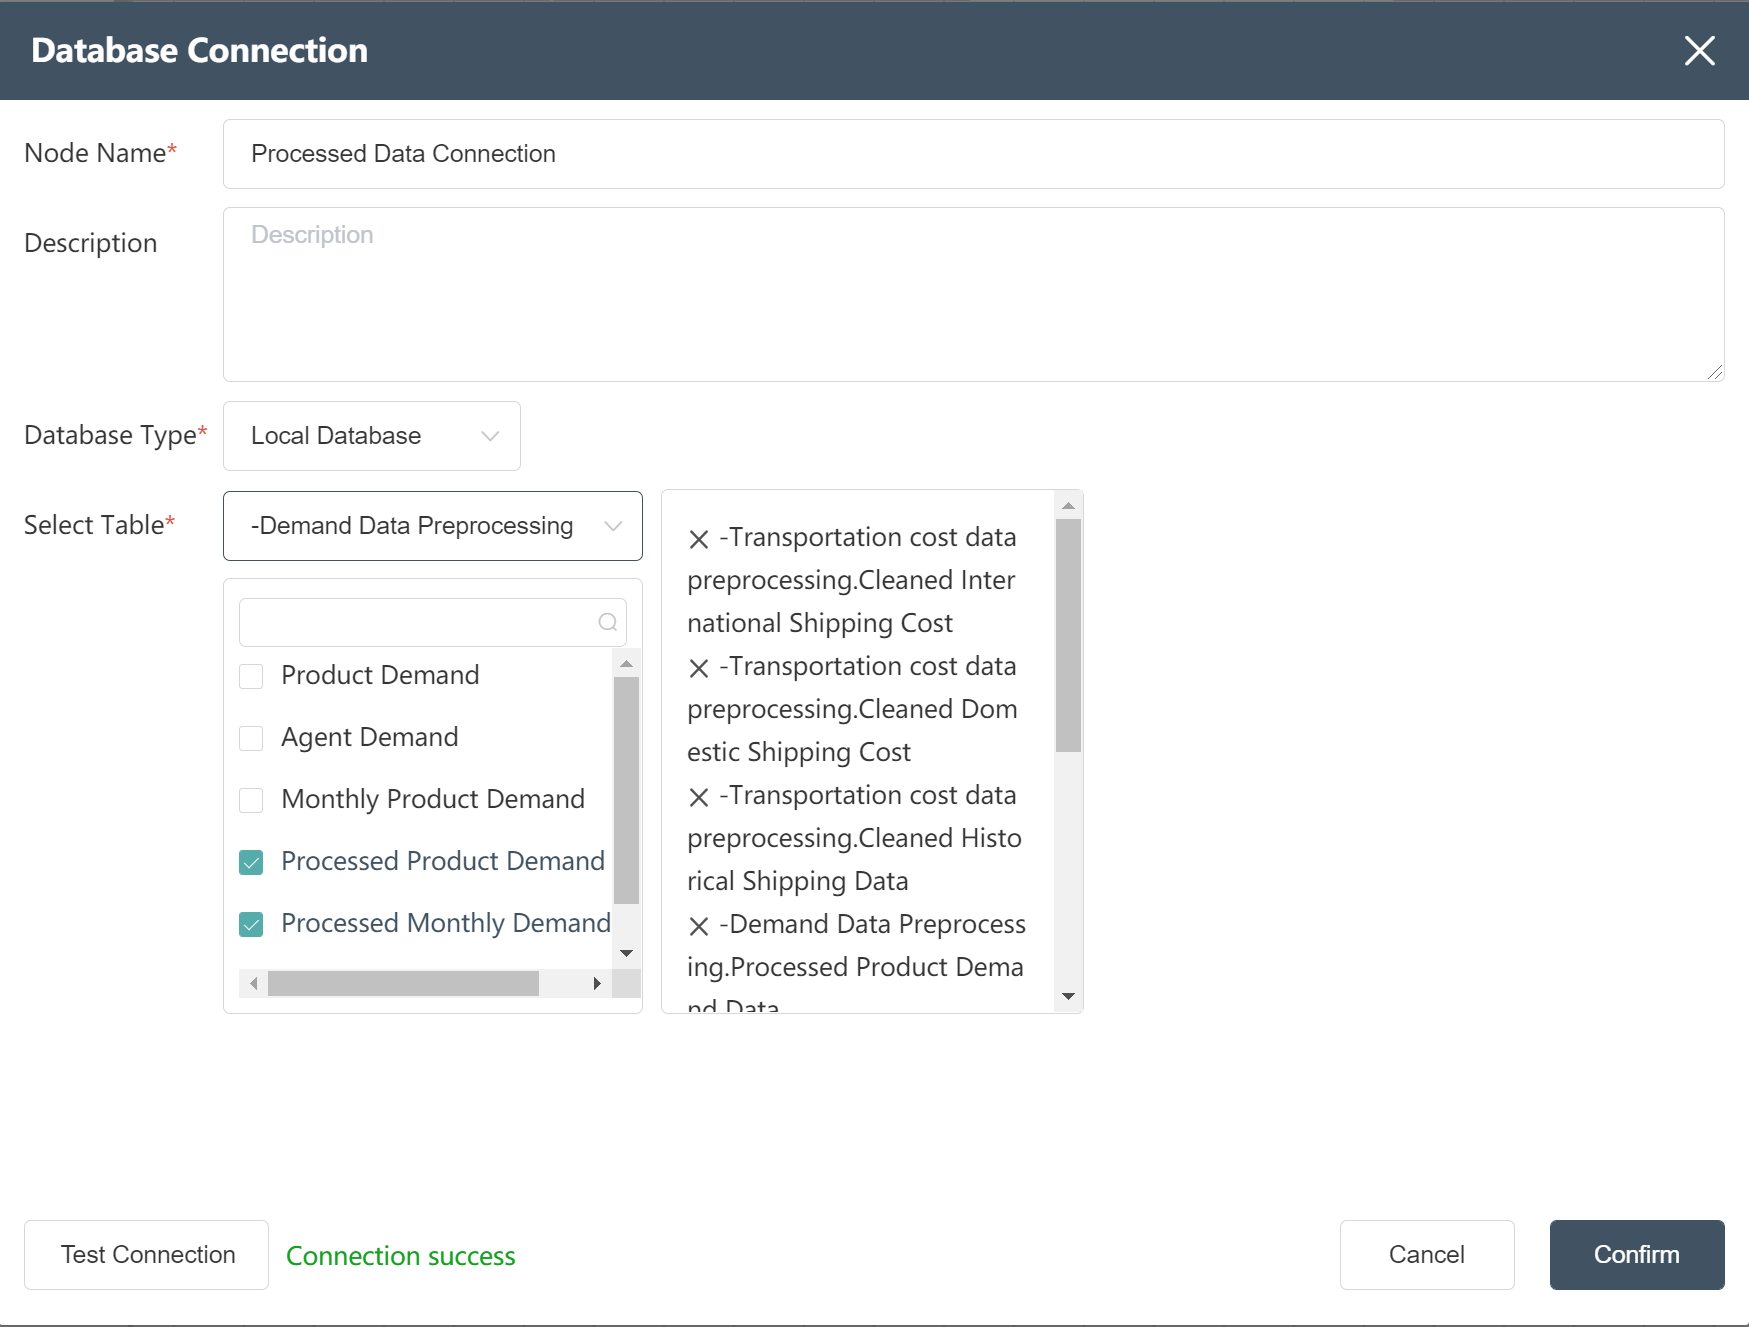
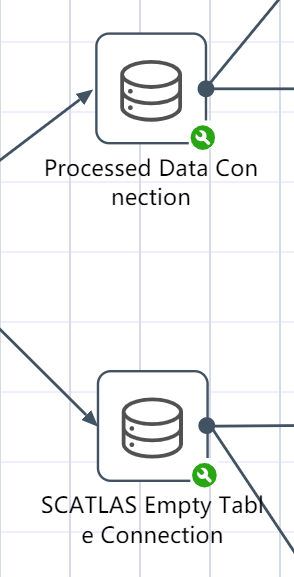
# New Node: Processed Data Connection
- Double click/drag the data path connection node to the edit area
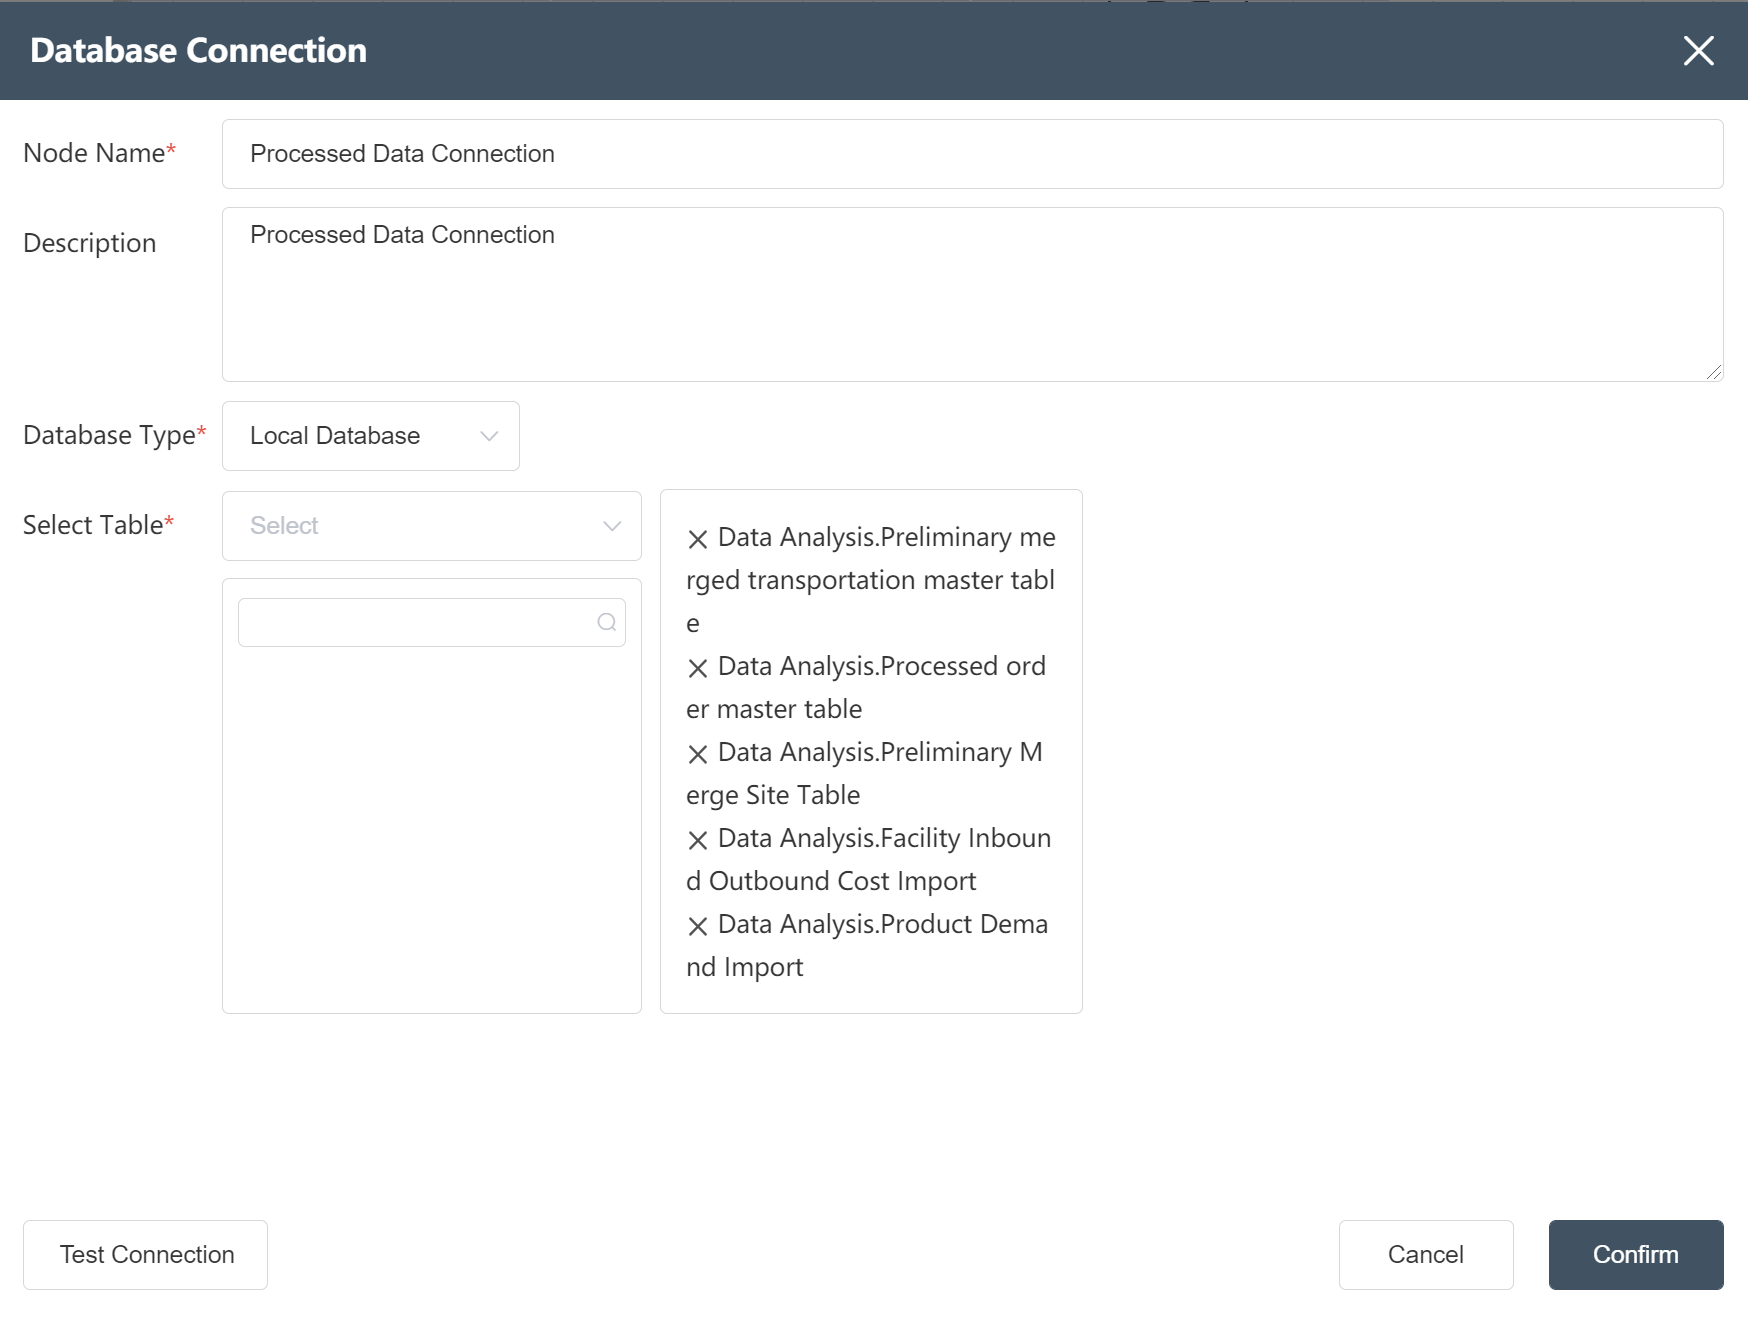
- Fill in Node Name: Data Connection Processed
- Select database type: Local Database
- Prompt selection table as shown below
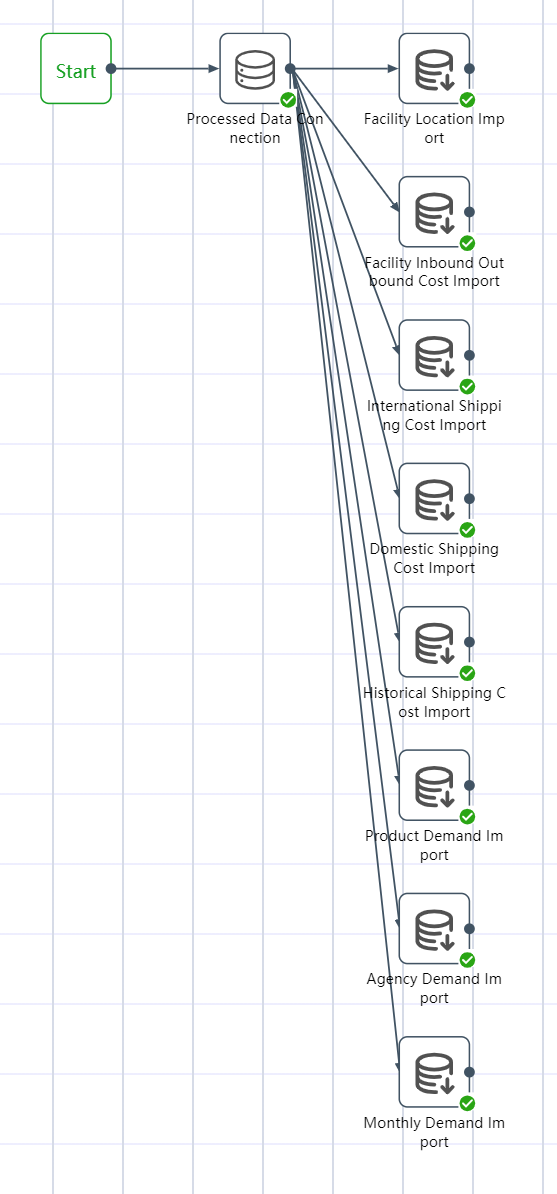
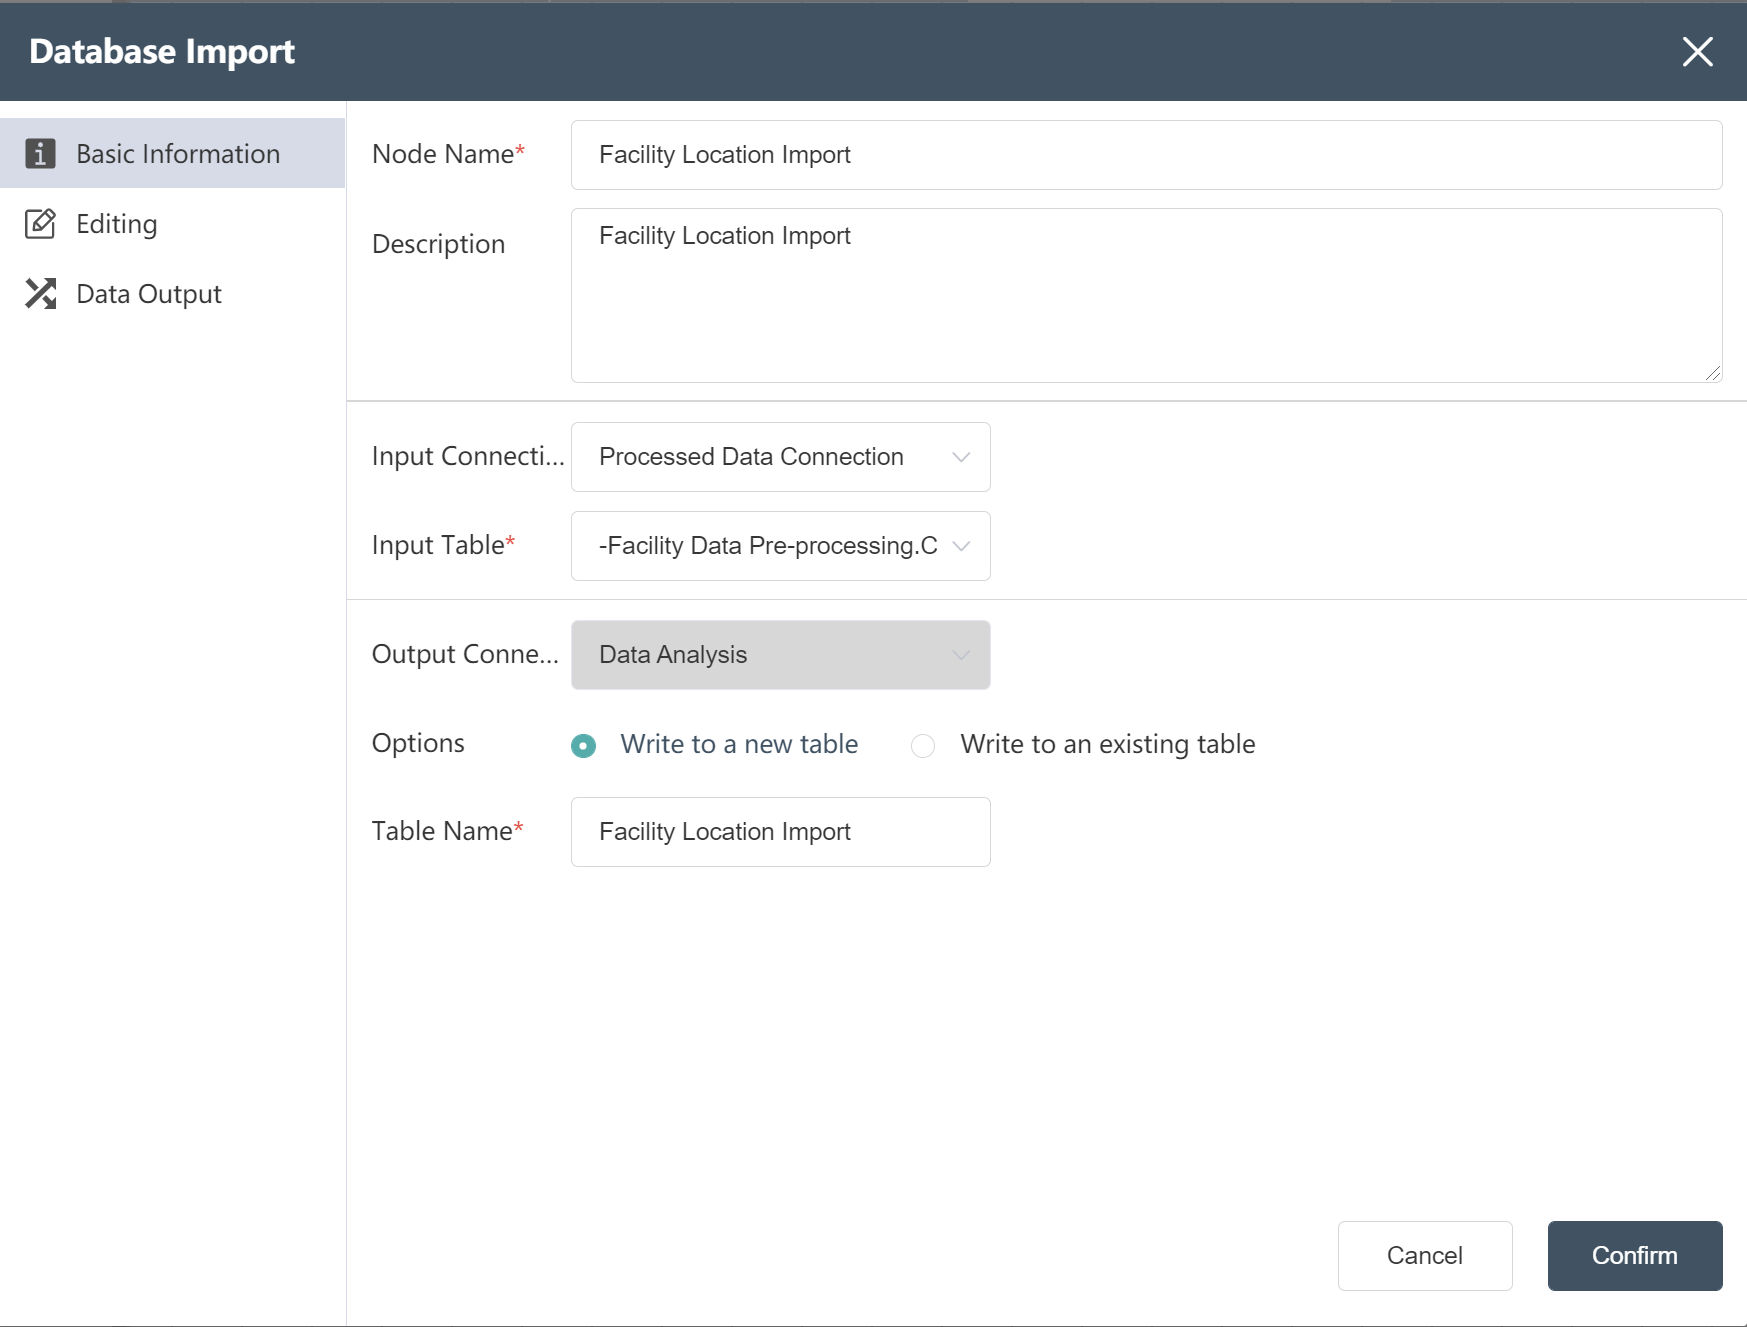
# Database import node construction
- Double click/drag database import node to edit area
- Fill in the node name: Facility location table import
- Select input connection and input table
- Select write mode: write to new table
- Fill in the output table name: facility location table import
- According to the methods of ①~⑤, import the facility inbound and outbound cost table, international section freight rate table, local section freight rate table, product demand table, monthly demand table, agency table, historical freight data
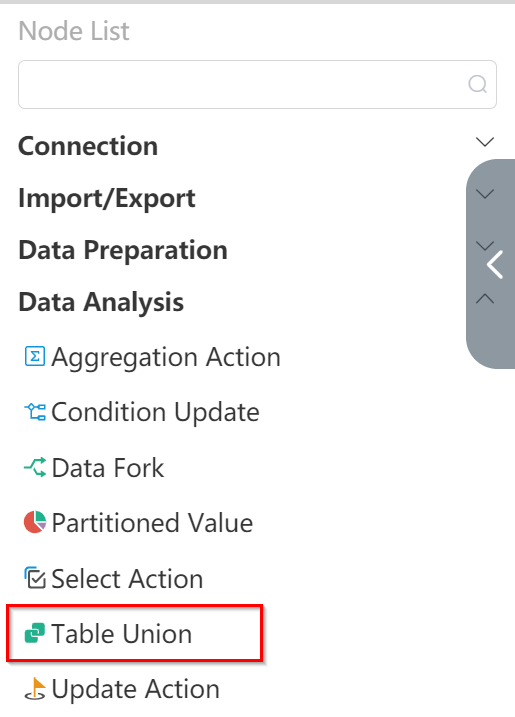
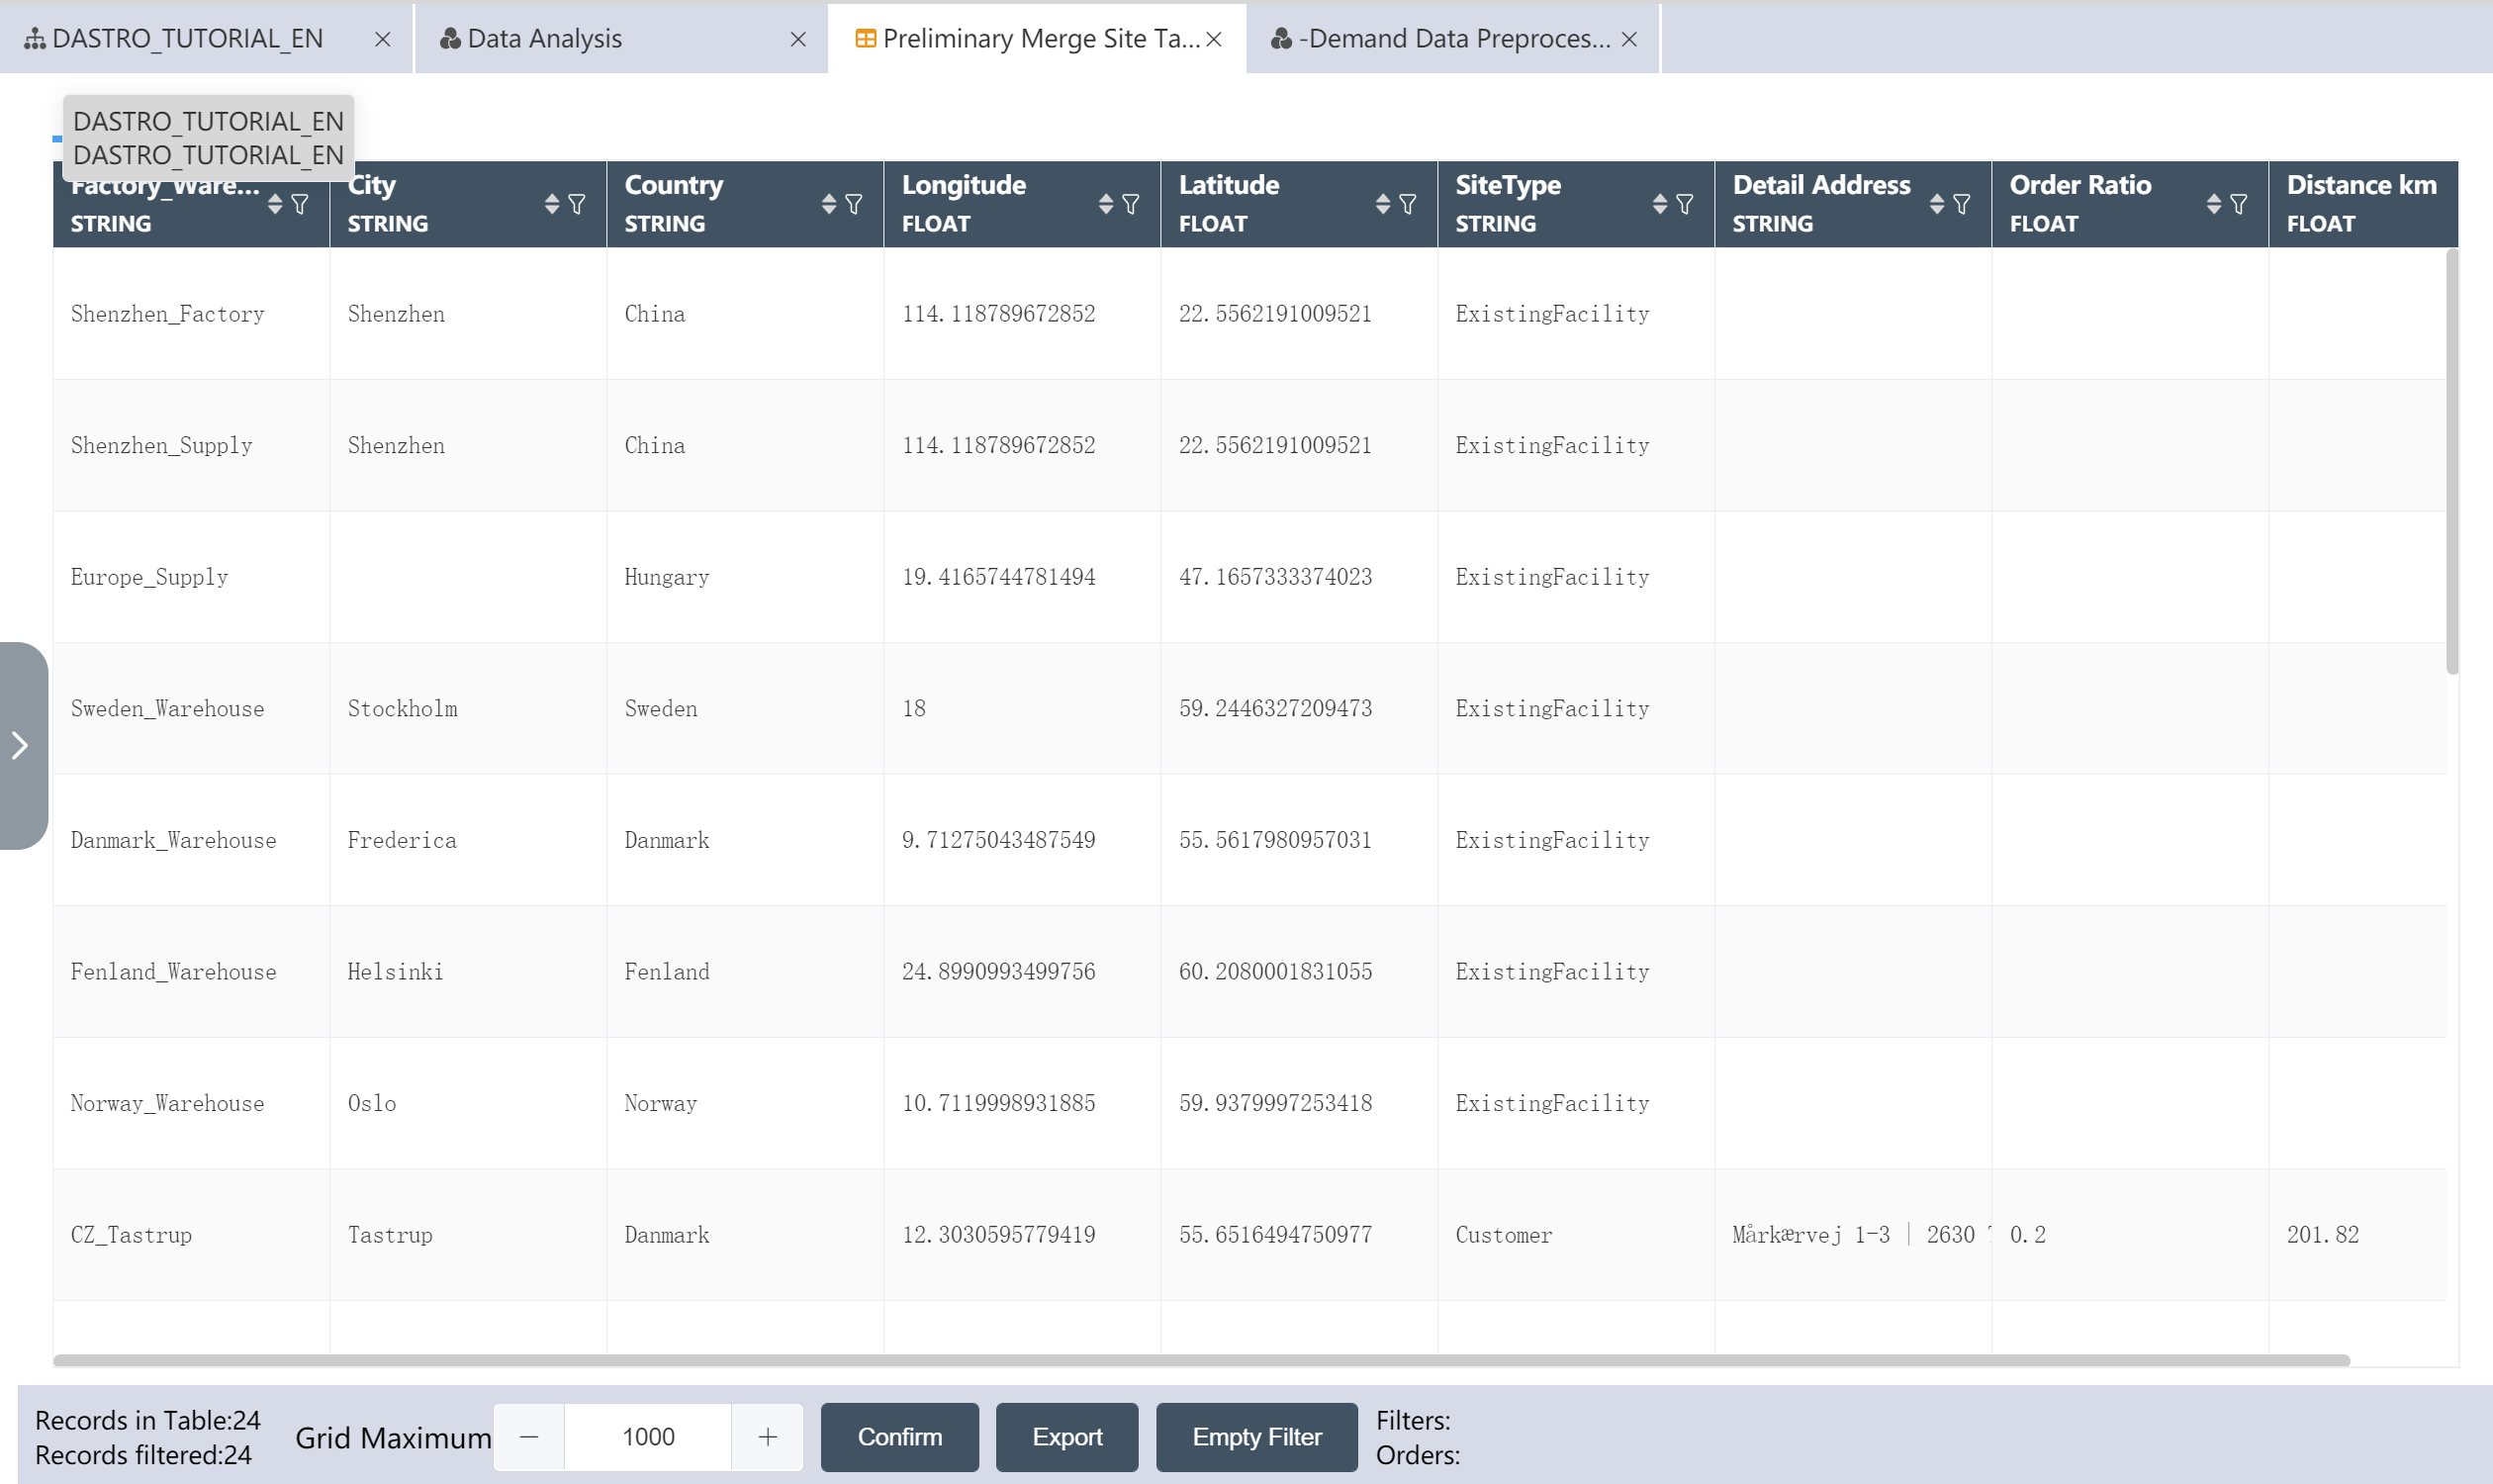
# New Node: Preliminary Merge Site Table
Goal: Combine the facility location table with the agency table to create a merged site table close to the SCATLAS® input table
- Double click/drag table merge node to edit area
- Fill in Node Name: Preliminary Merge Site Table
- Select input data: - facility location table and agency table in the data wrangling analysis node group
- write mode: write to new table
- Fill in the name of the form: Preliminary Merge Site Form
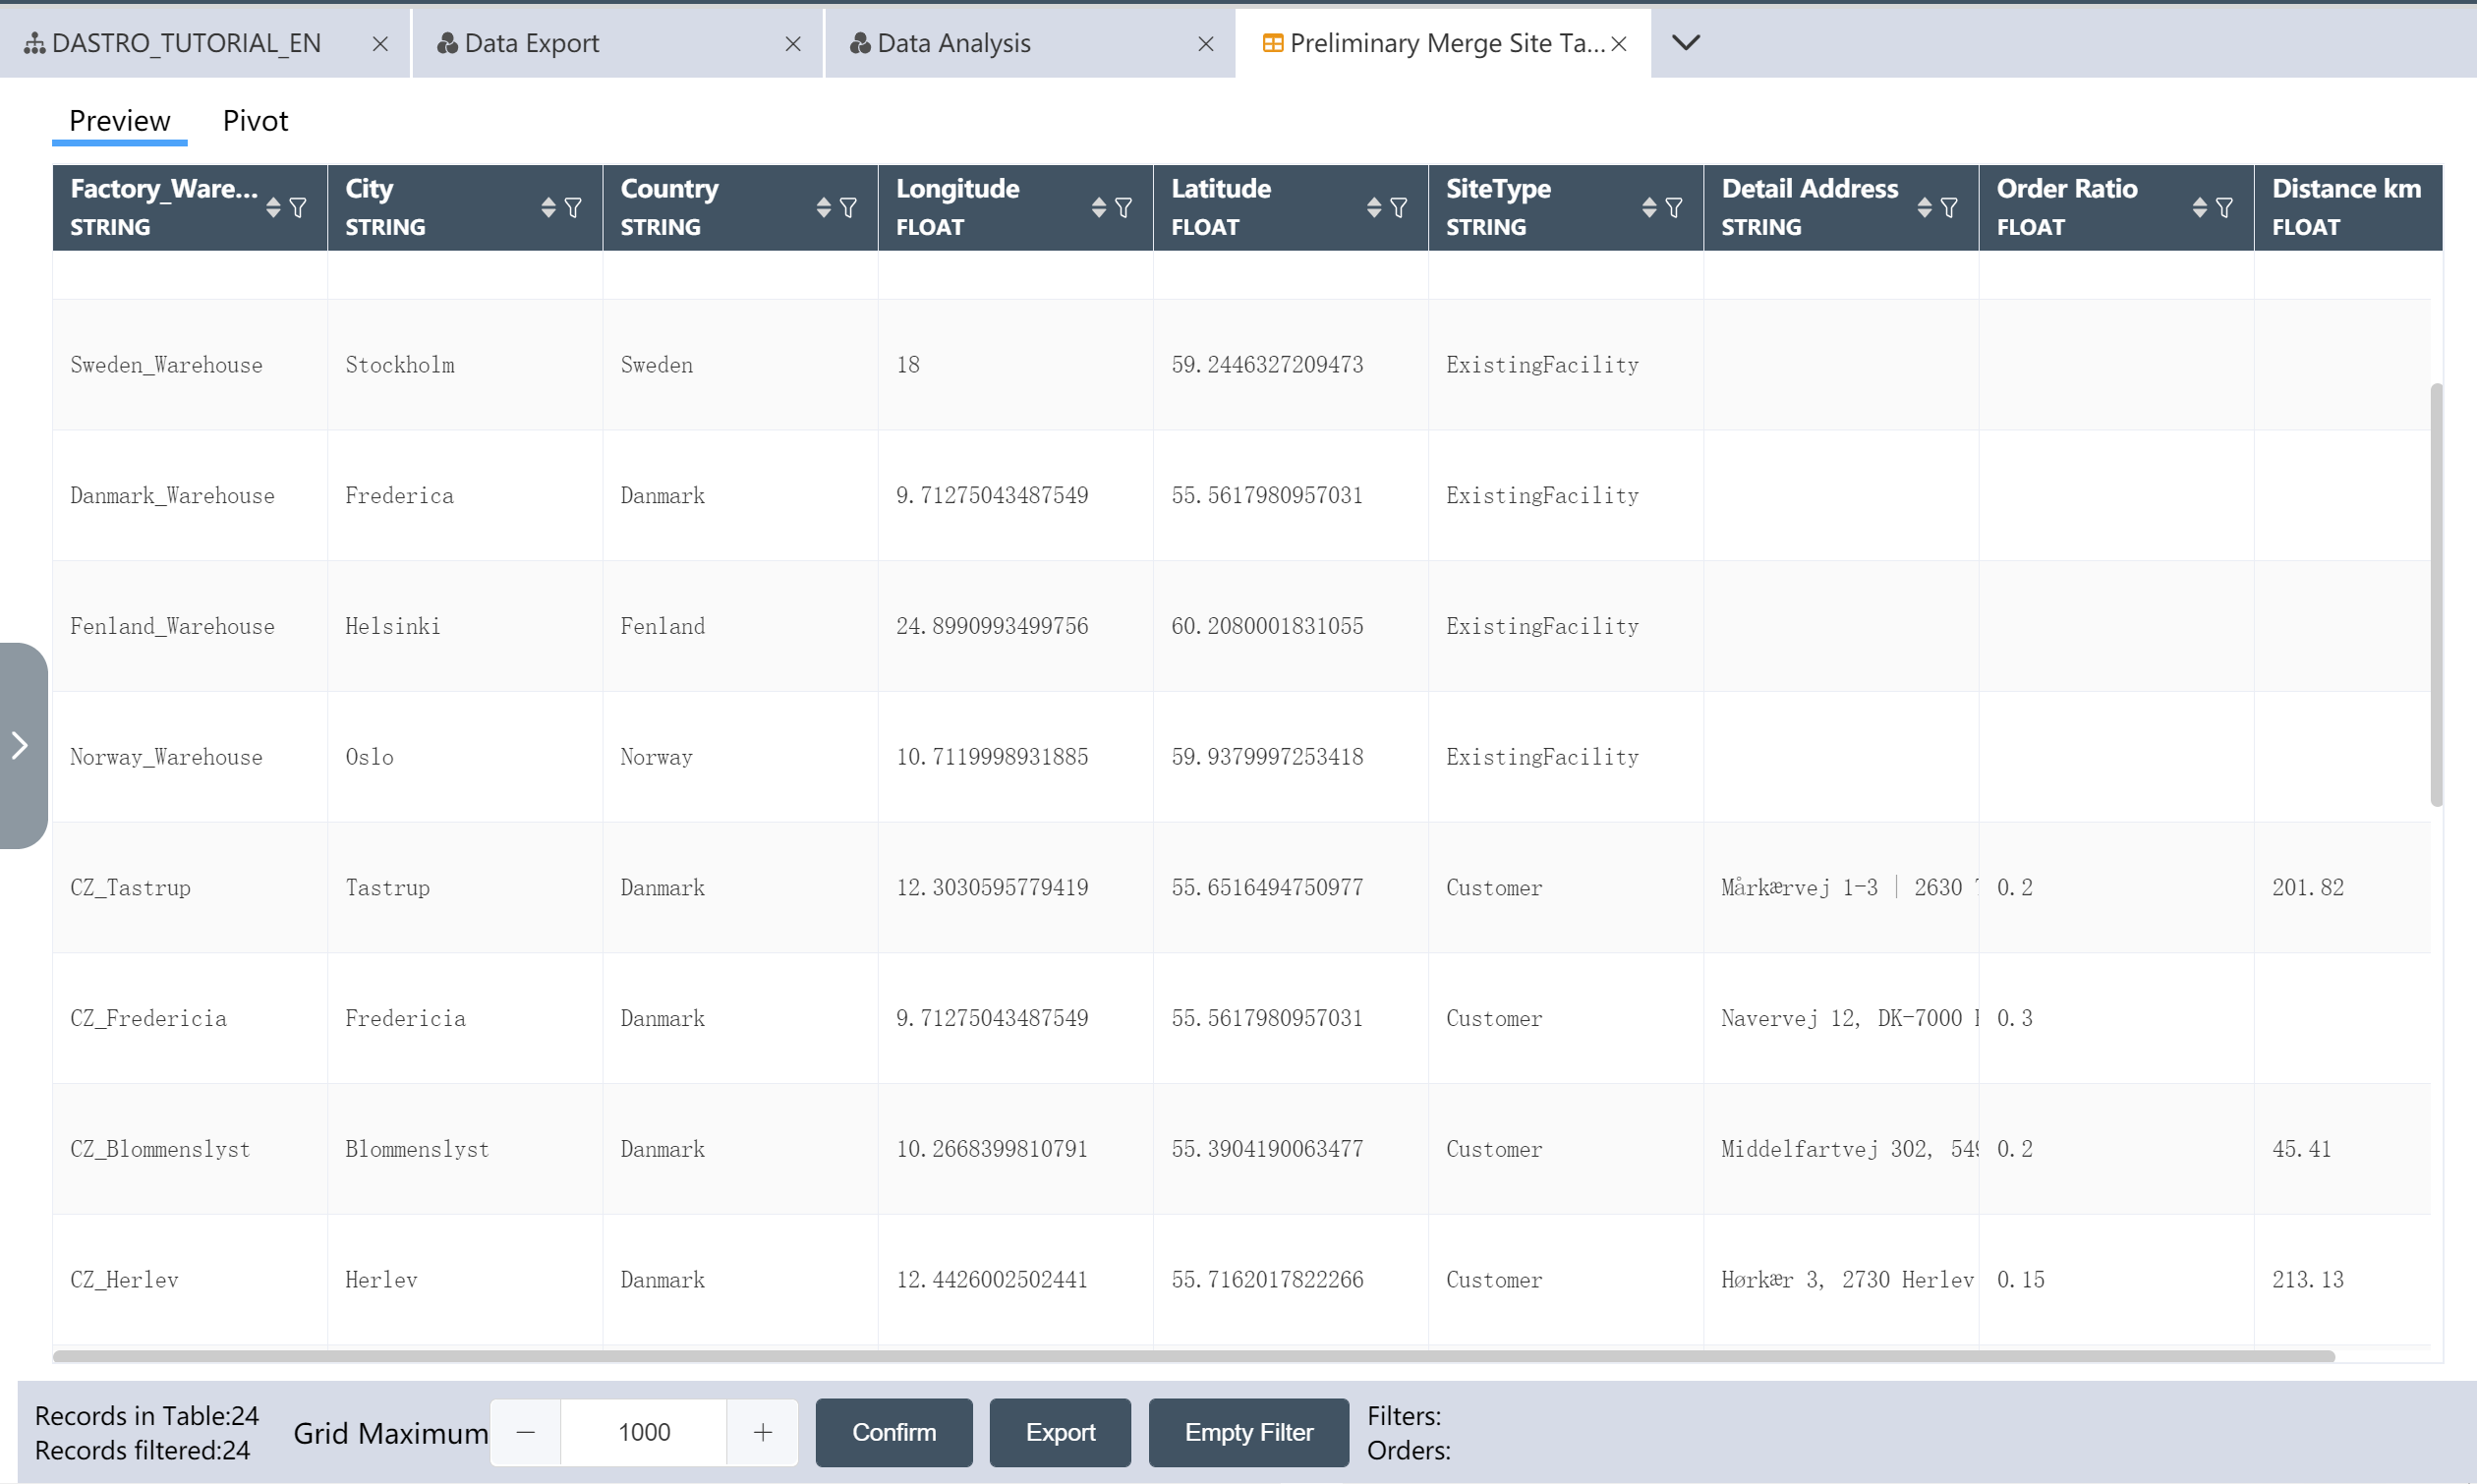
- In the data editing interface, adjust the output data fields as shown below
- Drag and drop the fields of the agency table to correspond to the output fields
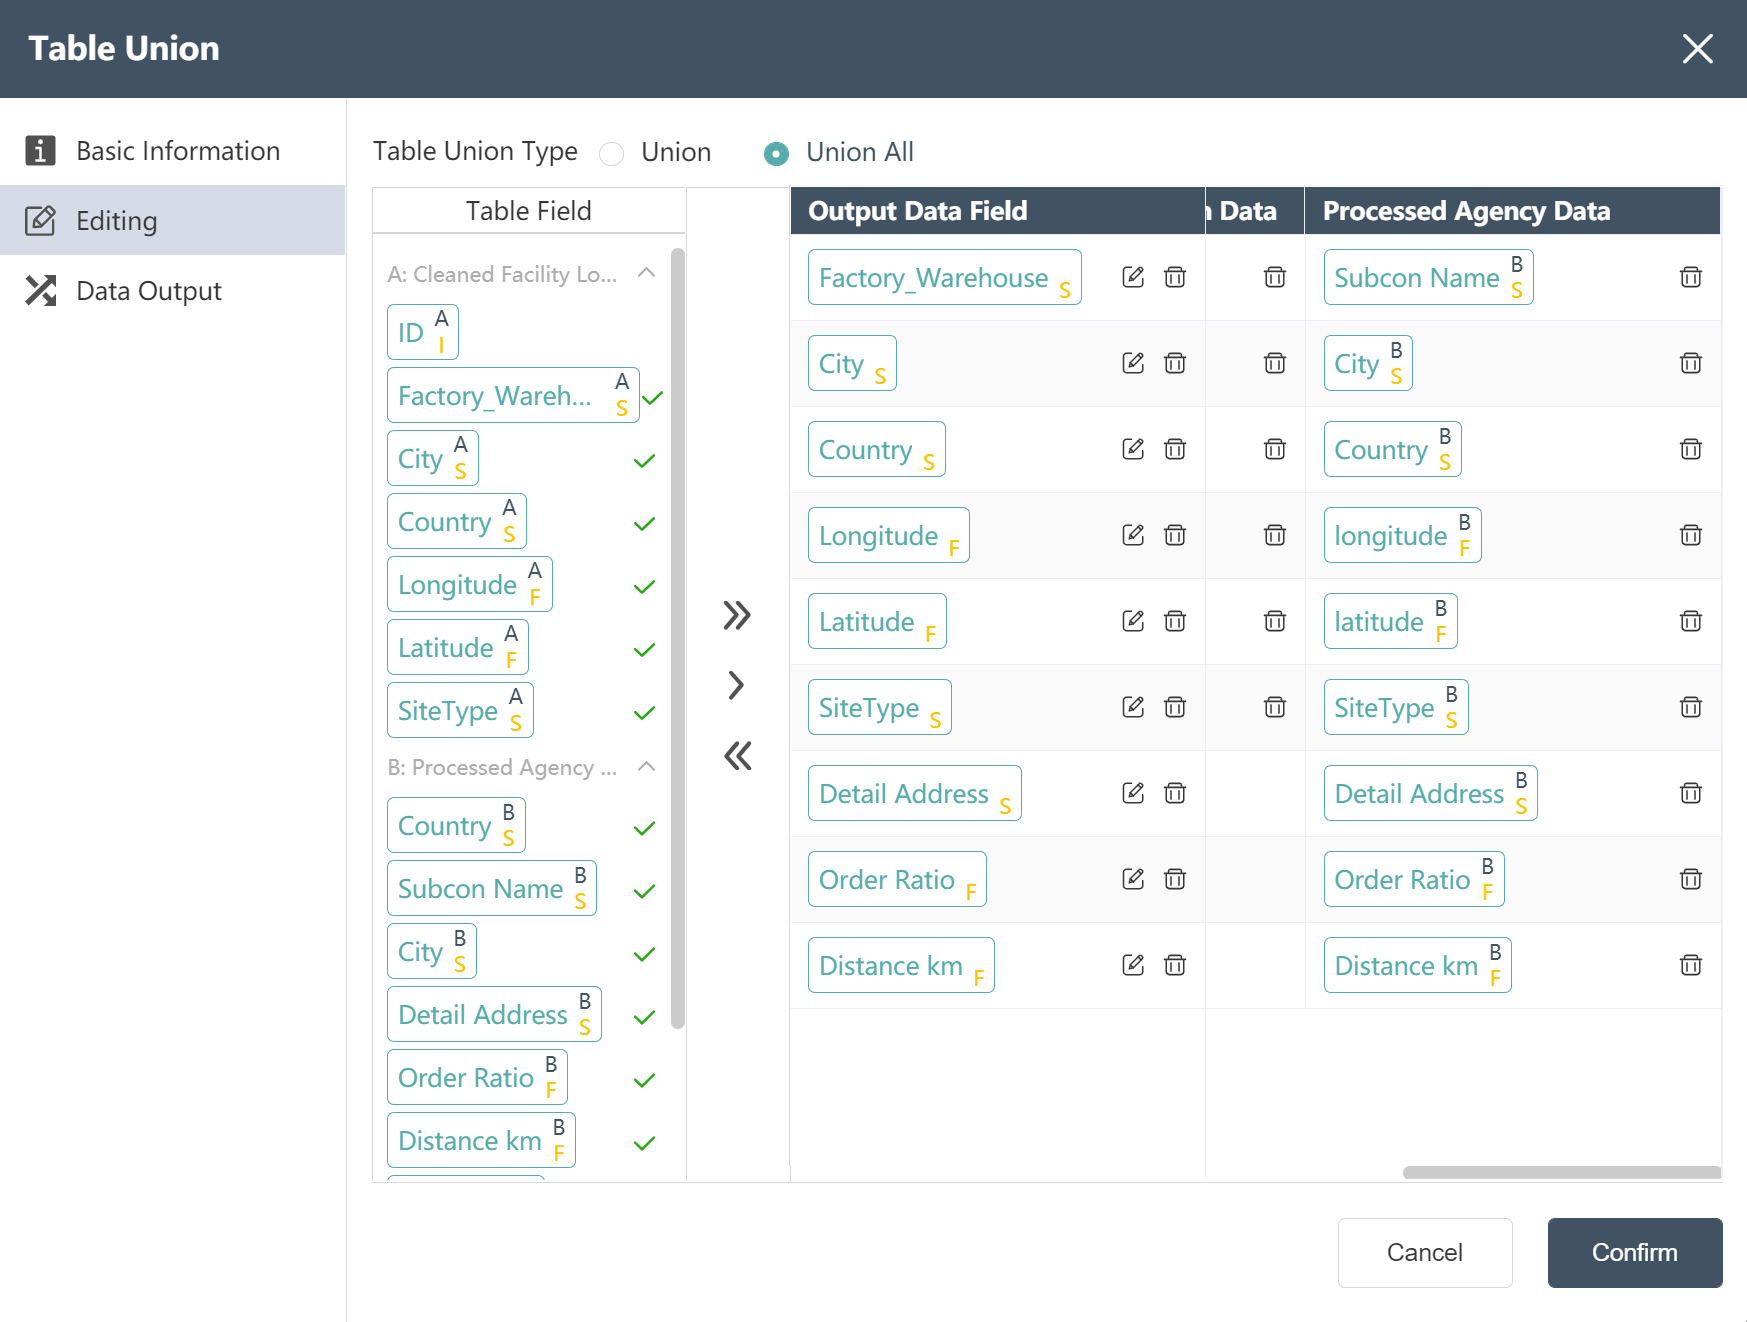
The merged site table can refer to the following figure:
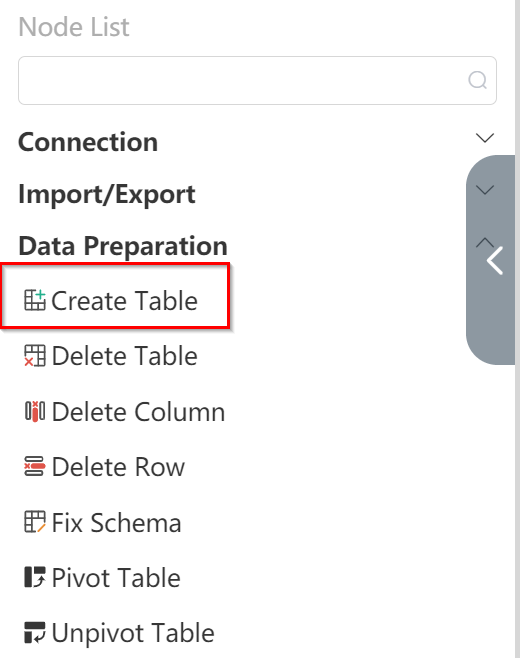

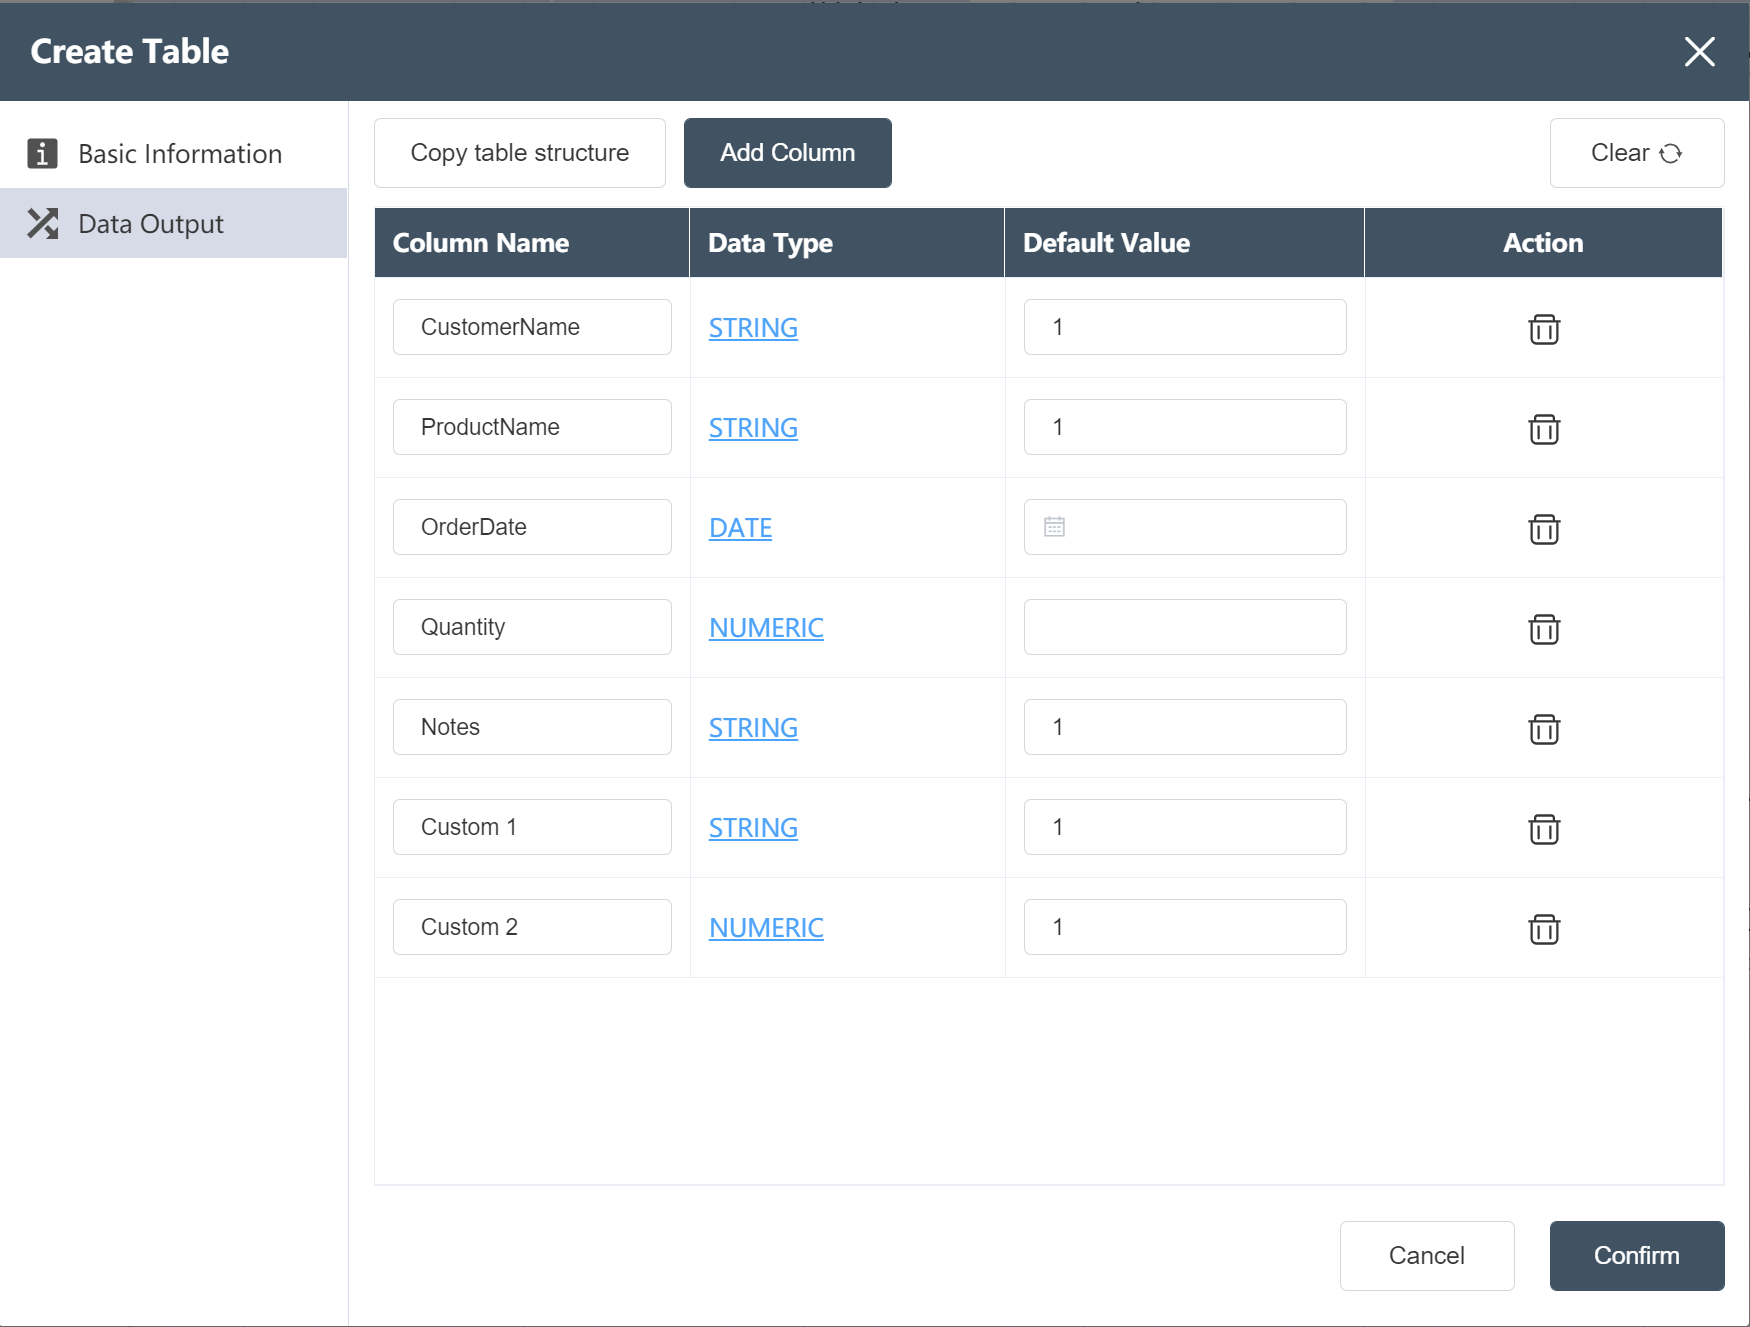
# New node: Create the original order master table
- Double click/drag create table node to edit area
- Fill in the node name: create the original order master table
- Fill in the form name: original order master form
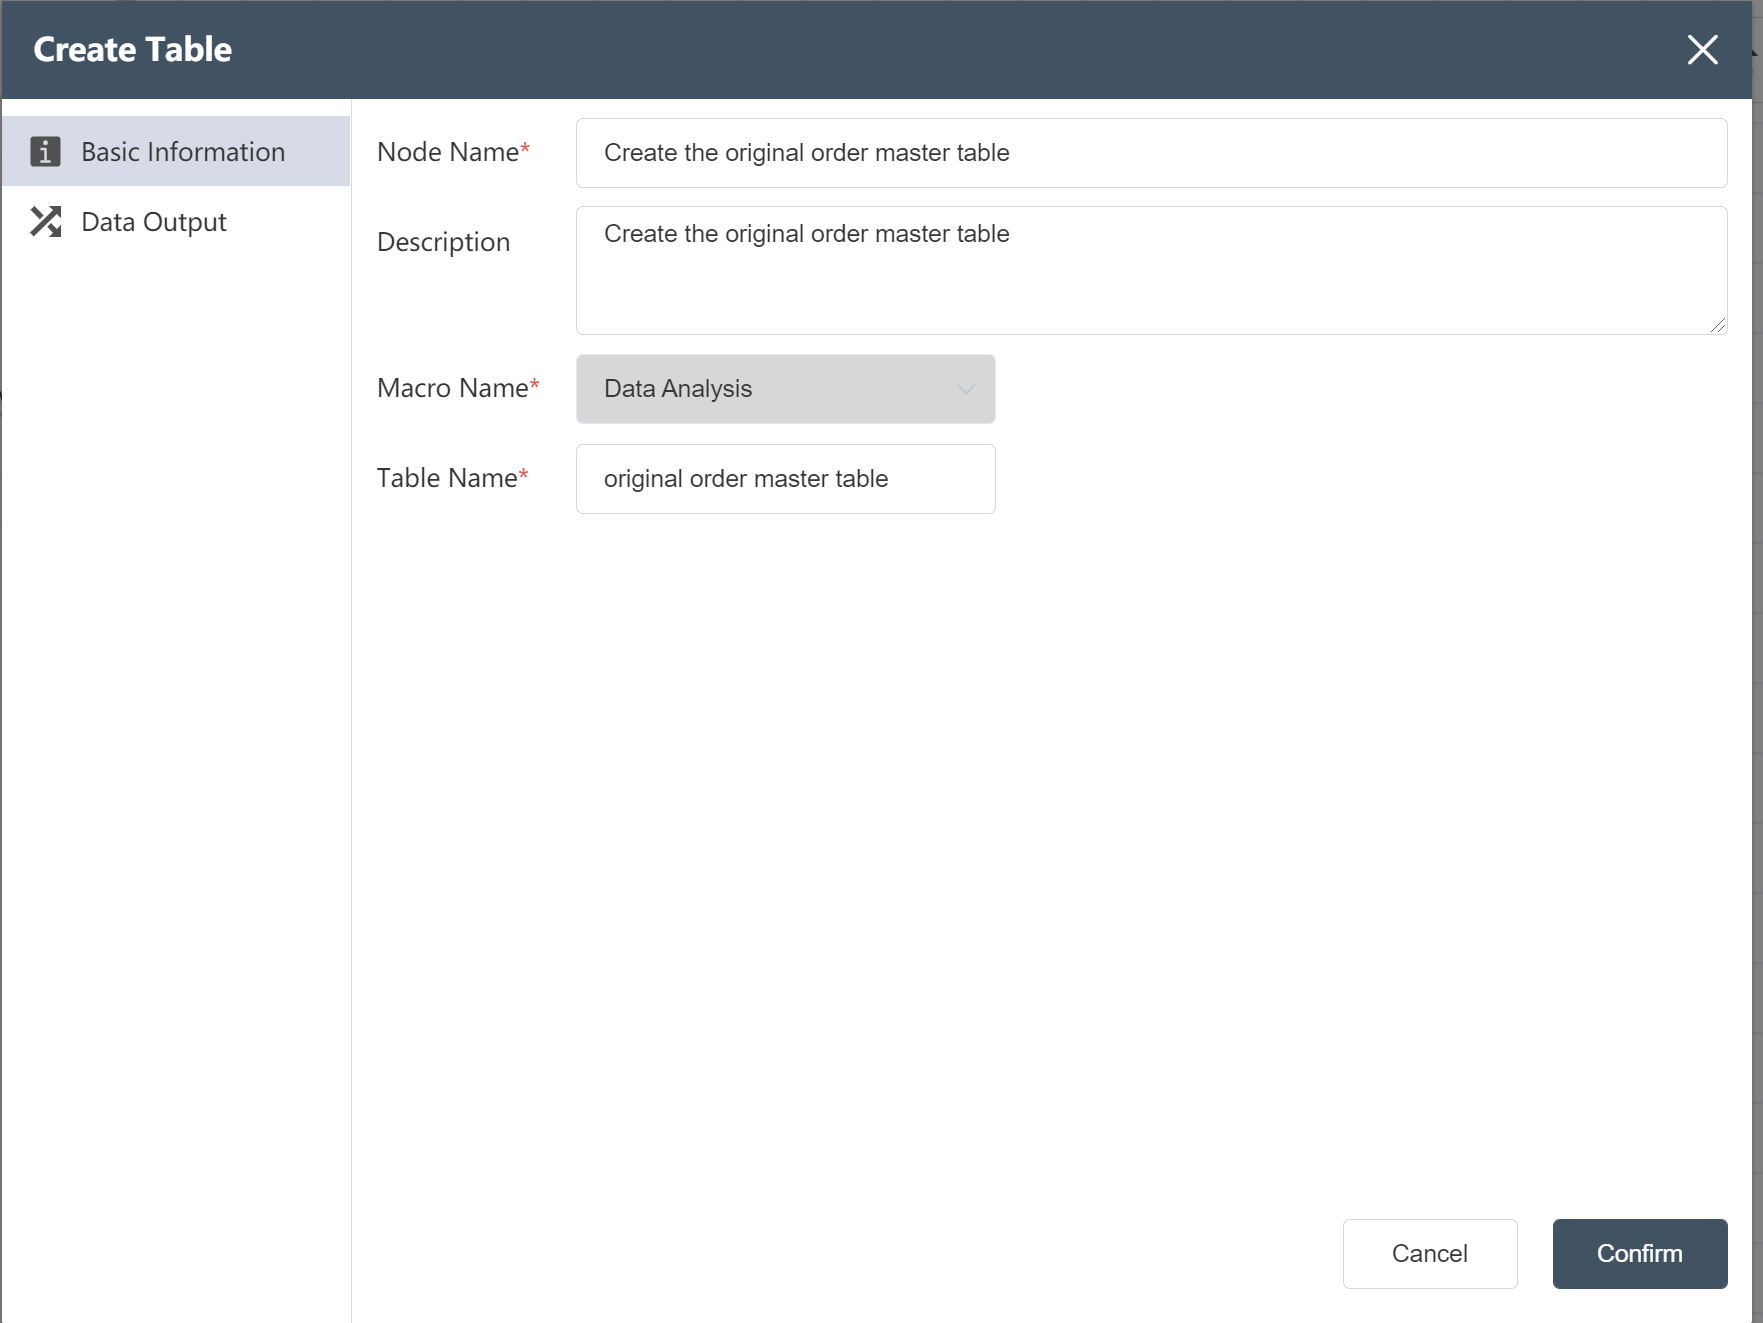
- Fill out the data output menu as shown below
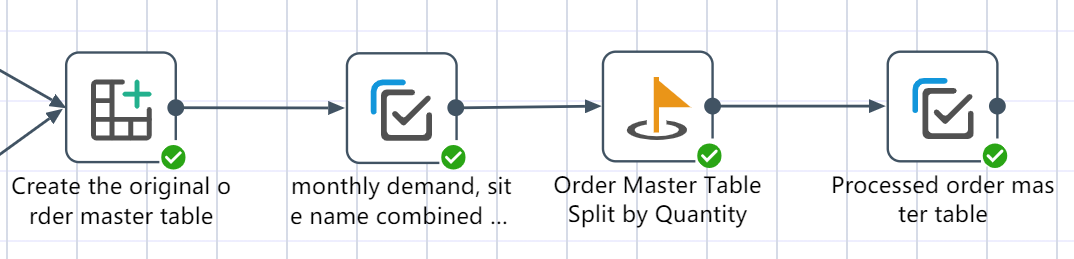
# Make order master table node construction
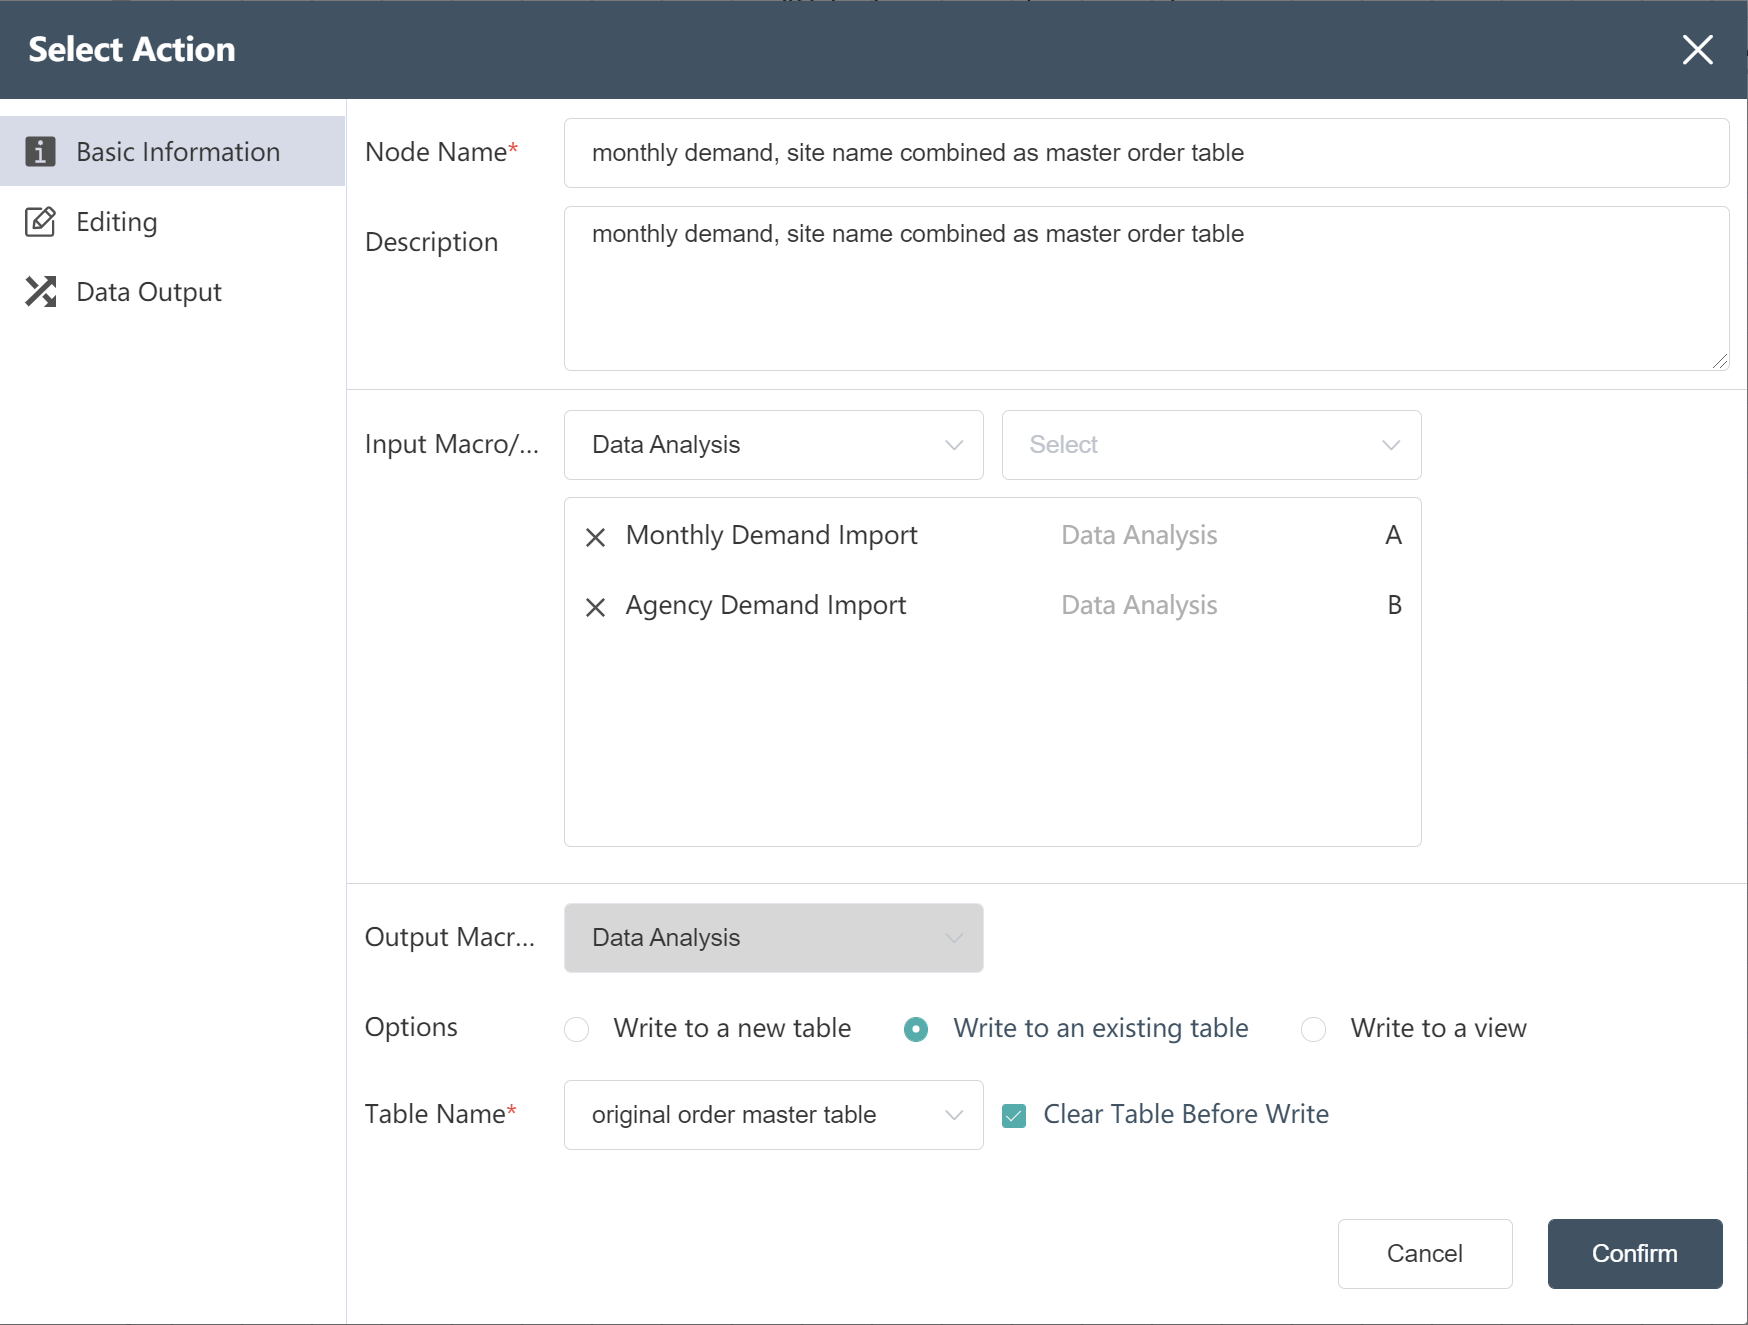
- New node: monthly demand, site name combined as master order table
- Fill in the basic information as shown below (note: write to the existing original order master table)
- Set the association table relationship in the data editing interface

- Select the fields to output from the input table in the data editing interface
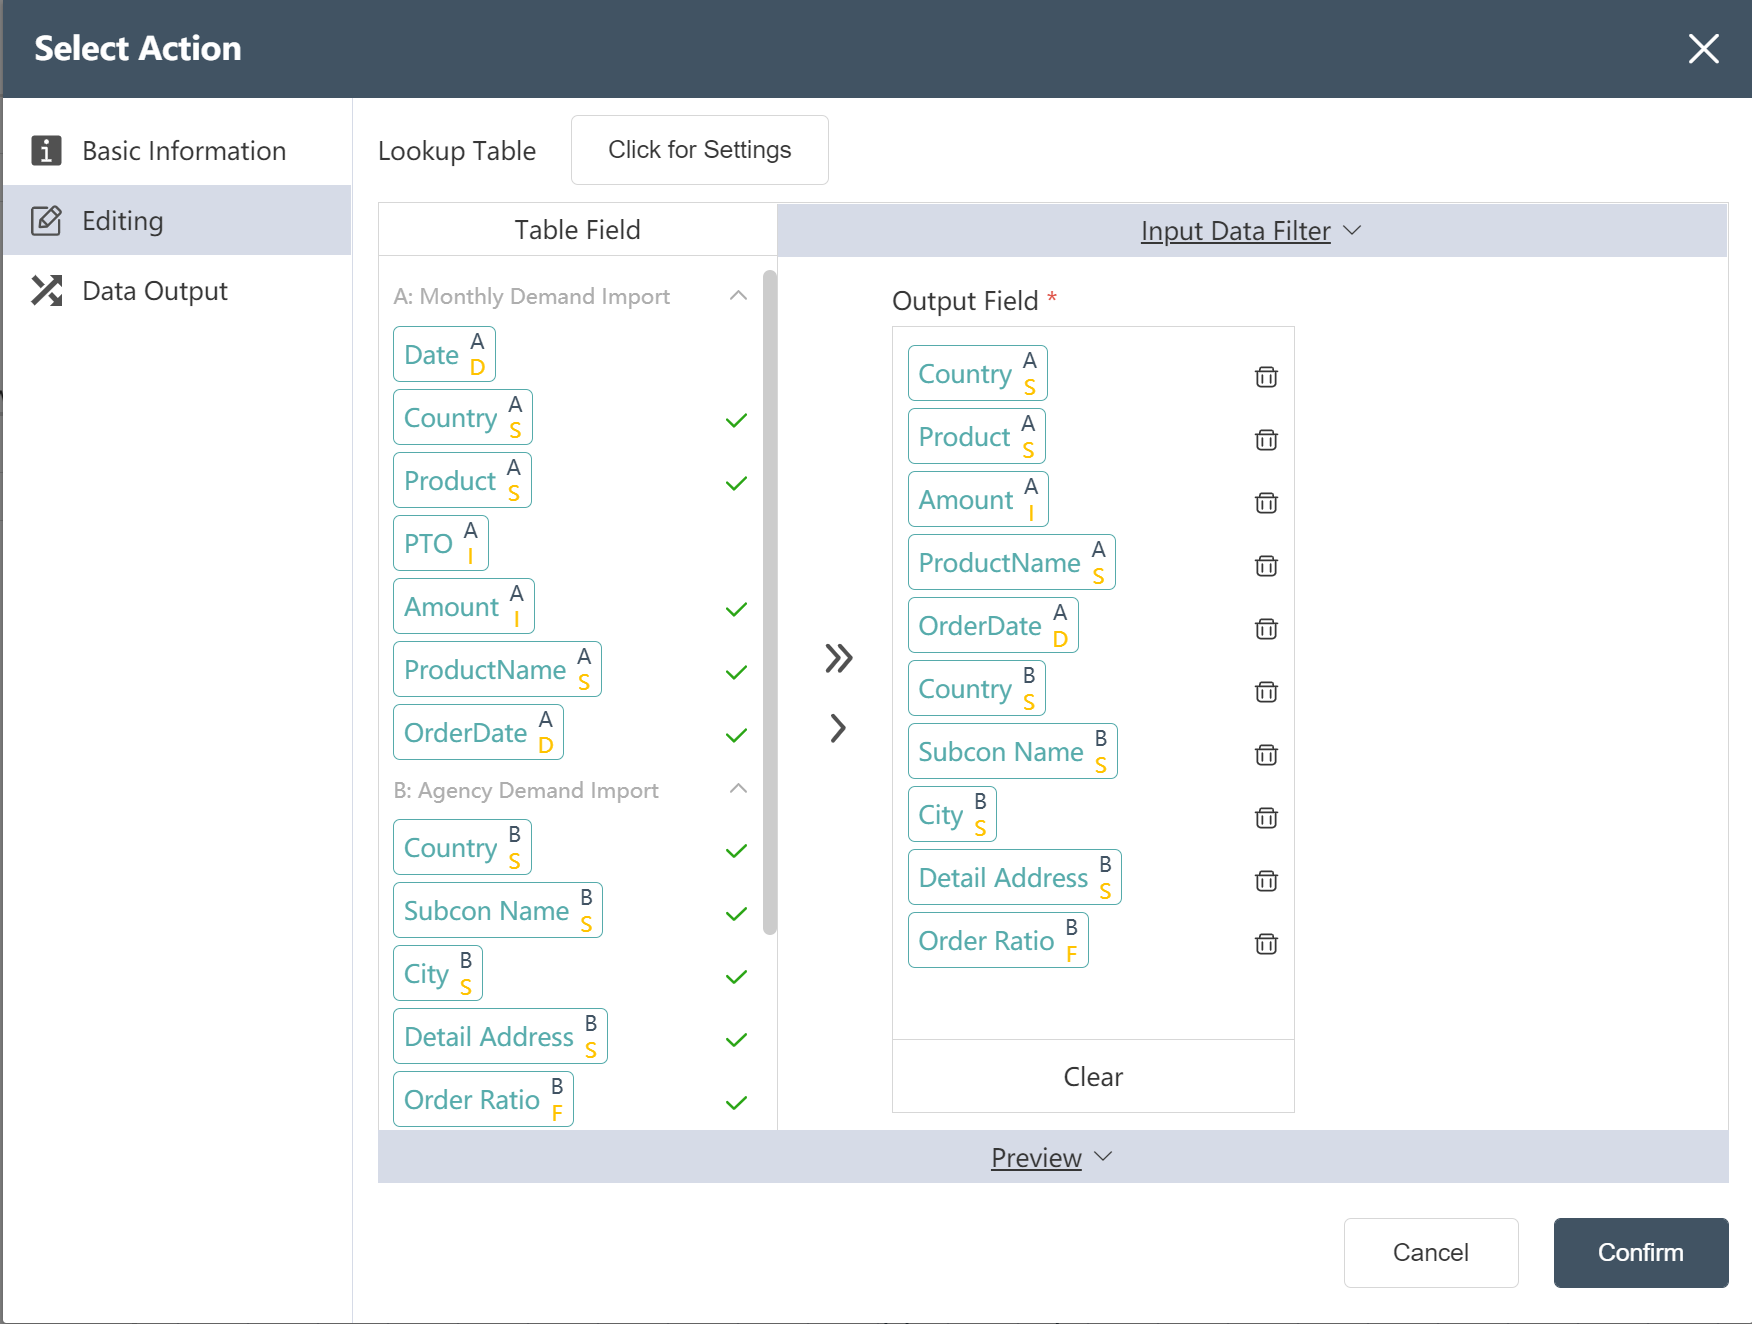
- Adjust the correspondence between the output data fields and the output table structure on the data output interface
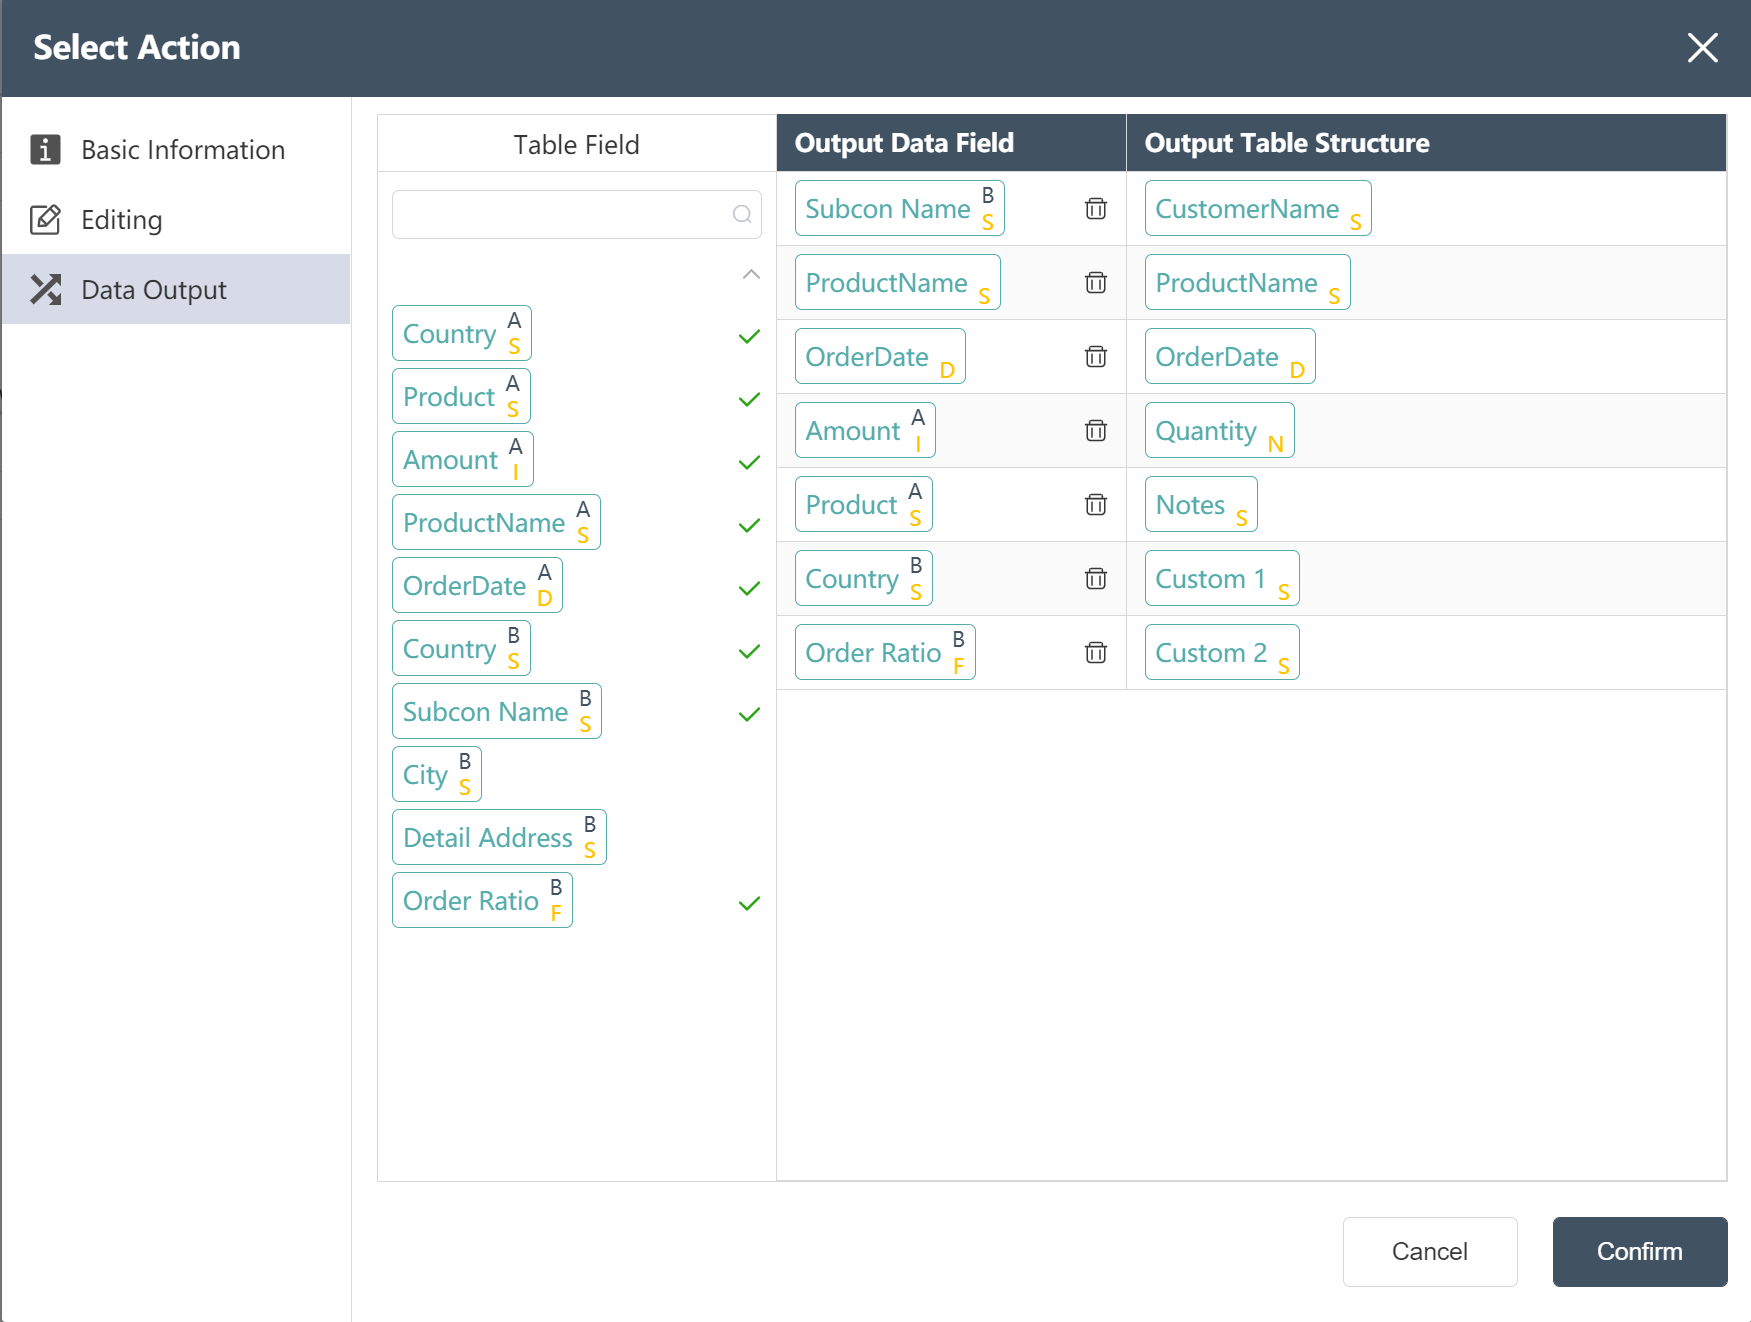
- Click to confirm, node: monthly demand, site name is written into the order master table and the construction is completed
- New Node: Order Master Table Split by Quantity
- In the data editing interface, assign a value to the quantity (the order quantity of each agency) according to the picture prompt (custom 2 is the proportion of the quantity)
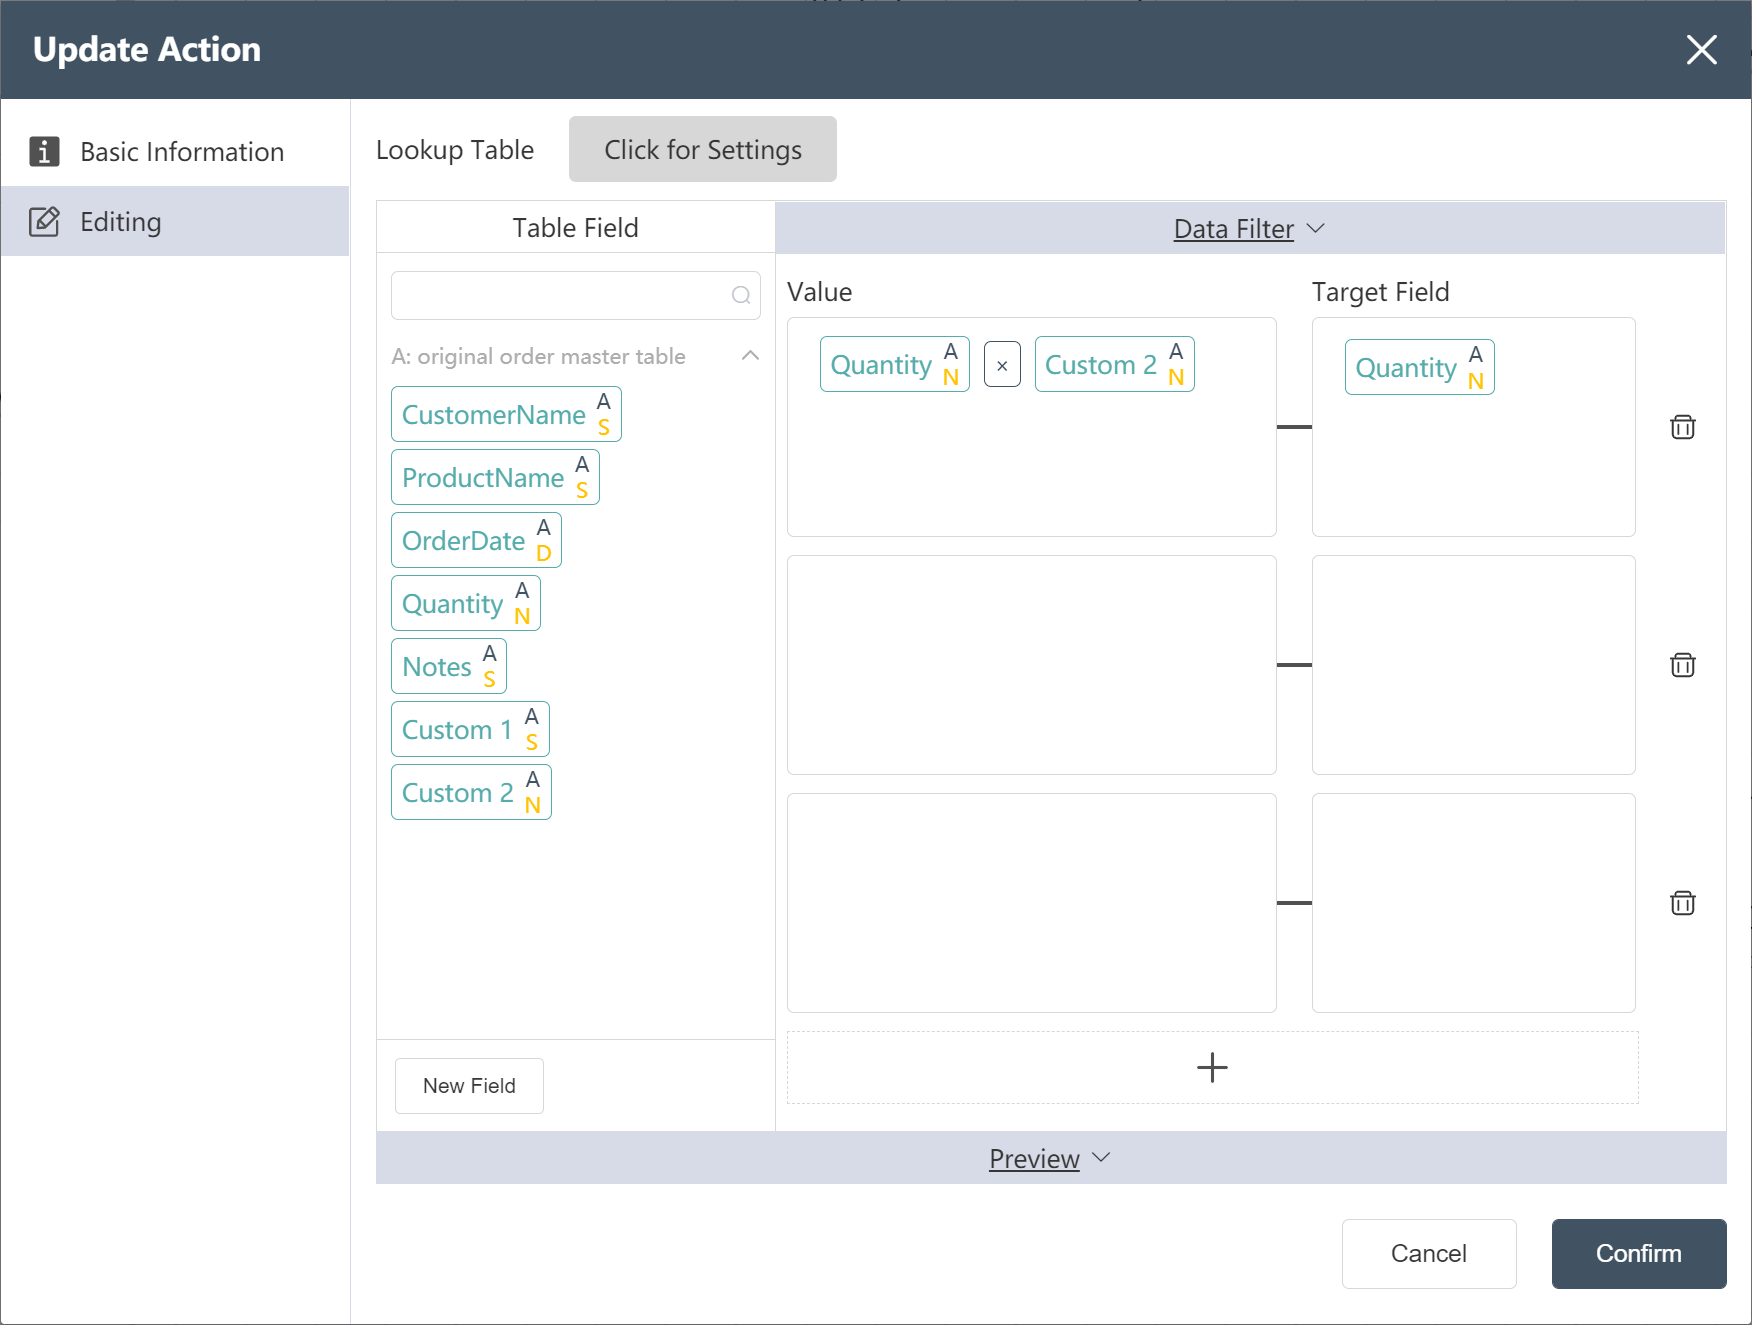
- Click Confirm, Node: Order Master Table Splits Quantity Construction Complete
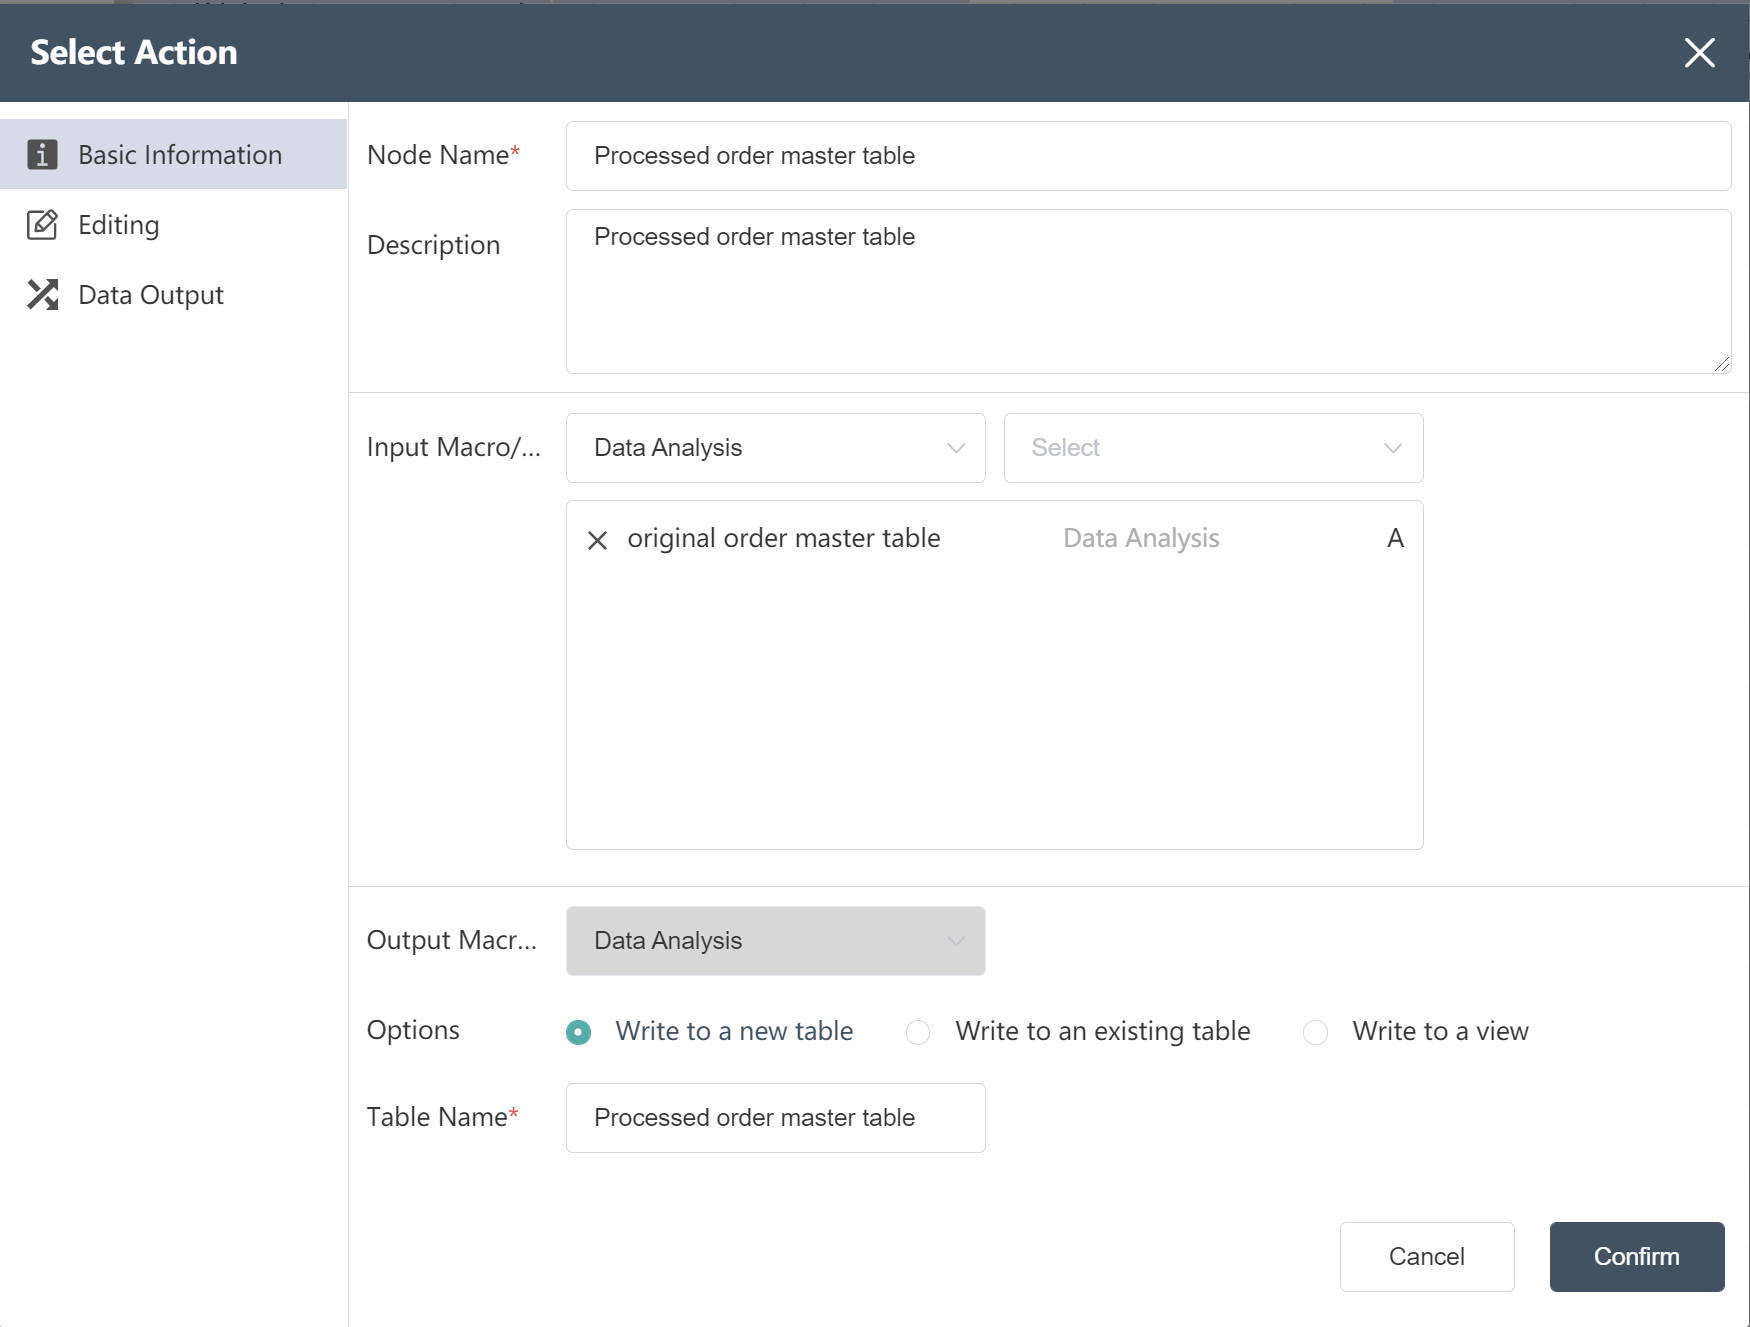
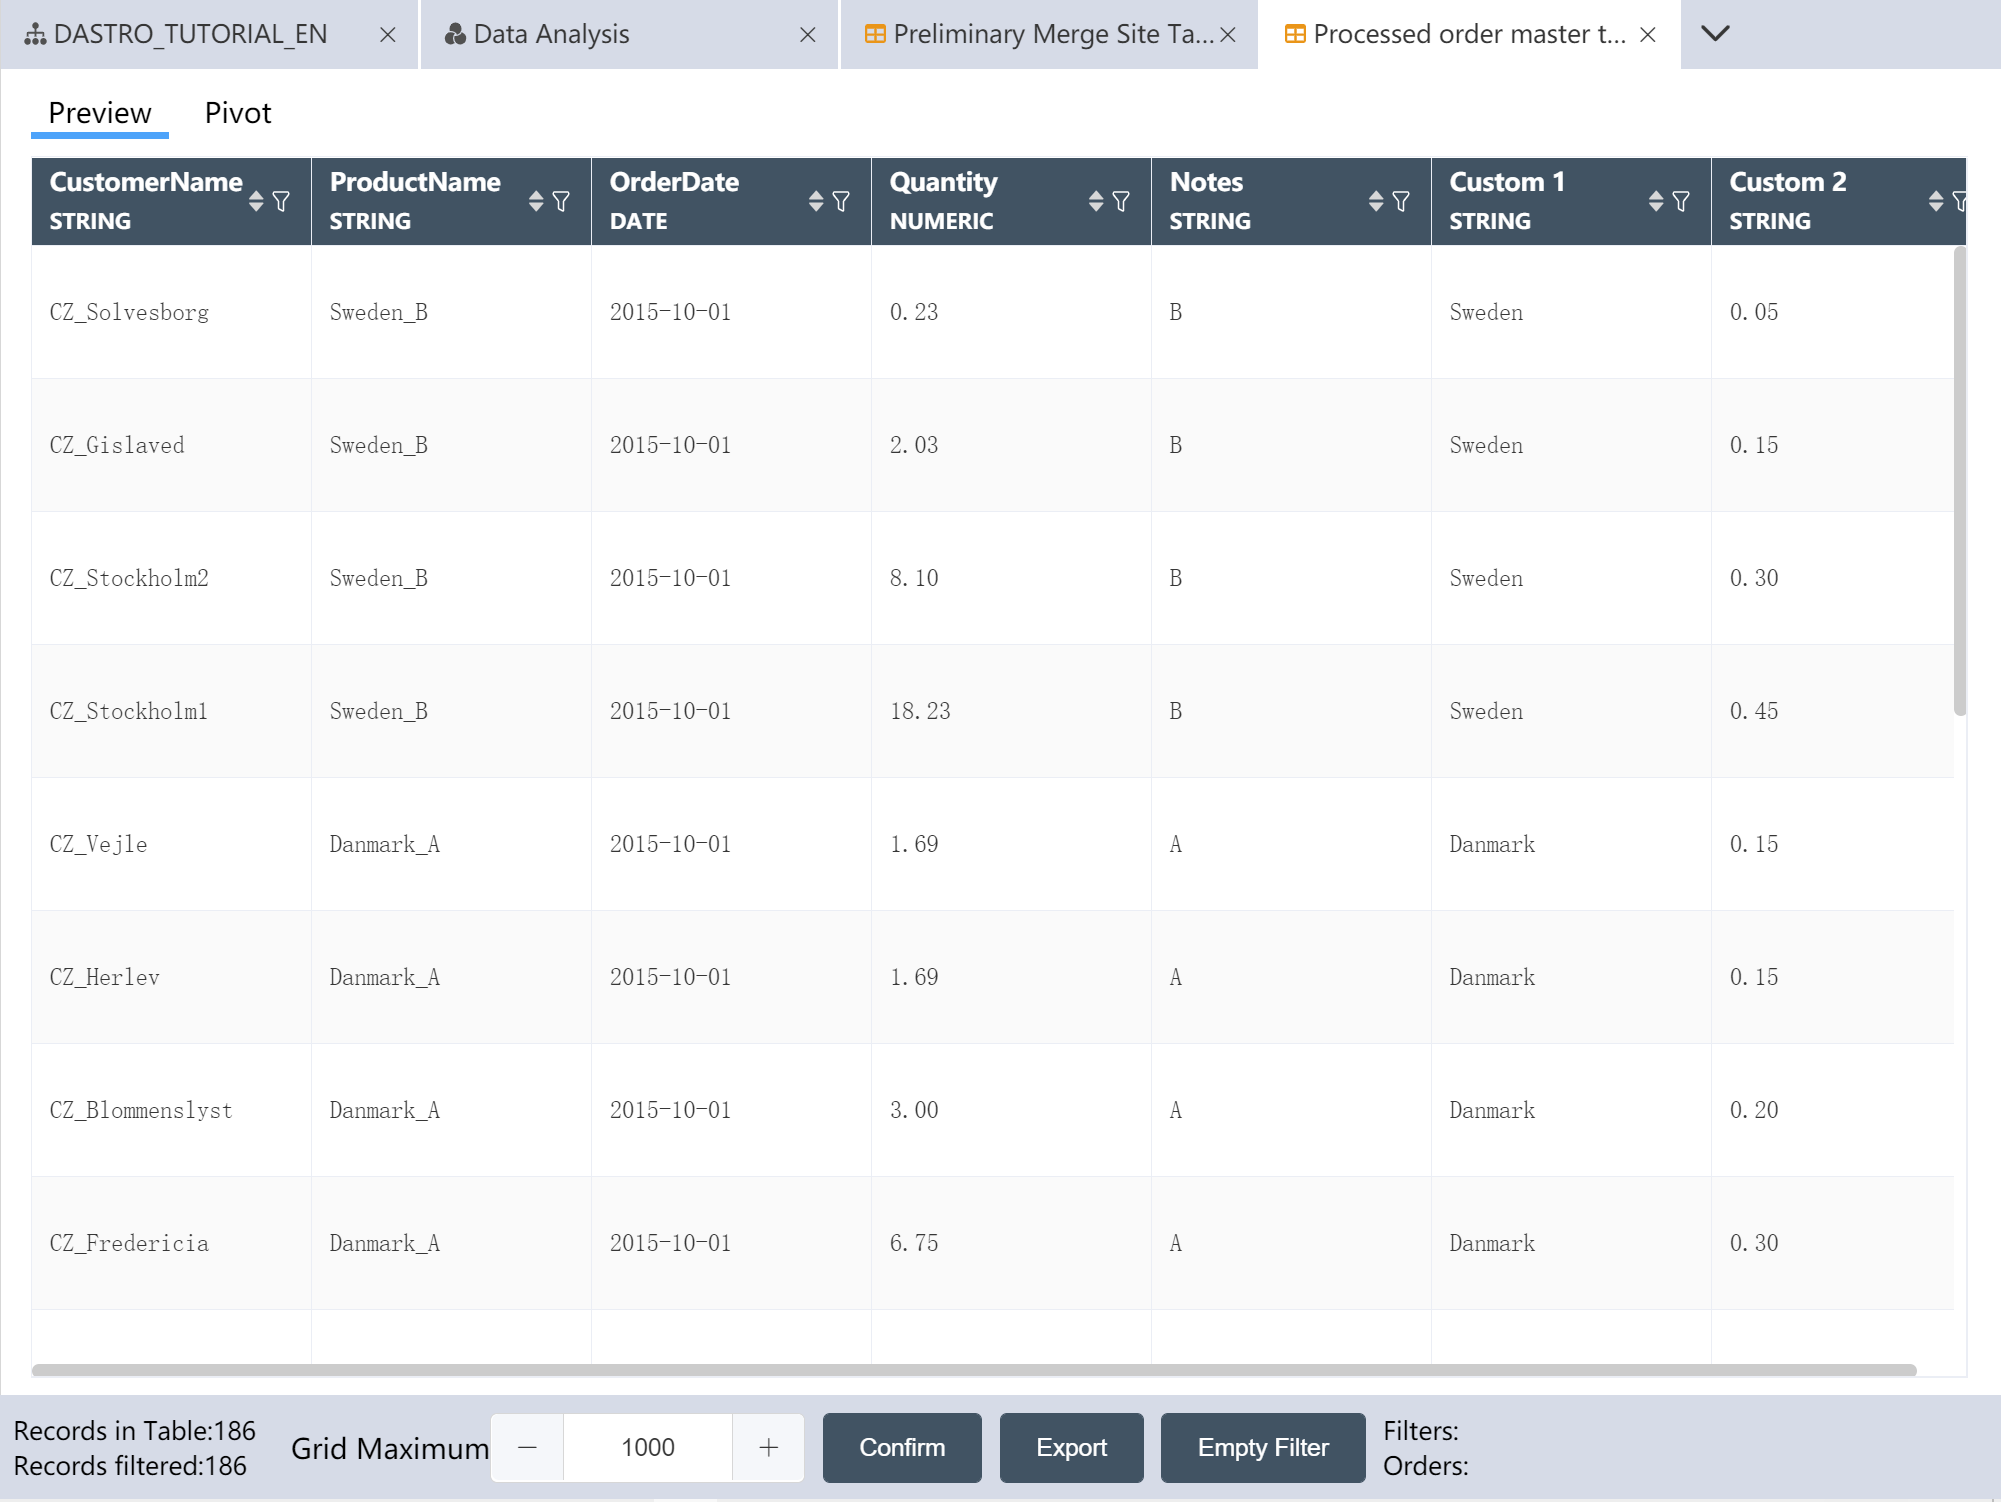
- New node: Processed order master table, and the processed data is written to the new table.
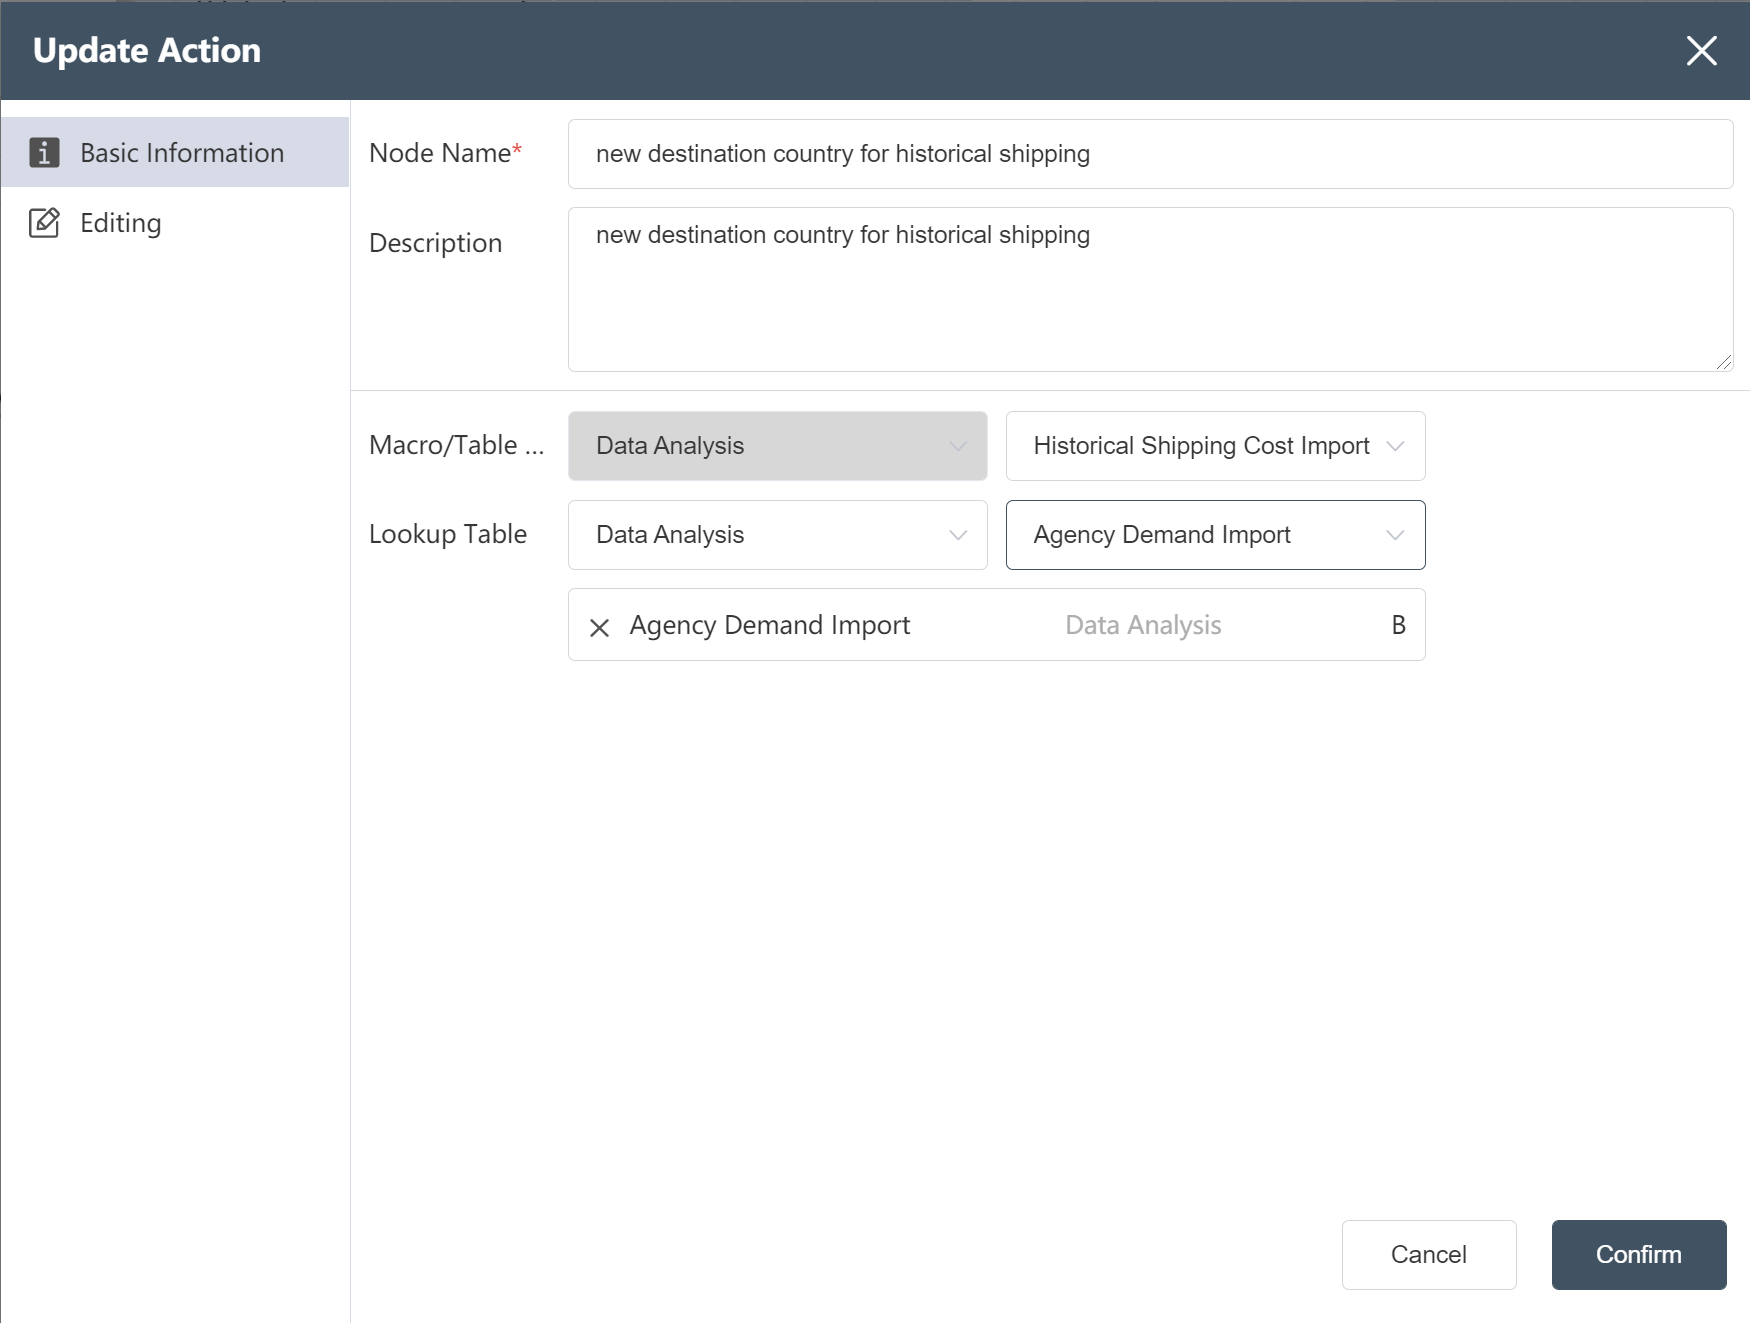
# New node: new destination country for historical shipping
Goal: Add country information for the destination to the traffic table
- Fill in the basic information according to the picture prompts (note: add a reference table)
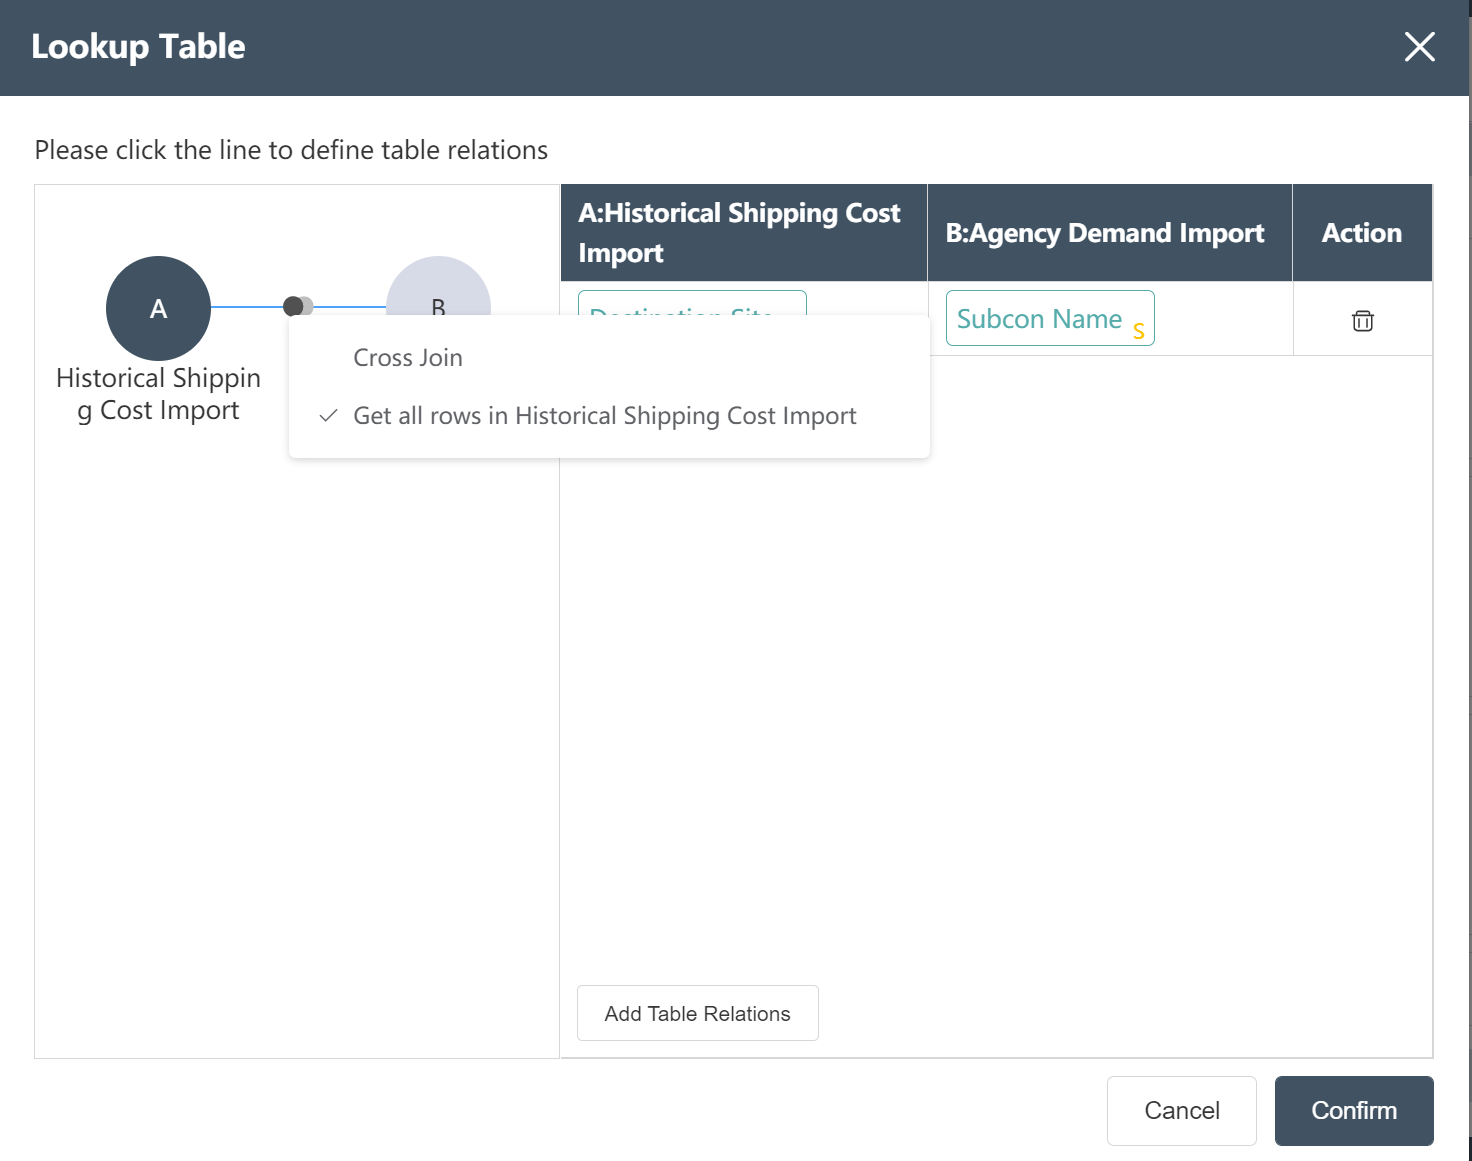
- Set the reference table association according to the picture prompt (Note: to set the association type)
- In the data editing menu, click on the new field, name it as the destination country, and drag the Country in the agency table into the assignment box.
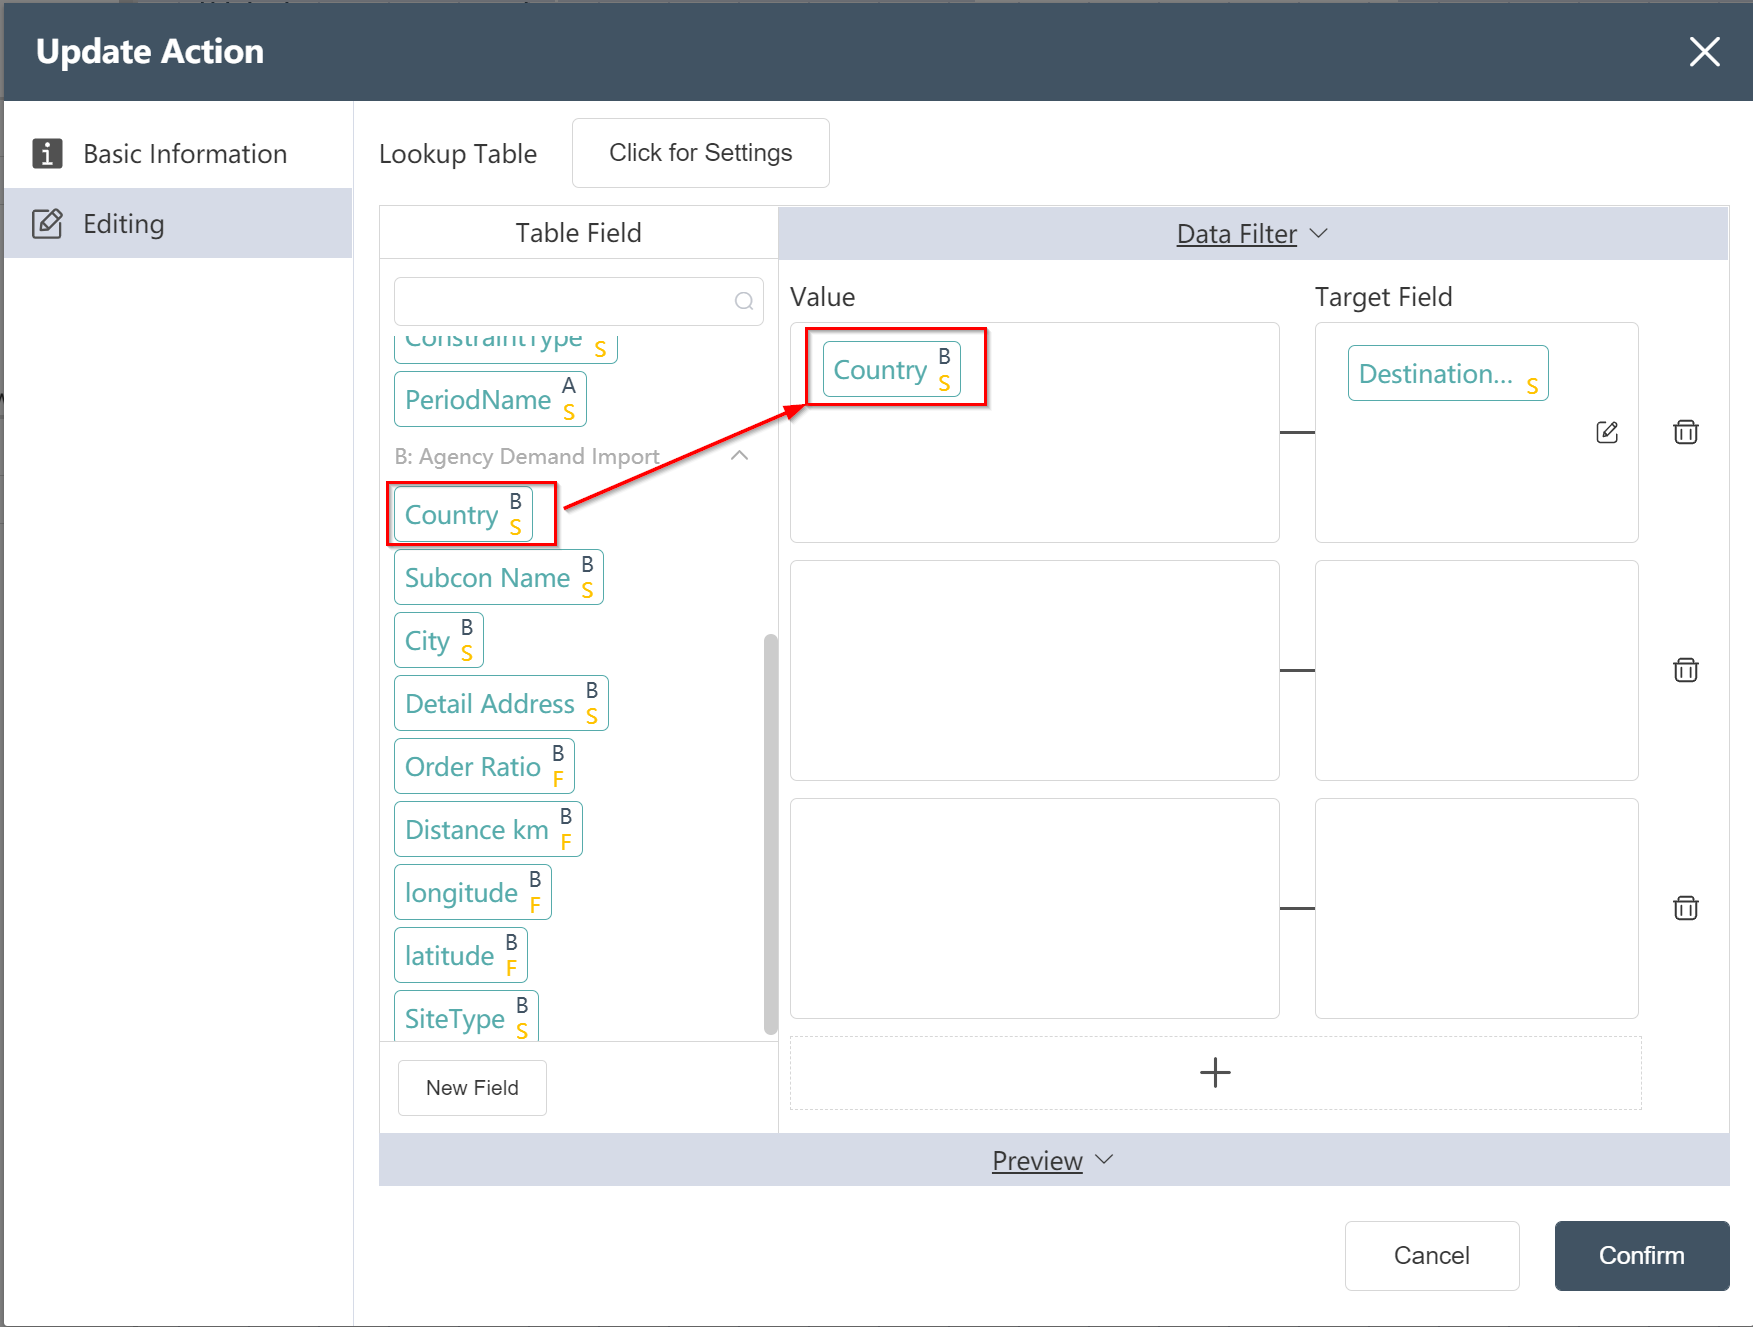
- Click to confirm, node: The new destination country of historical traffic volume has been established.
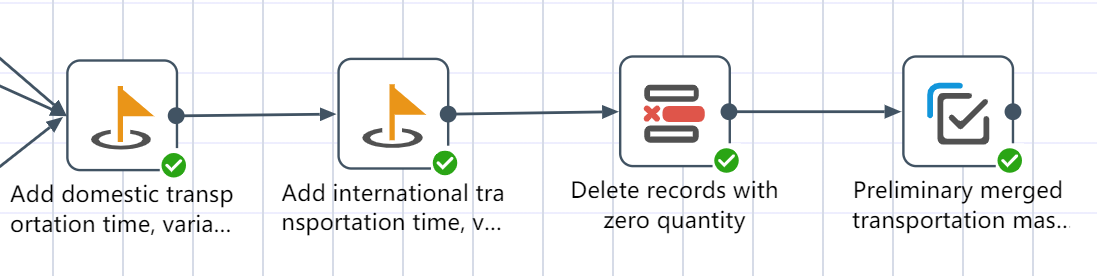
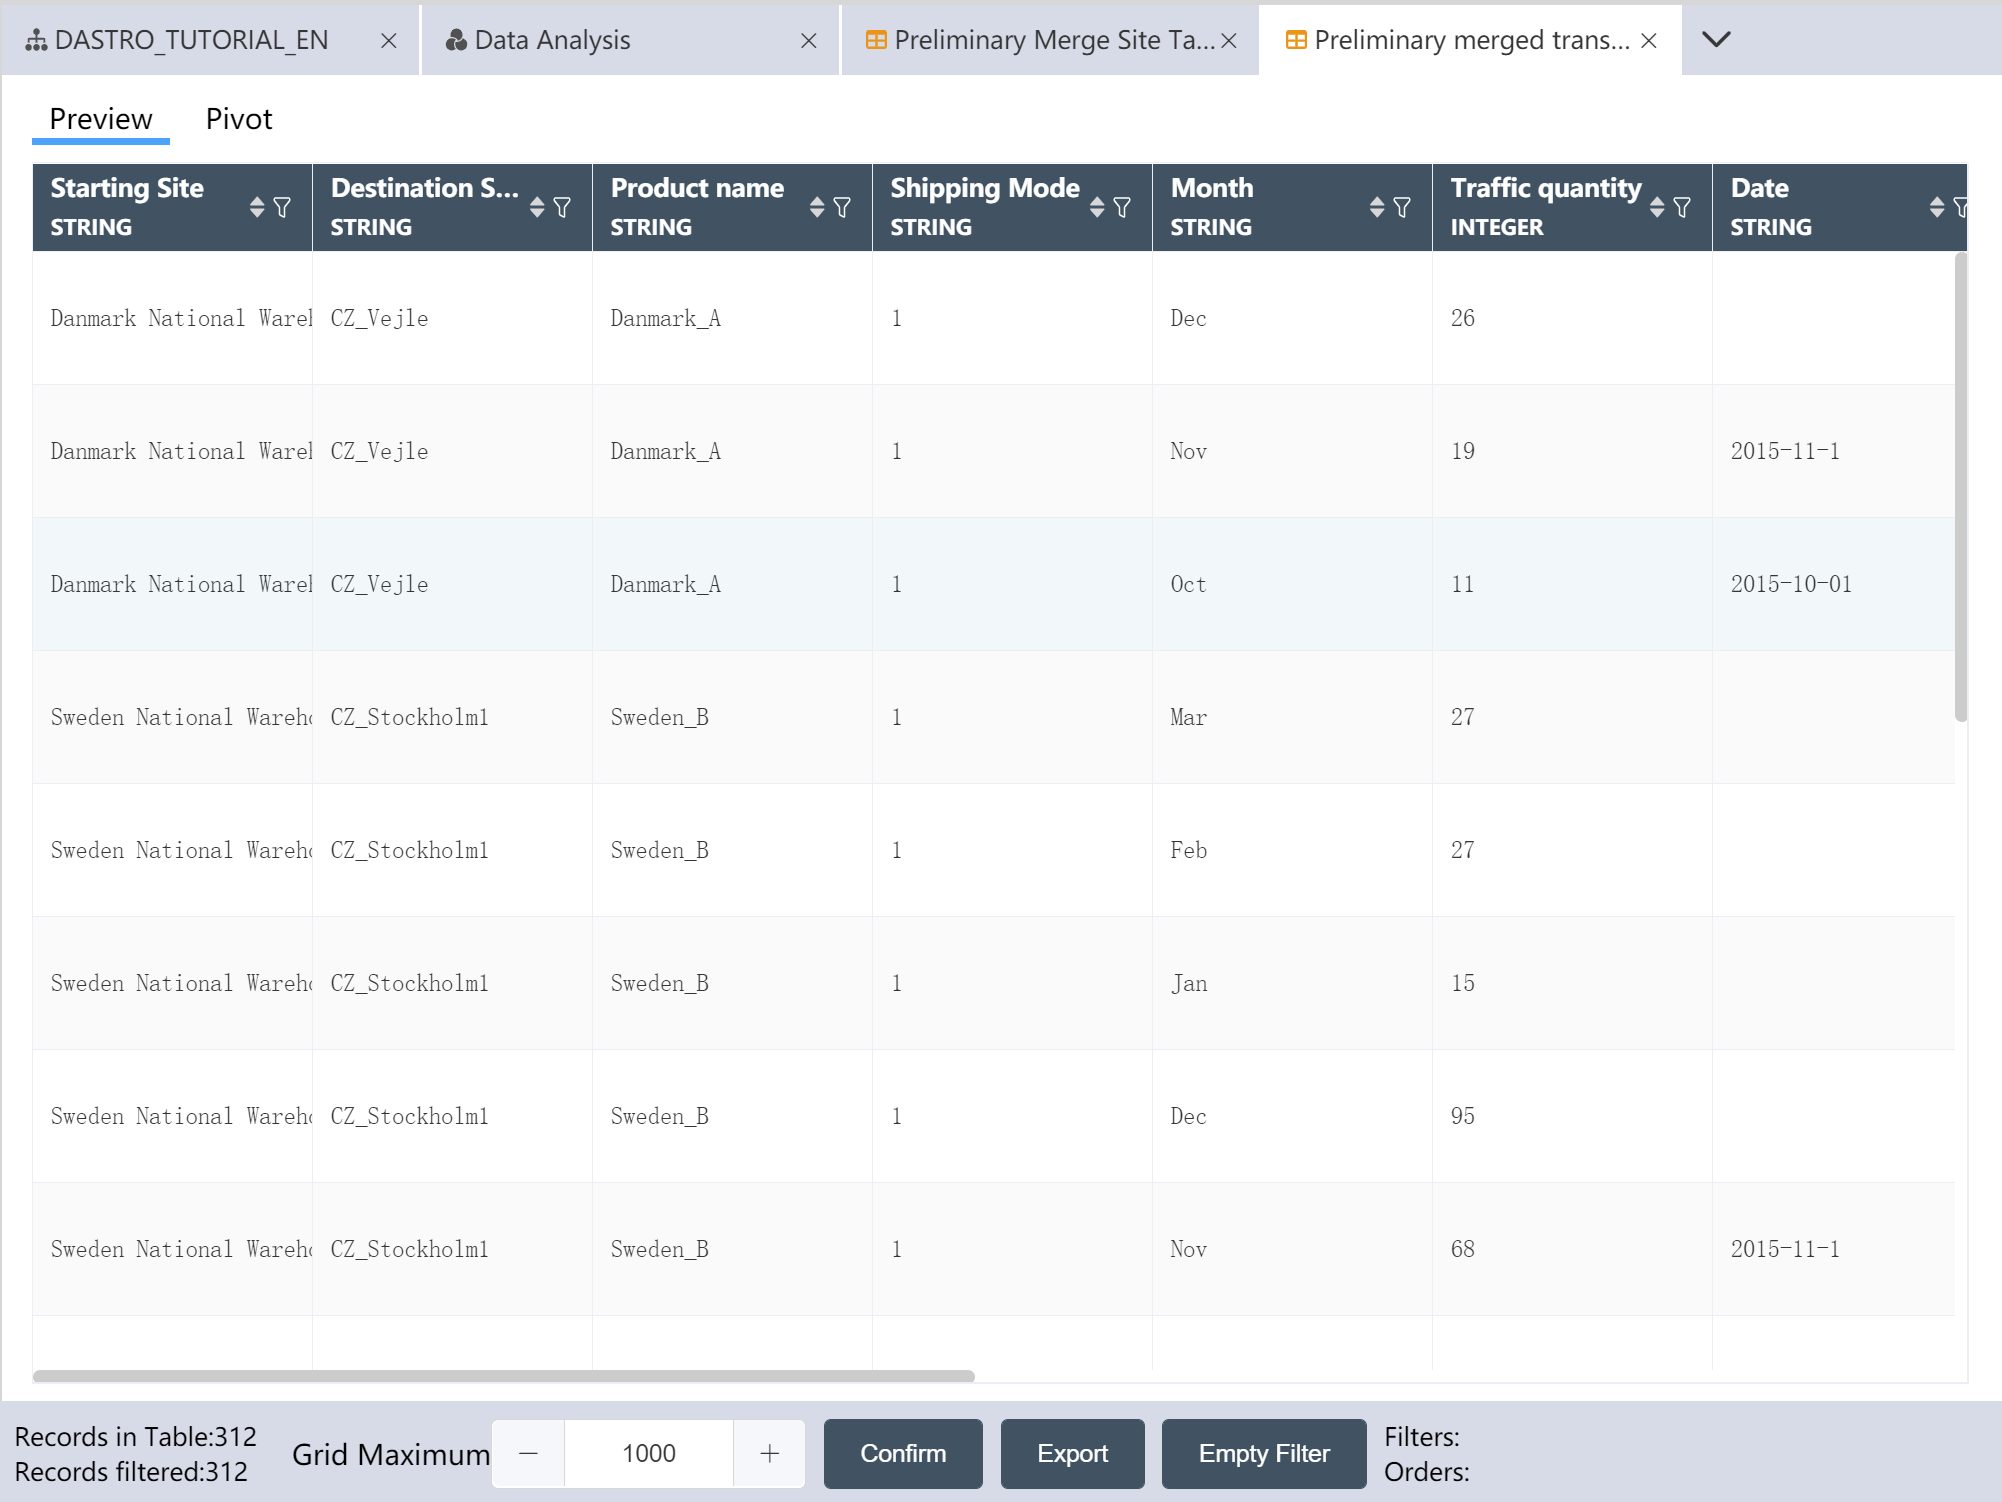
# Production volume master table node construction
Goal: Combining the international/local section freight rate table with the agency table and historical freight rate table, to create a freight rate table that is close to the SCATLAS® input table
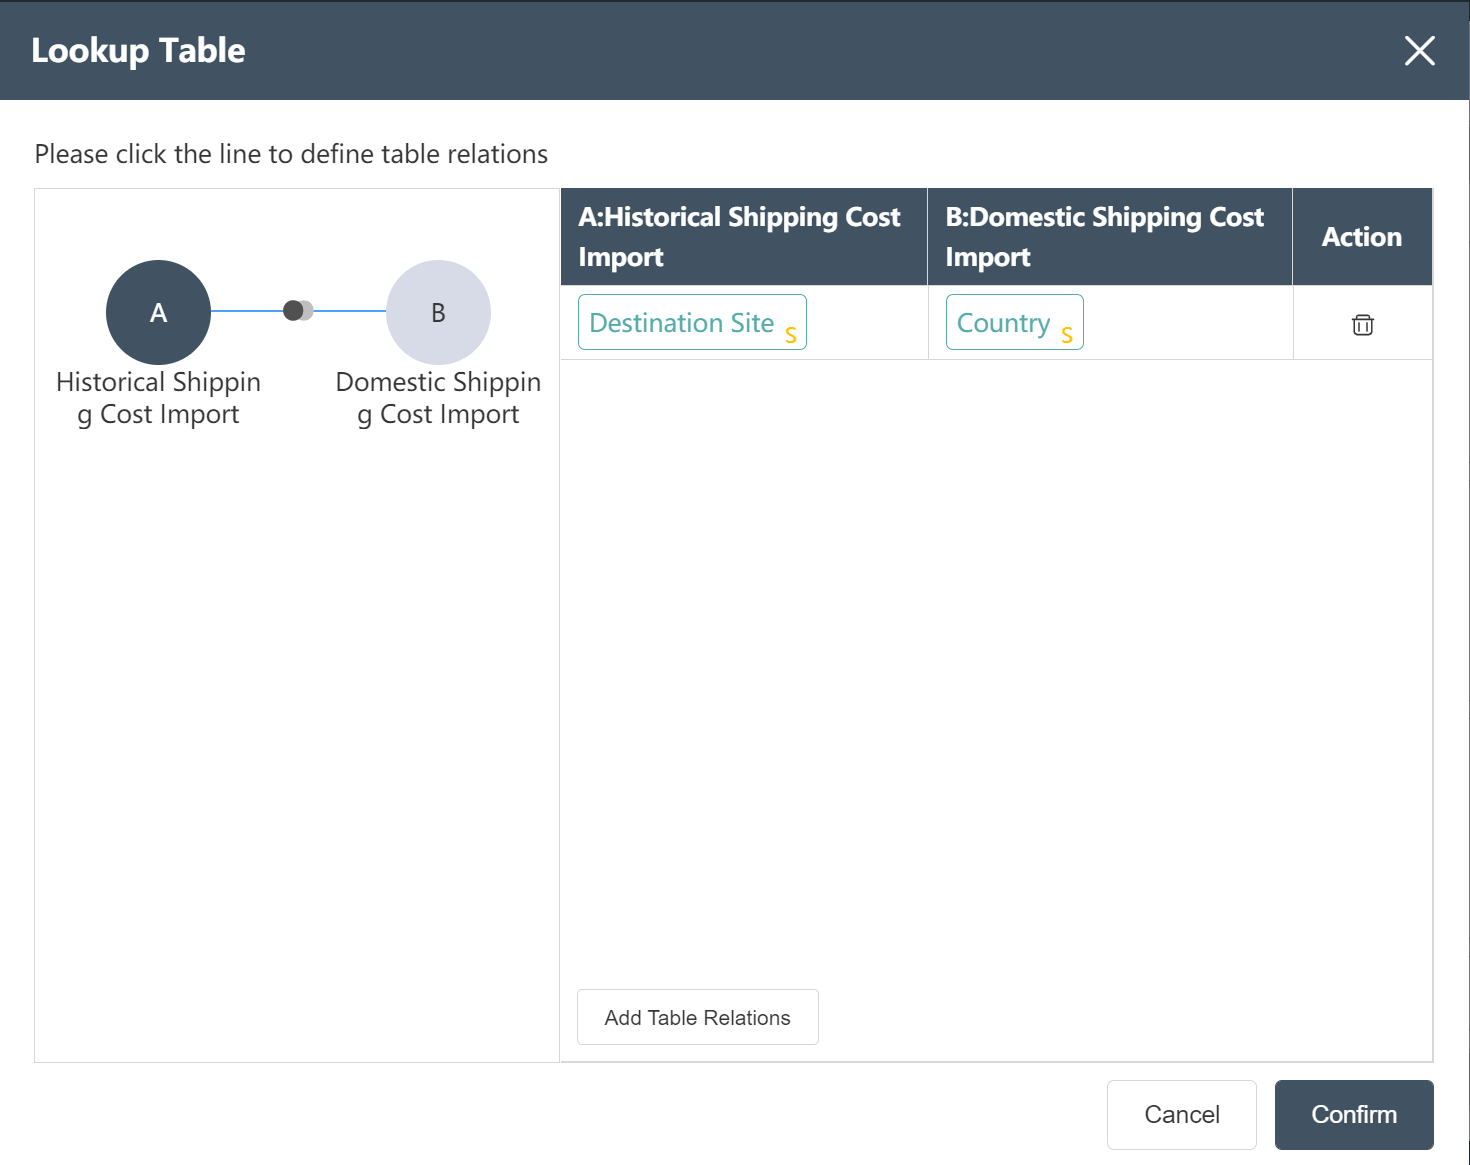
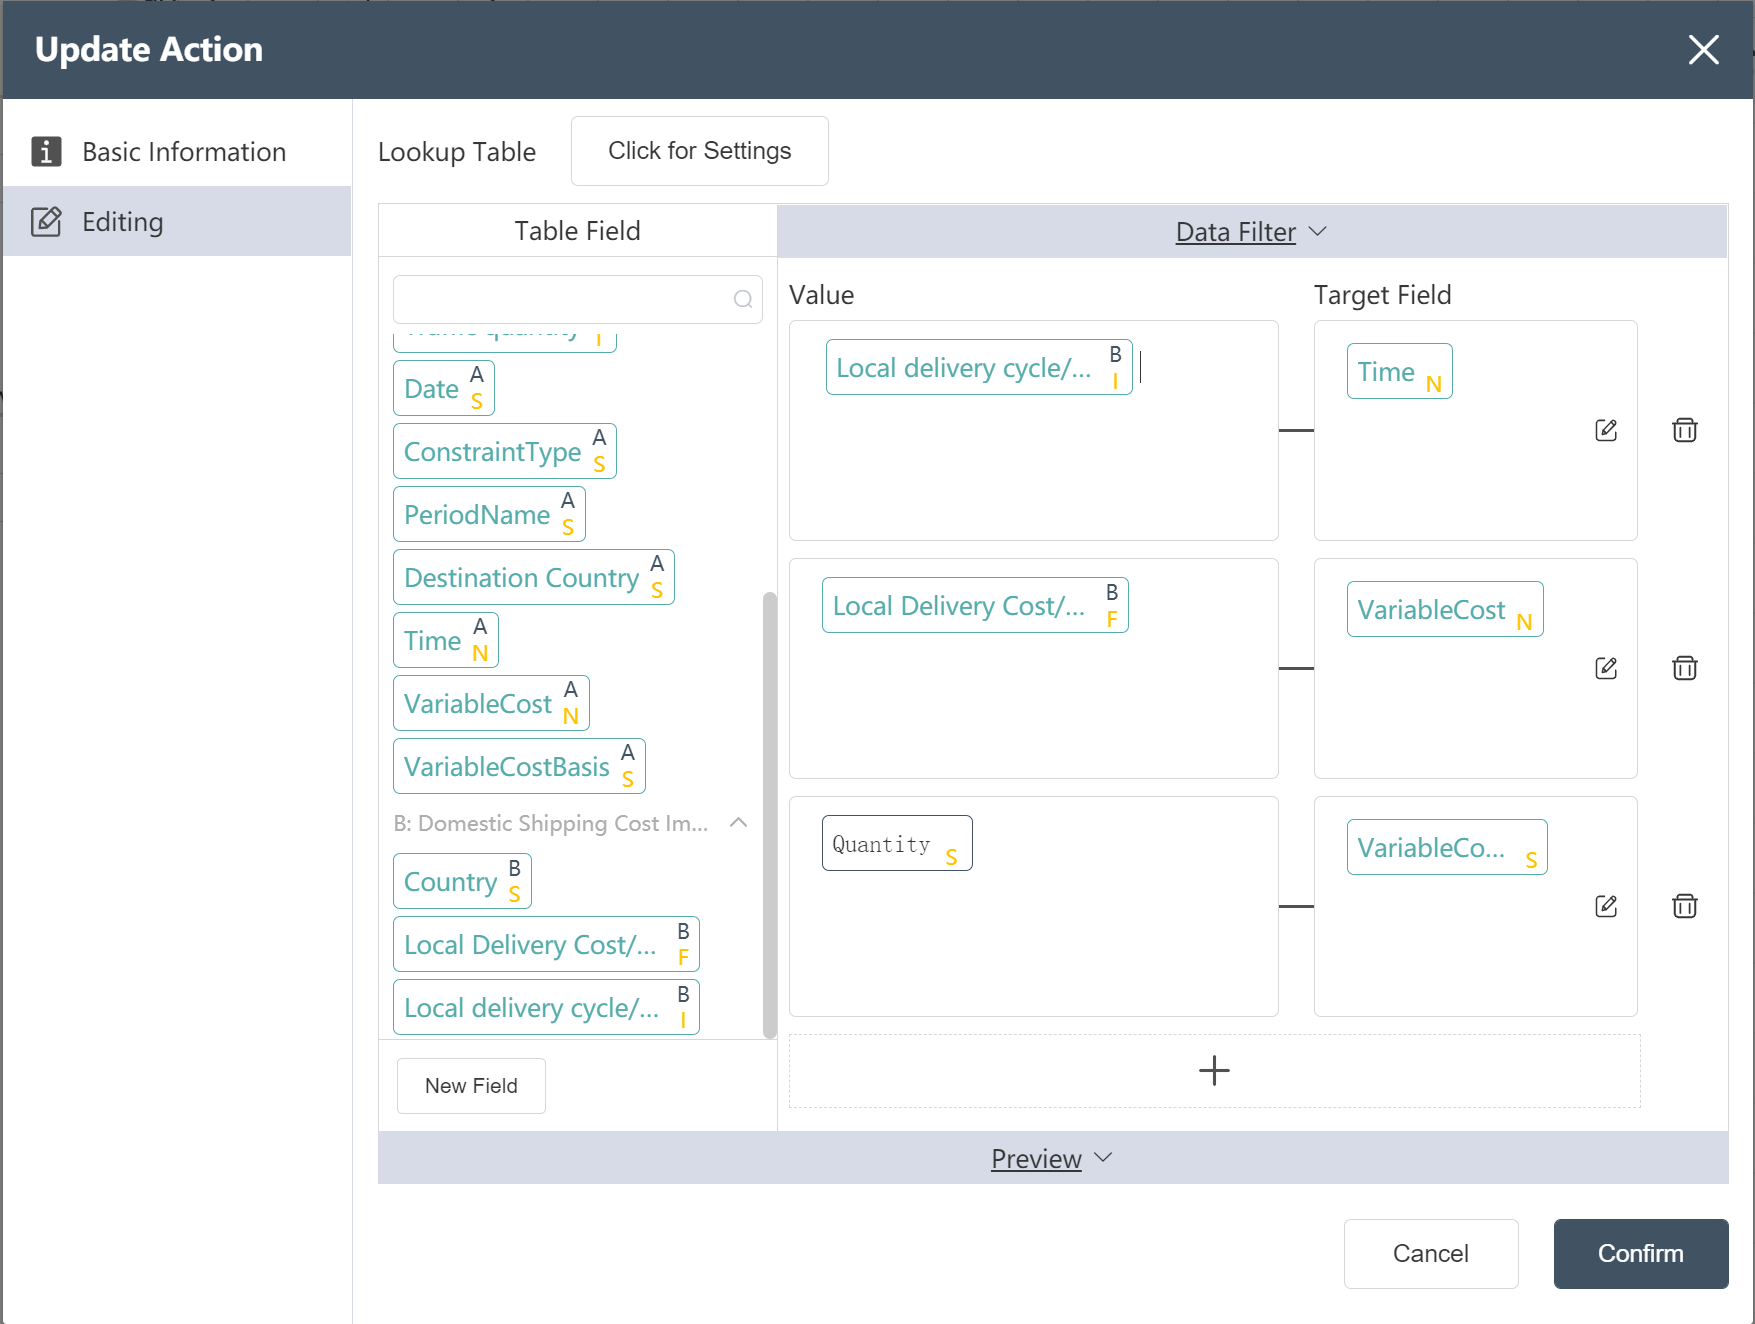
- Referring to the local freight rate table, add the fields of transportation days and transportation unit price to the local segment of the historical freight rate table as prompted, and set the variable cost basis as Quantity.
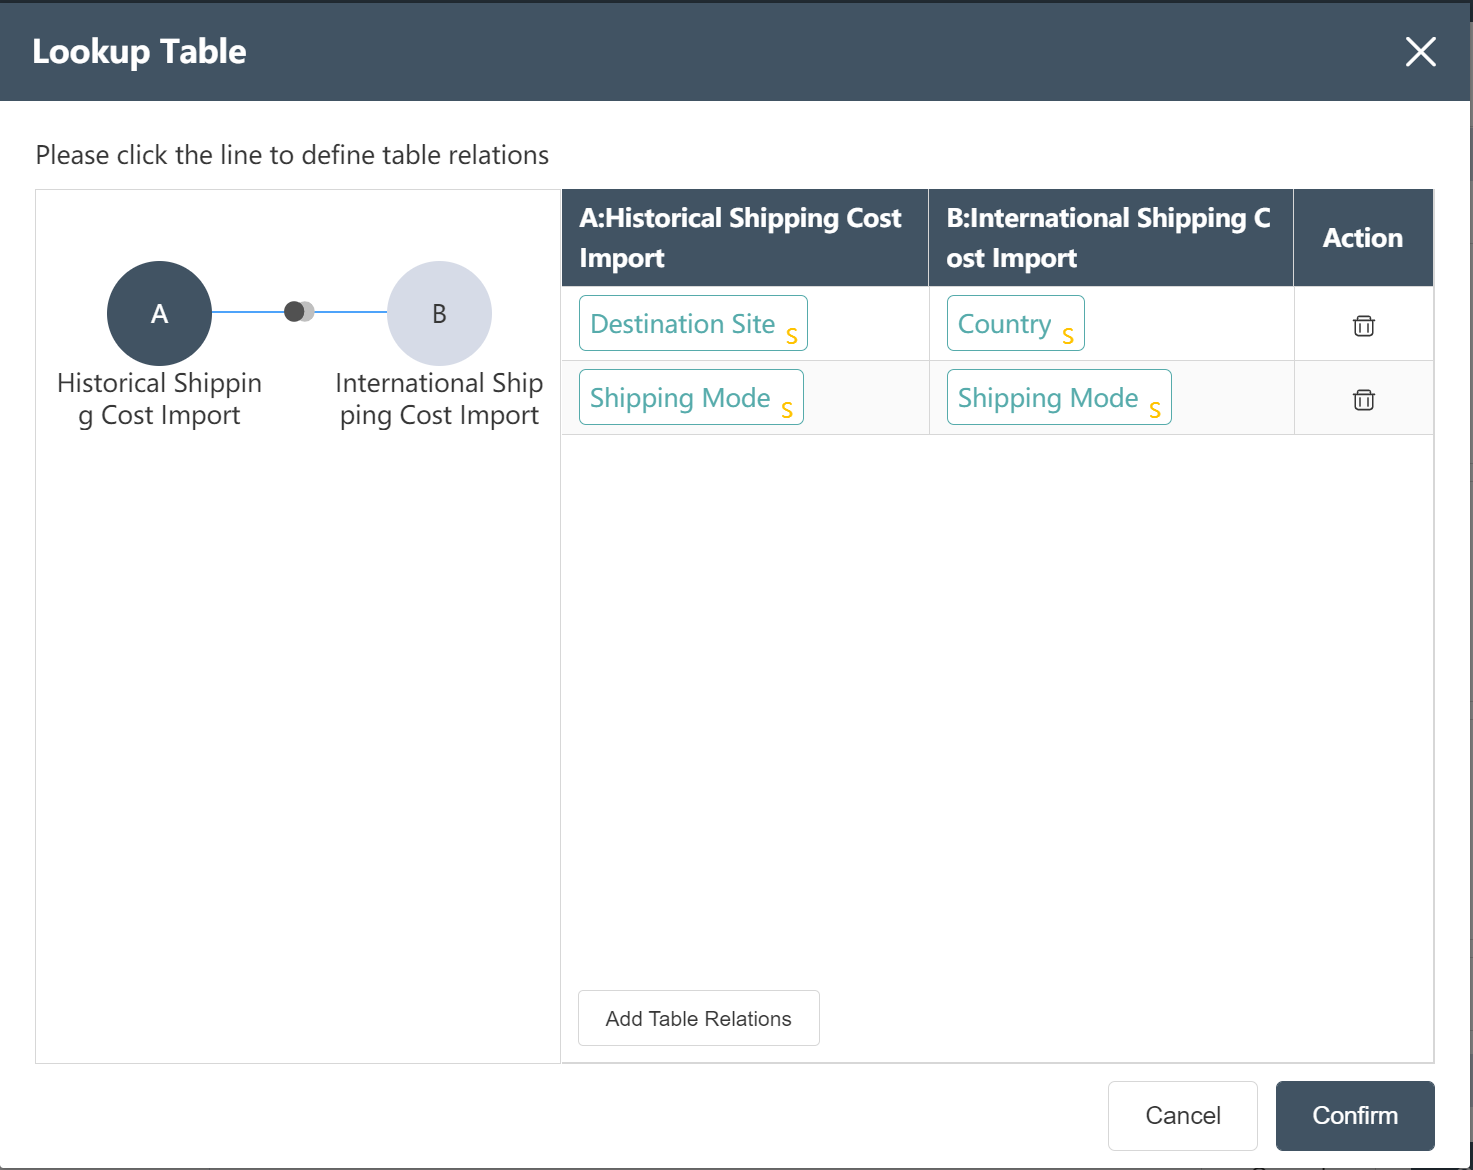
- Referring to the international freight rate table, add the fields of transportation days, transportation unit price, and variable cost basis for the international segment of the historical freight rate table according to the picture prompts.
- Write processed traffic data to a new table: Preliminary merged transportation master table

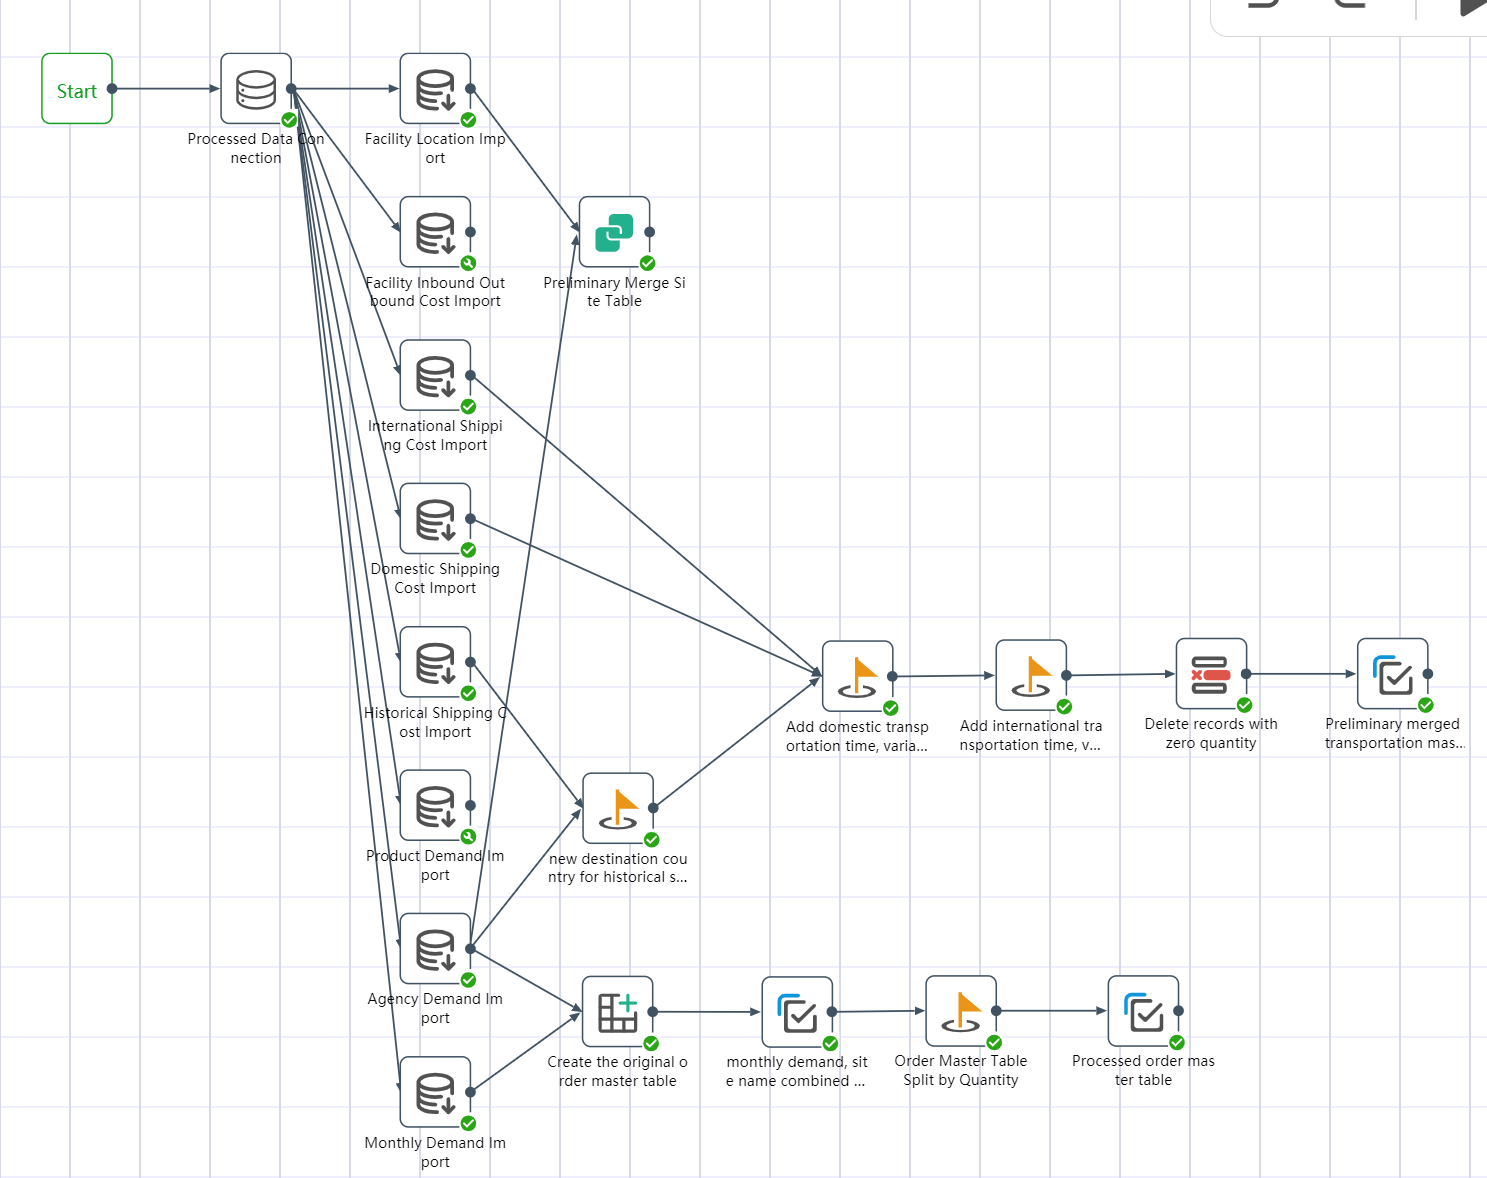
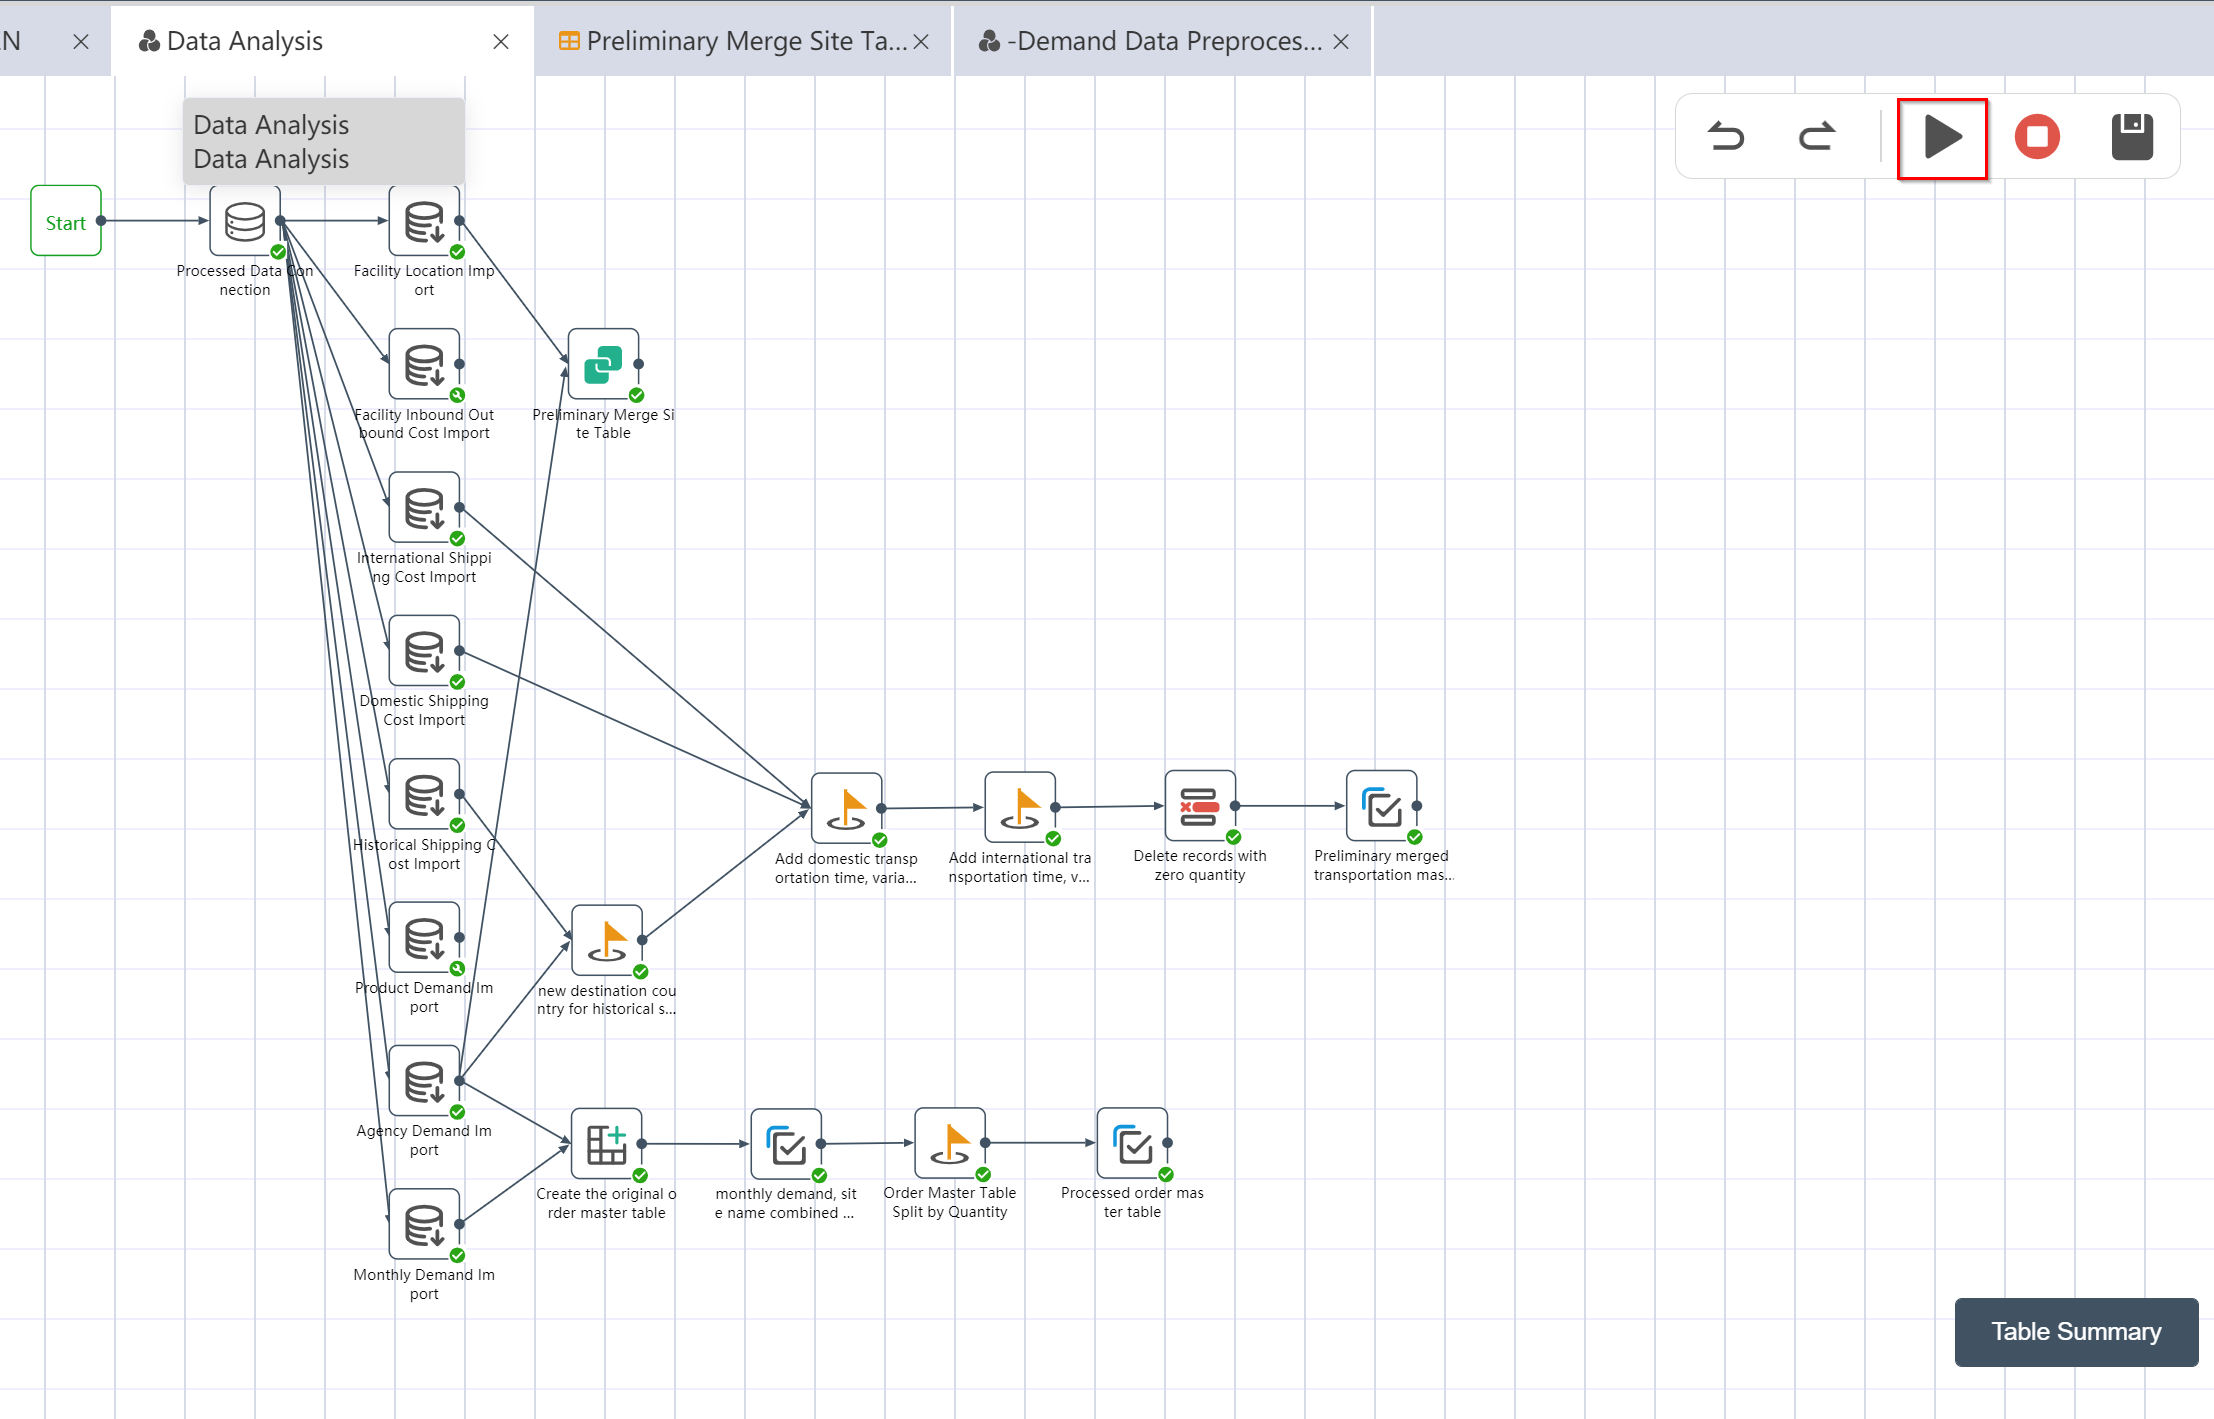
# Running Node Groups: Data Wrangling Analysis
- Connect according to the steps shown in the figure
- Click the Execute button in the upper right corner of the canvas
- Check the run results: - Data wrangling analysis
After the operation is completed, three output tables are obtained: the preliminary consolidated site table, the preliminary consolidated transportation volume master table, and the processed order master table.
Preliminary merge site table
Preliminary merged transportation Master Table
Processed orders master table
# Step 3: Data Export
Export the model input table to SCATLAS® in the Data Export node group in preparation for automatic modeling:
Connect and import the processed model input table; connect to SCATLAS®, enter account password and model information; export the model input table to SCATLAS®.
# Node Group 6: Data Export to SCATLAS®


After the node group is completed, you will get 2 input tables in the model element of SCATLAS®: product, site.
# Connect to the previous node group
- New node: After sorting out the data connection, select the connection table as shown in the figure below
- New node: SCATLAS® empty table connection, select the connection table as shown below

# Import the data table of the previous node group
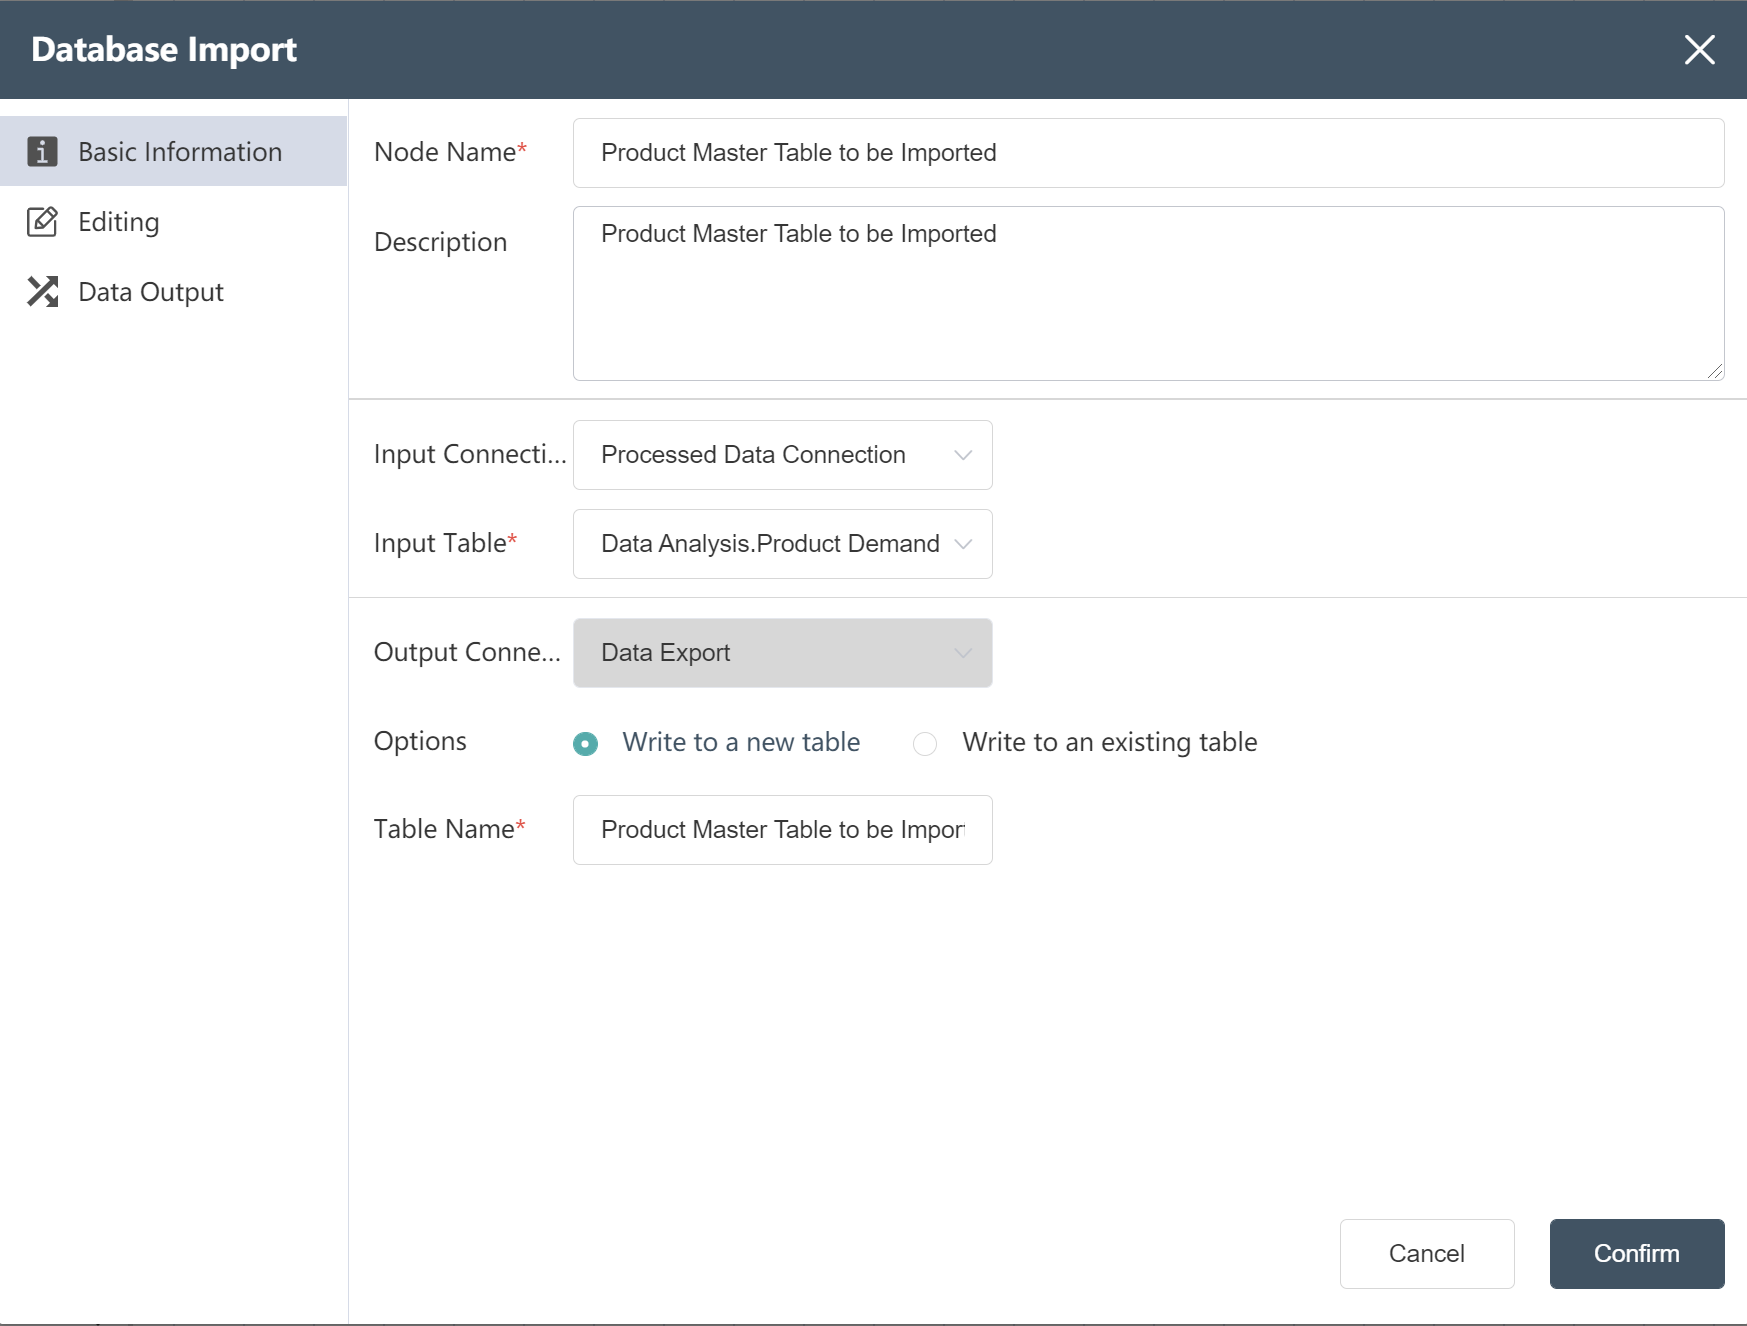
- Import "Product Master Table Import" in the node group "-Data Processing Analysis", fill in according to the picture prompts
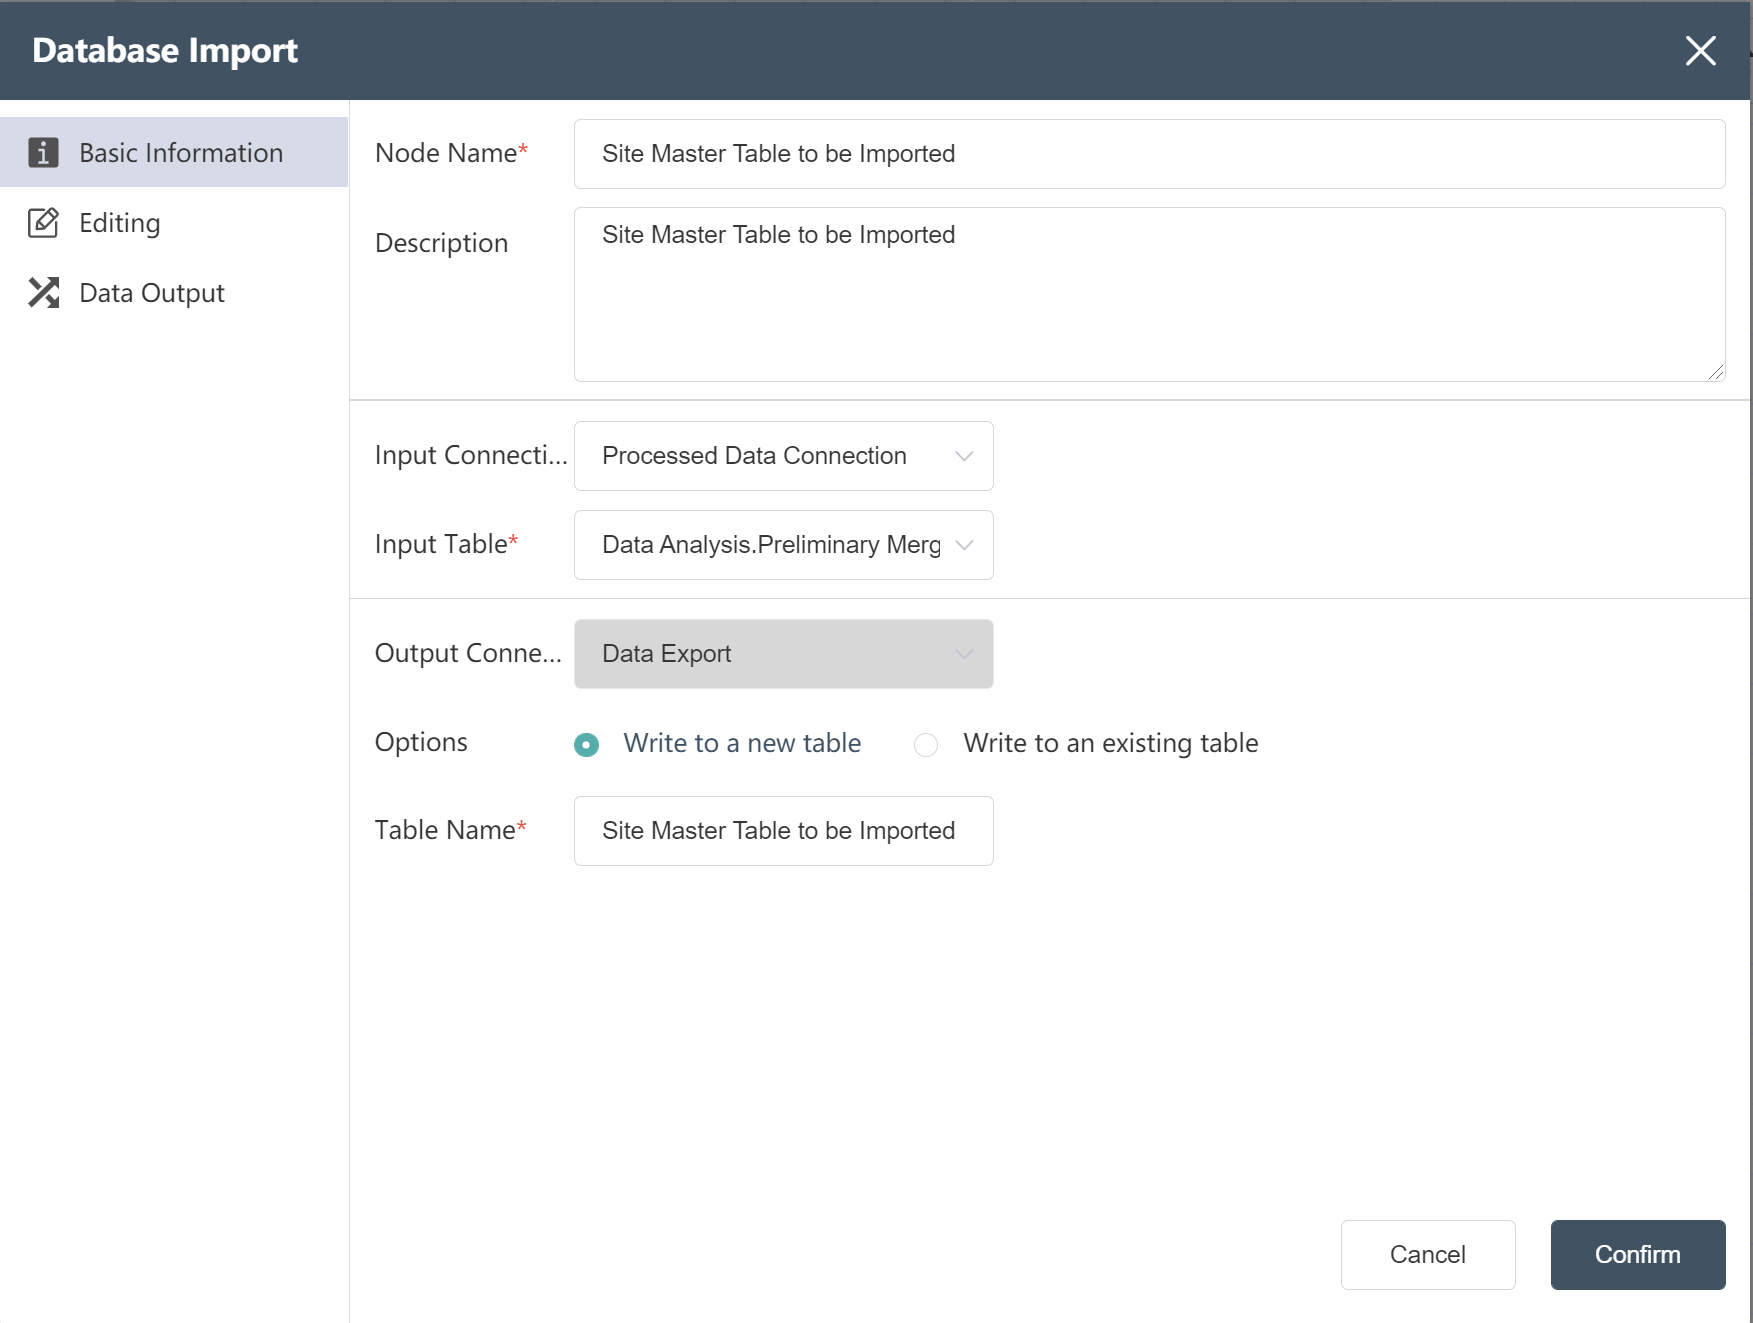
- Import the "Preliminary Merge Site Table" in the node group "-Data Processing Analysis", and fill in according to the picture prompts
- Import the "Baseline Product Empty Table" and "Baseline Site Empty Table" in the node group "SCATLAS® Empty Table Connection", and fill in according to the instructions in the figure
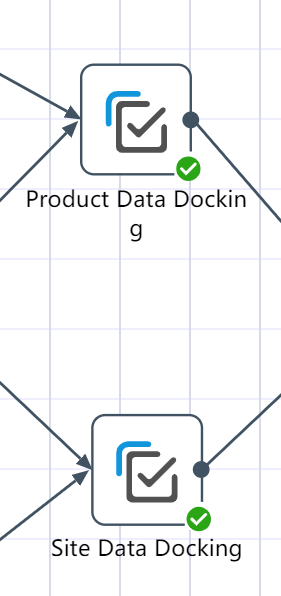
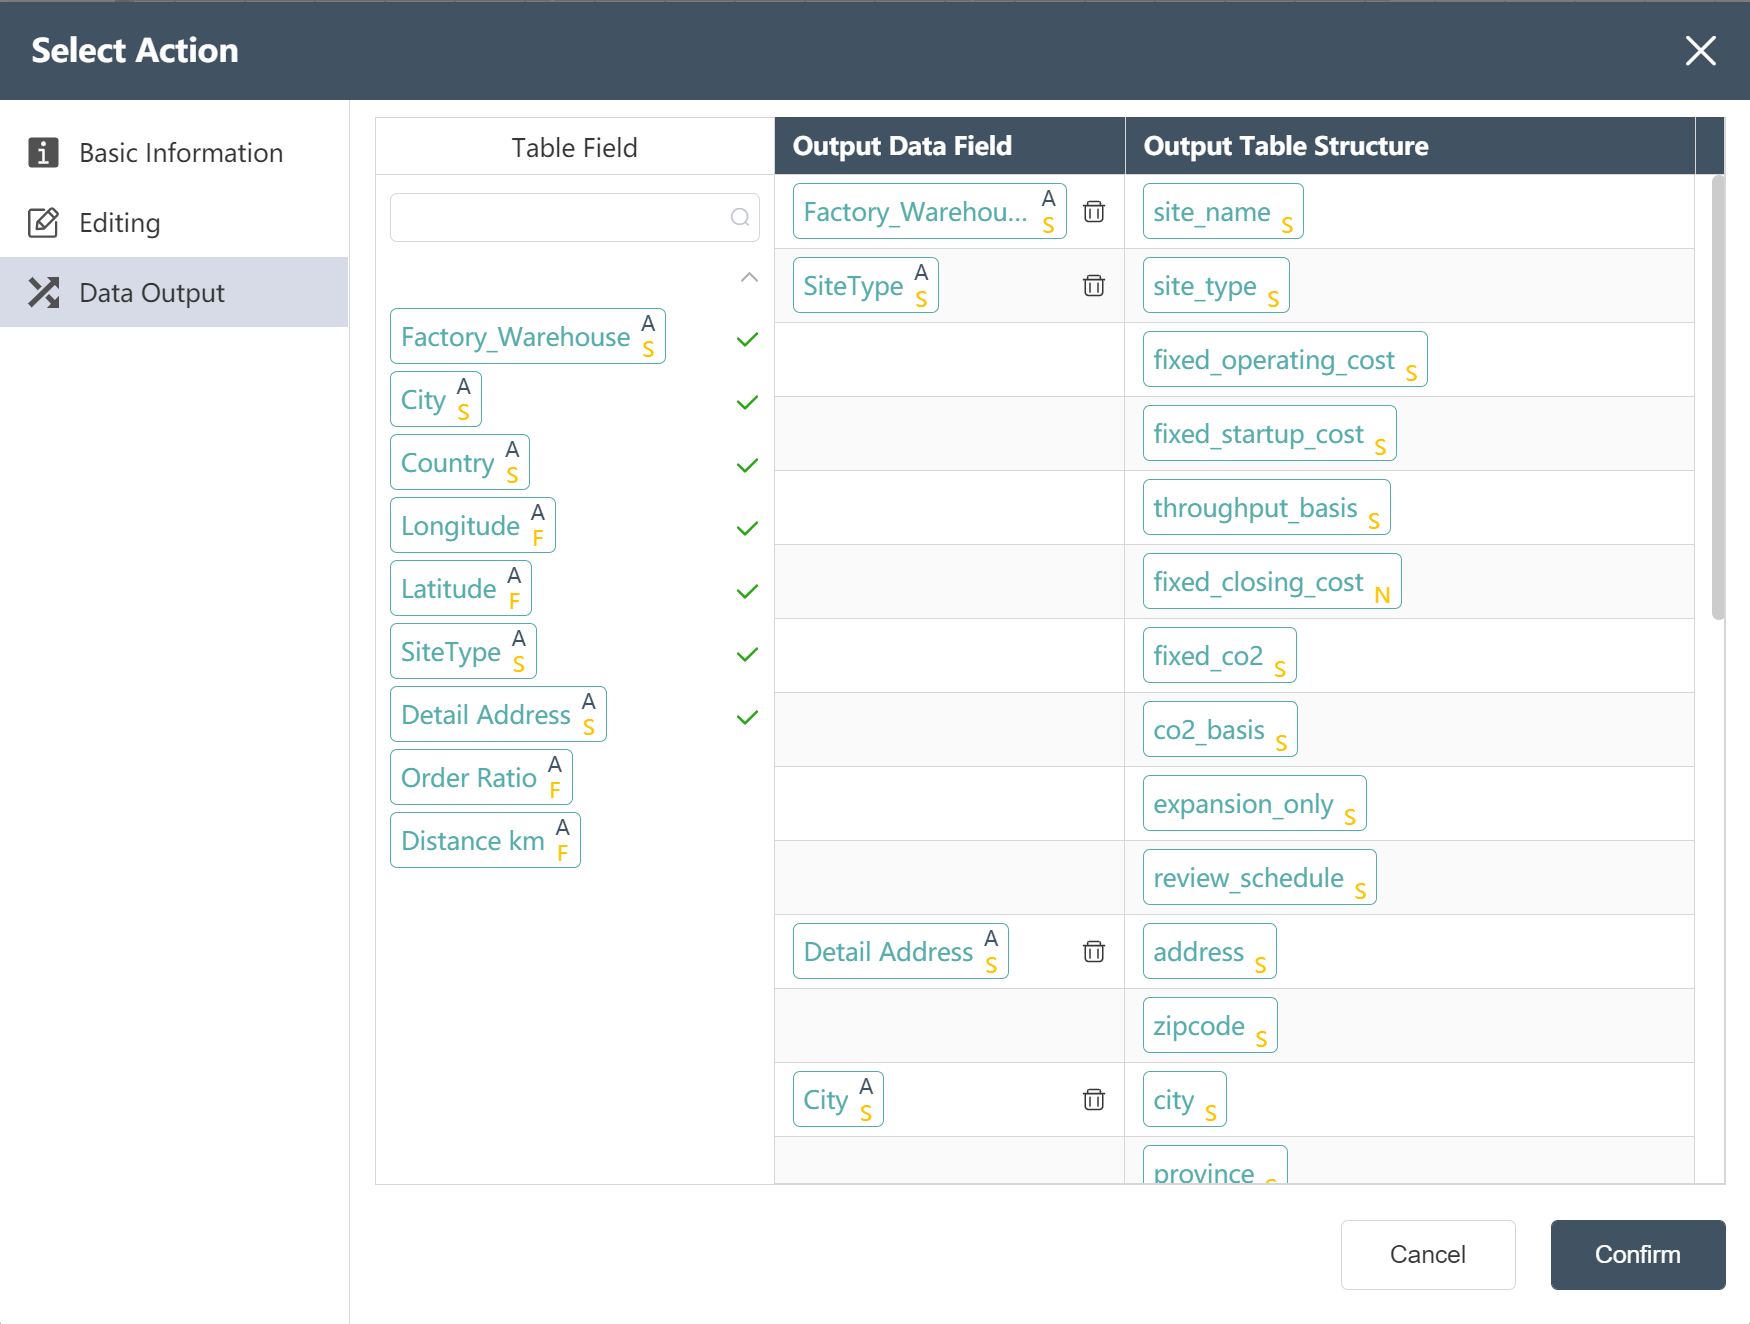
# Data docking: Write the processed product and site data into the empty table to be imported
- Create a new node and write the product master table to the existing product empty table

- Find the corresponding product empty table field for the processed product main table field: ProductName is the product name, volume refers to the unit volume of the product, etc...
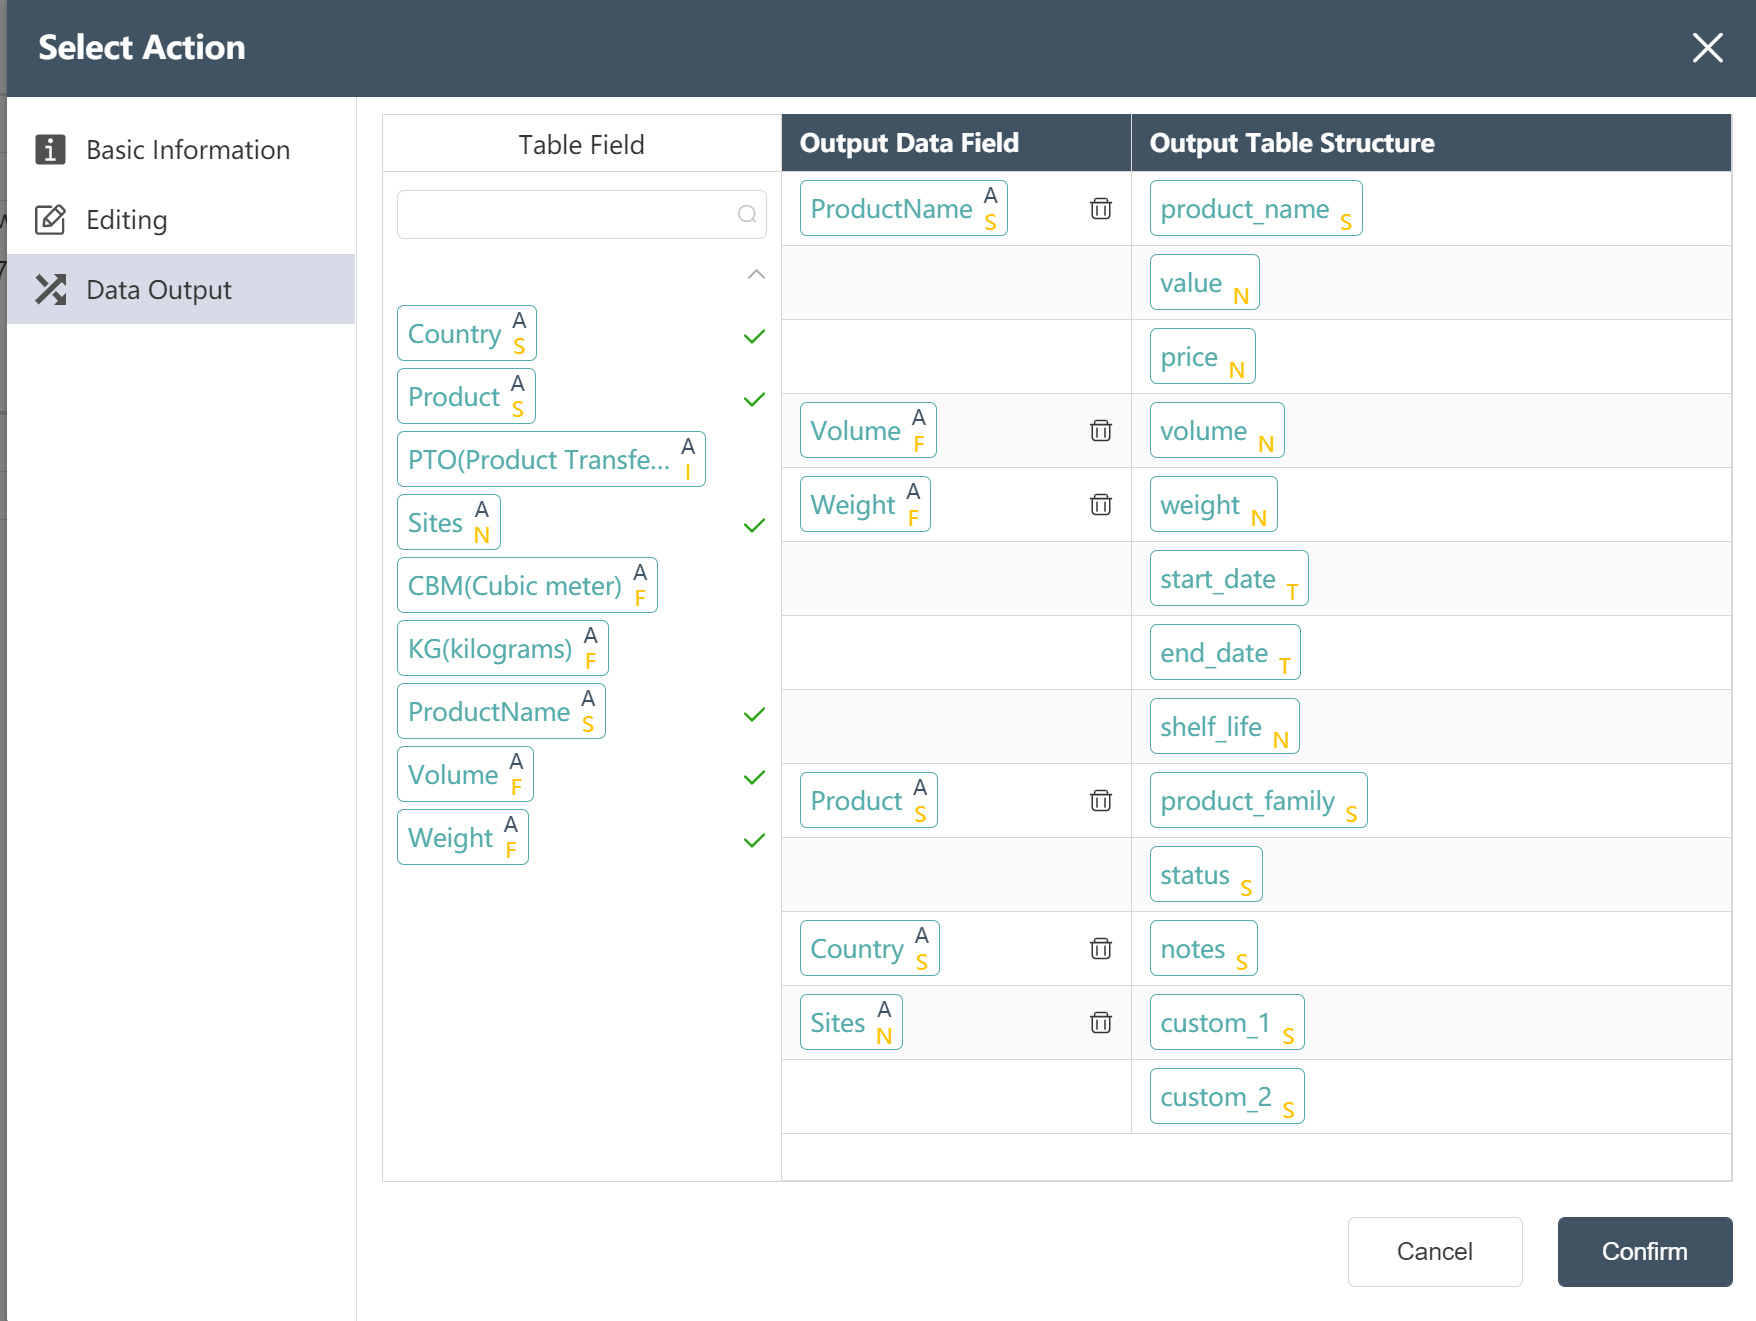
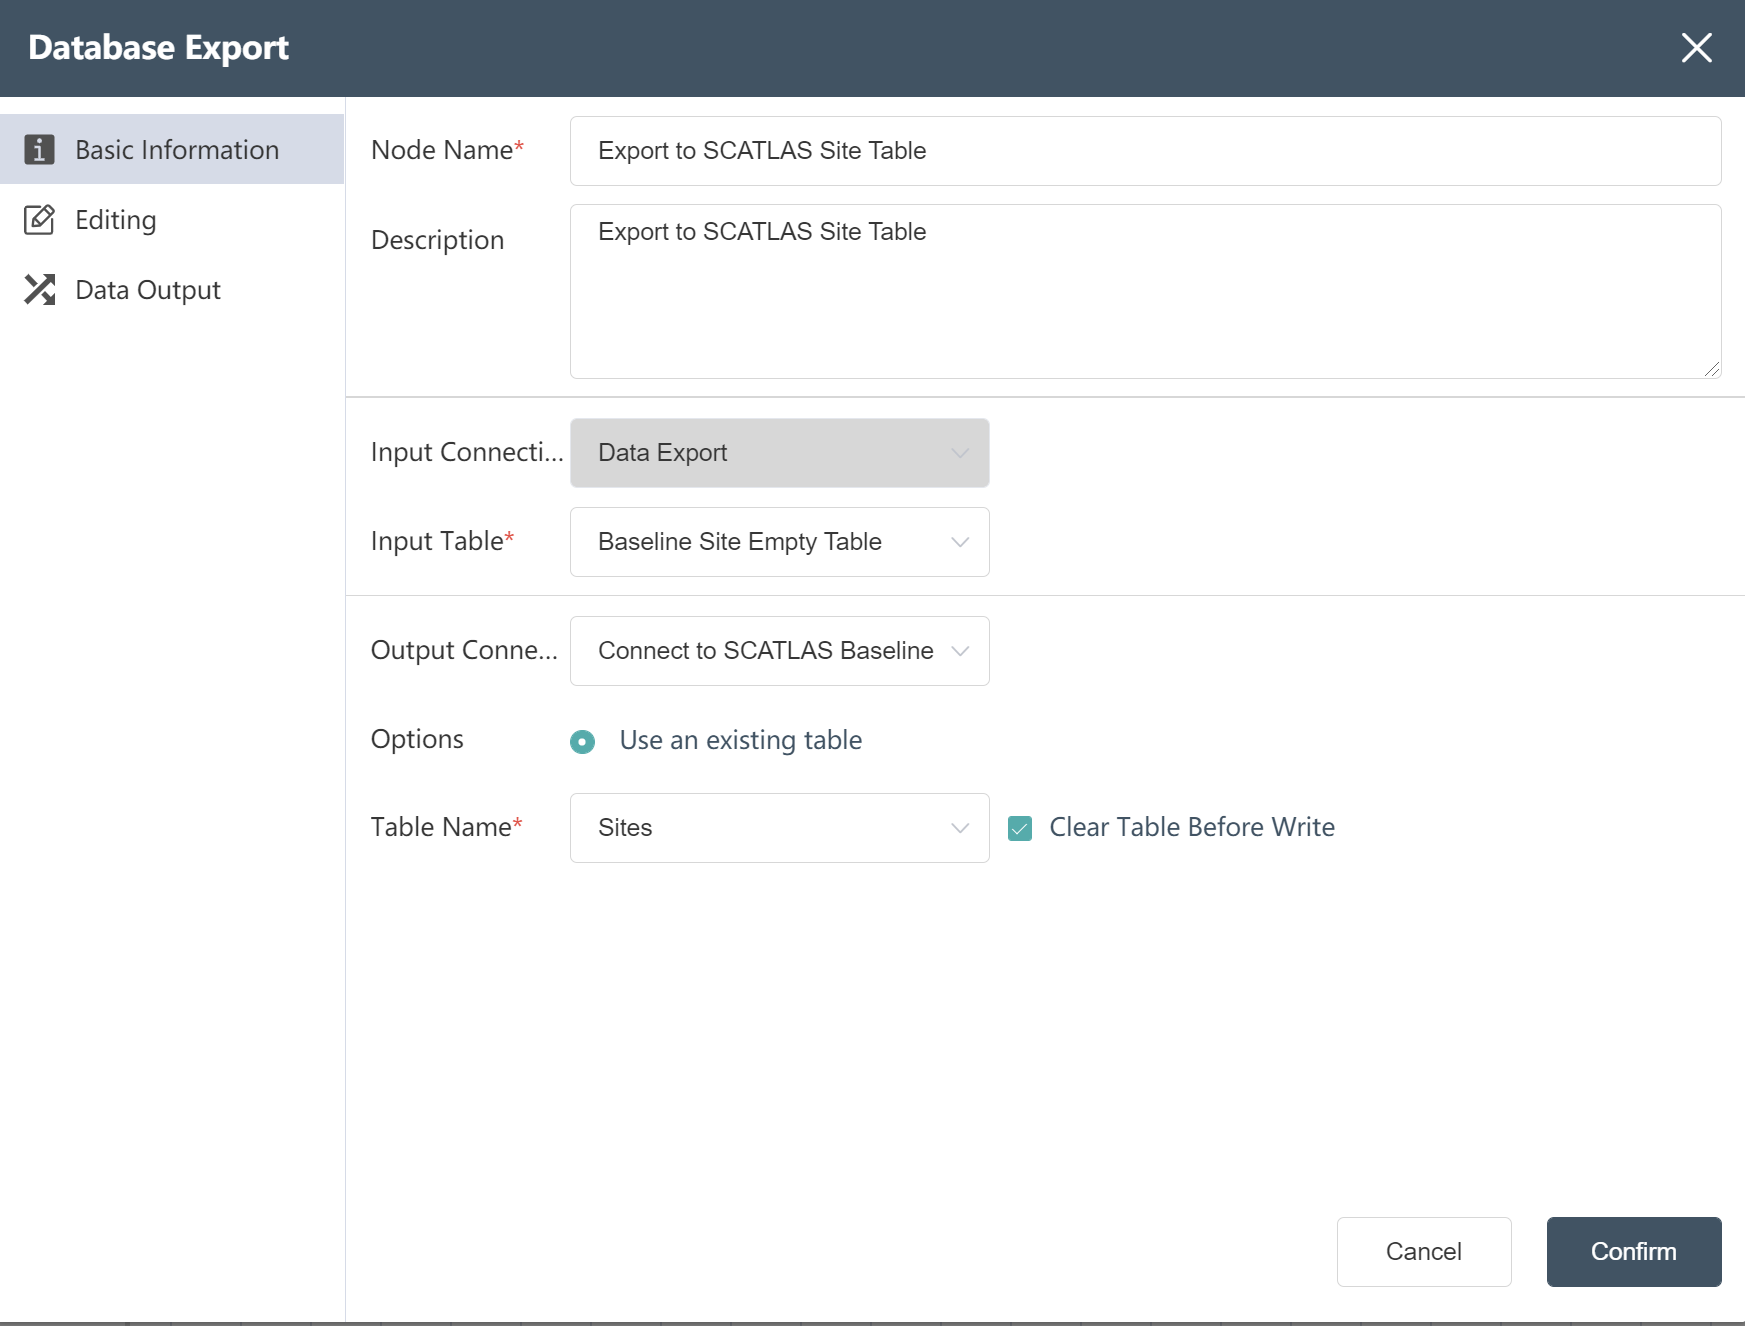
- Create a new node and write the site master table to the existing site empty table
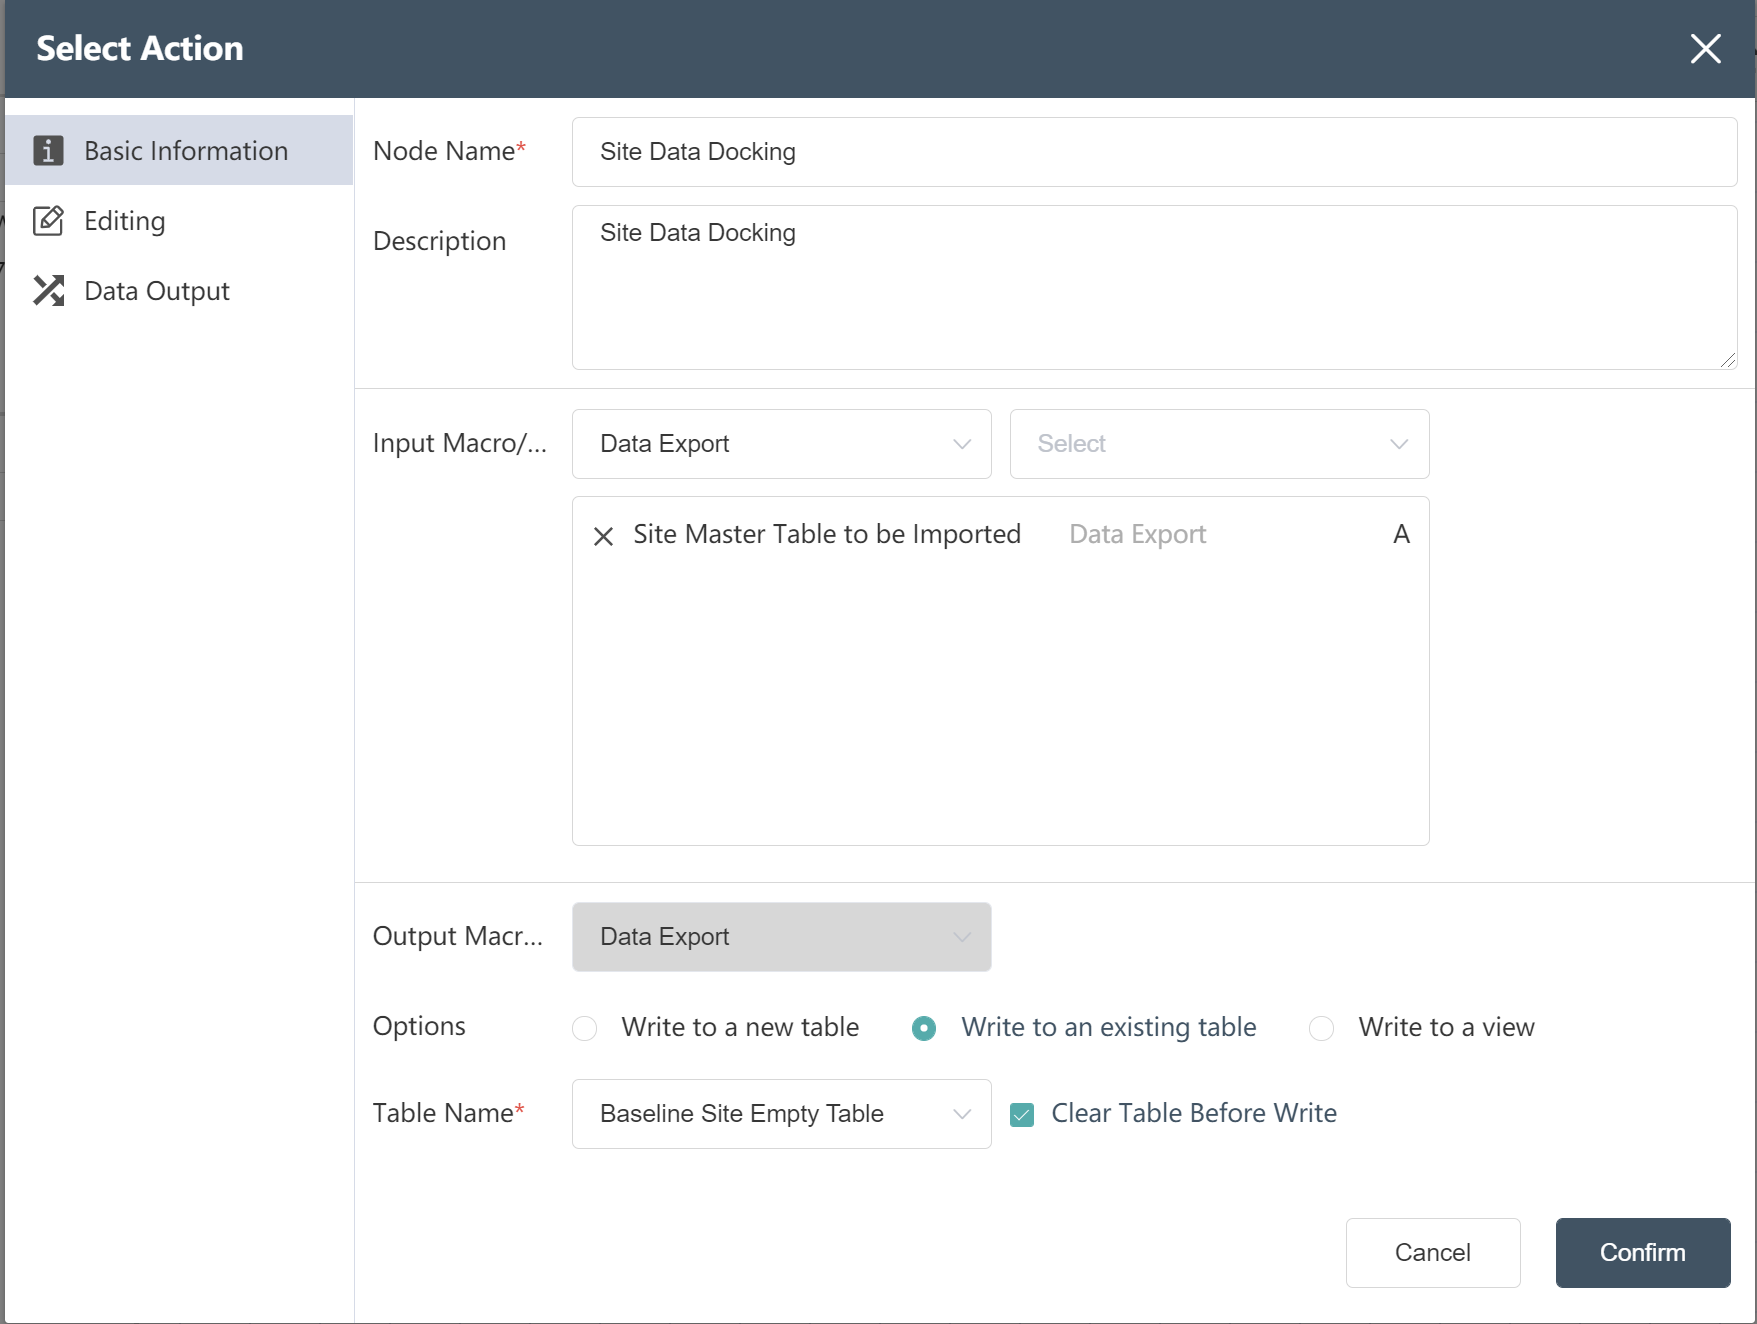
- Find the corresponding site empty table field for the processed site main table field
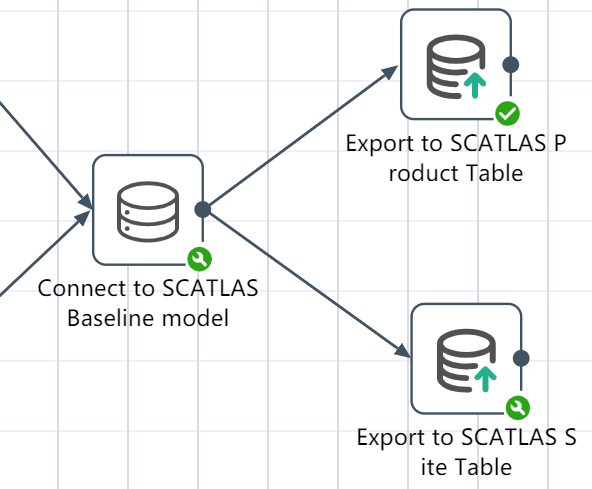
# Connect to SCATLAS®, upload product, site table
Goal: Upload the processed product and site data to the selected model of SCATLAS®, and finally achieve the effect of one-click data processing and one-click data uploading.
- Connect to the SCATLAS®-Baseline model, enter your account number, password, model folder and model name
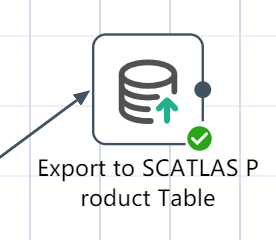
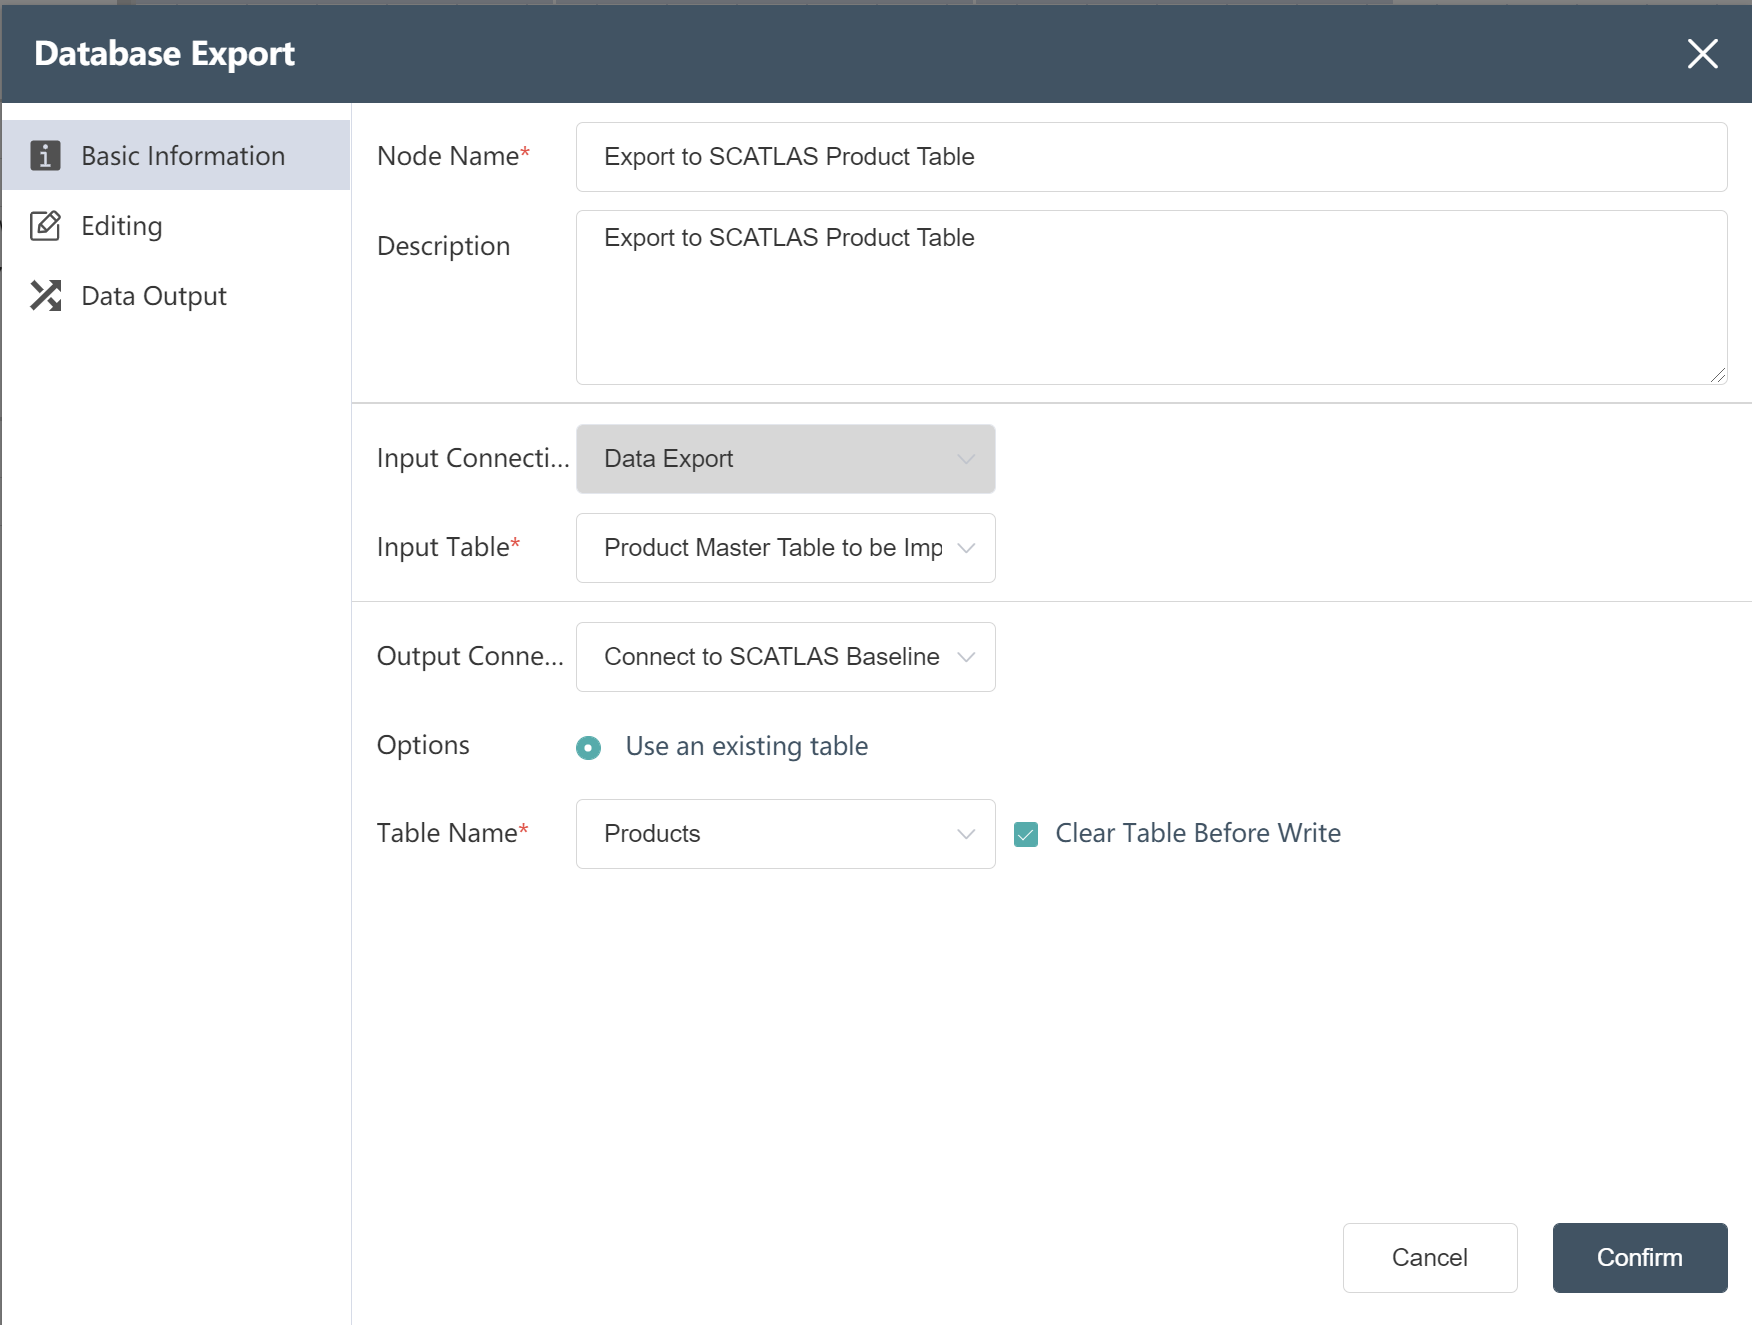
- Double click/drag database export node to canvas
- Fill in Node Name: Export to SCATLAS® Product Table
- Select input connection and input table
- Select output connection
- Select write mode
- Select table name: Products
- Check Clear table before writing
- Click to confirm
- Follow the steps of ②~⑨ to create a new site master table export node
# Running Node Groups: - Data Export to SCATLAS®
- Connect according to the steps shown in the figure
- Click the Execute button in the upper right corner of the canvas
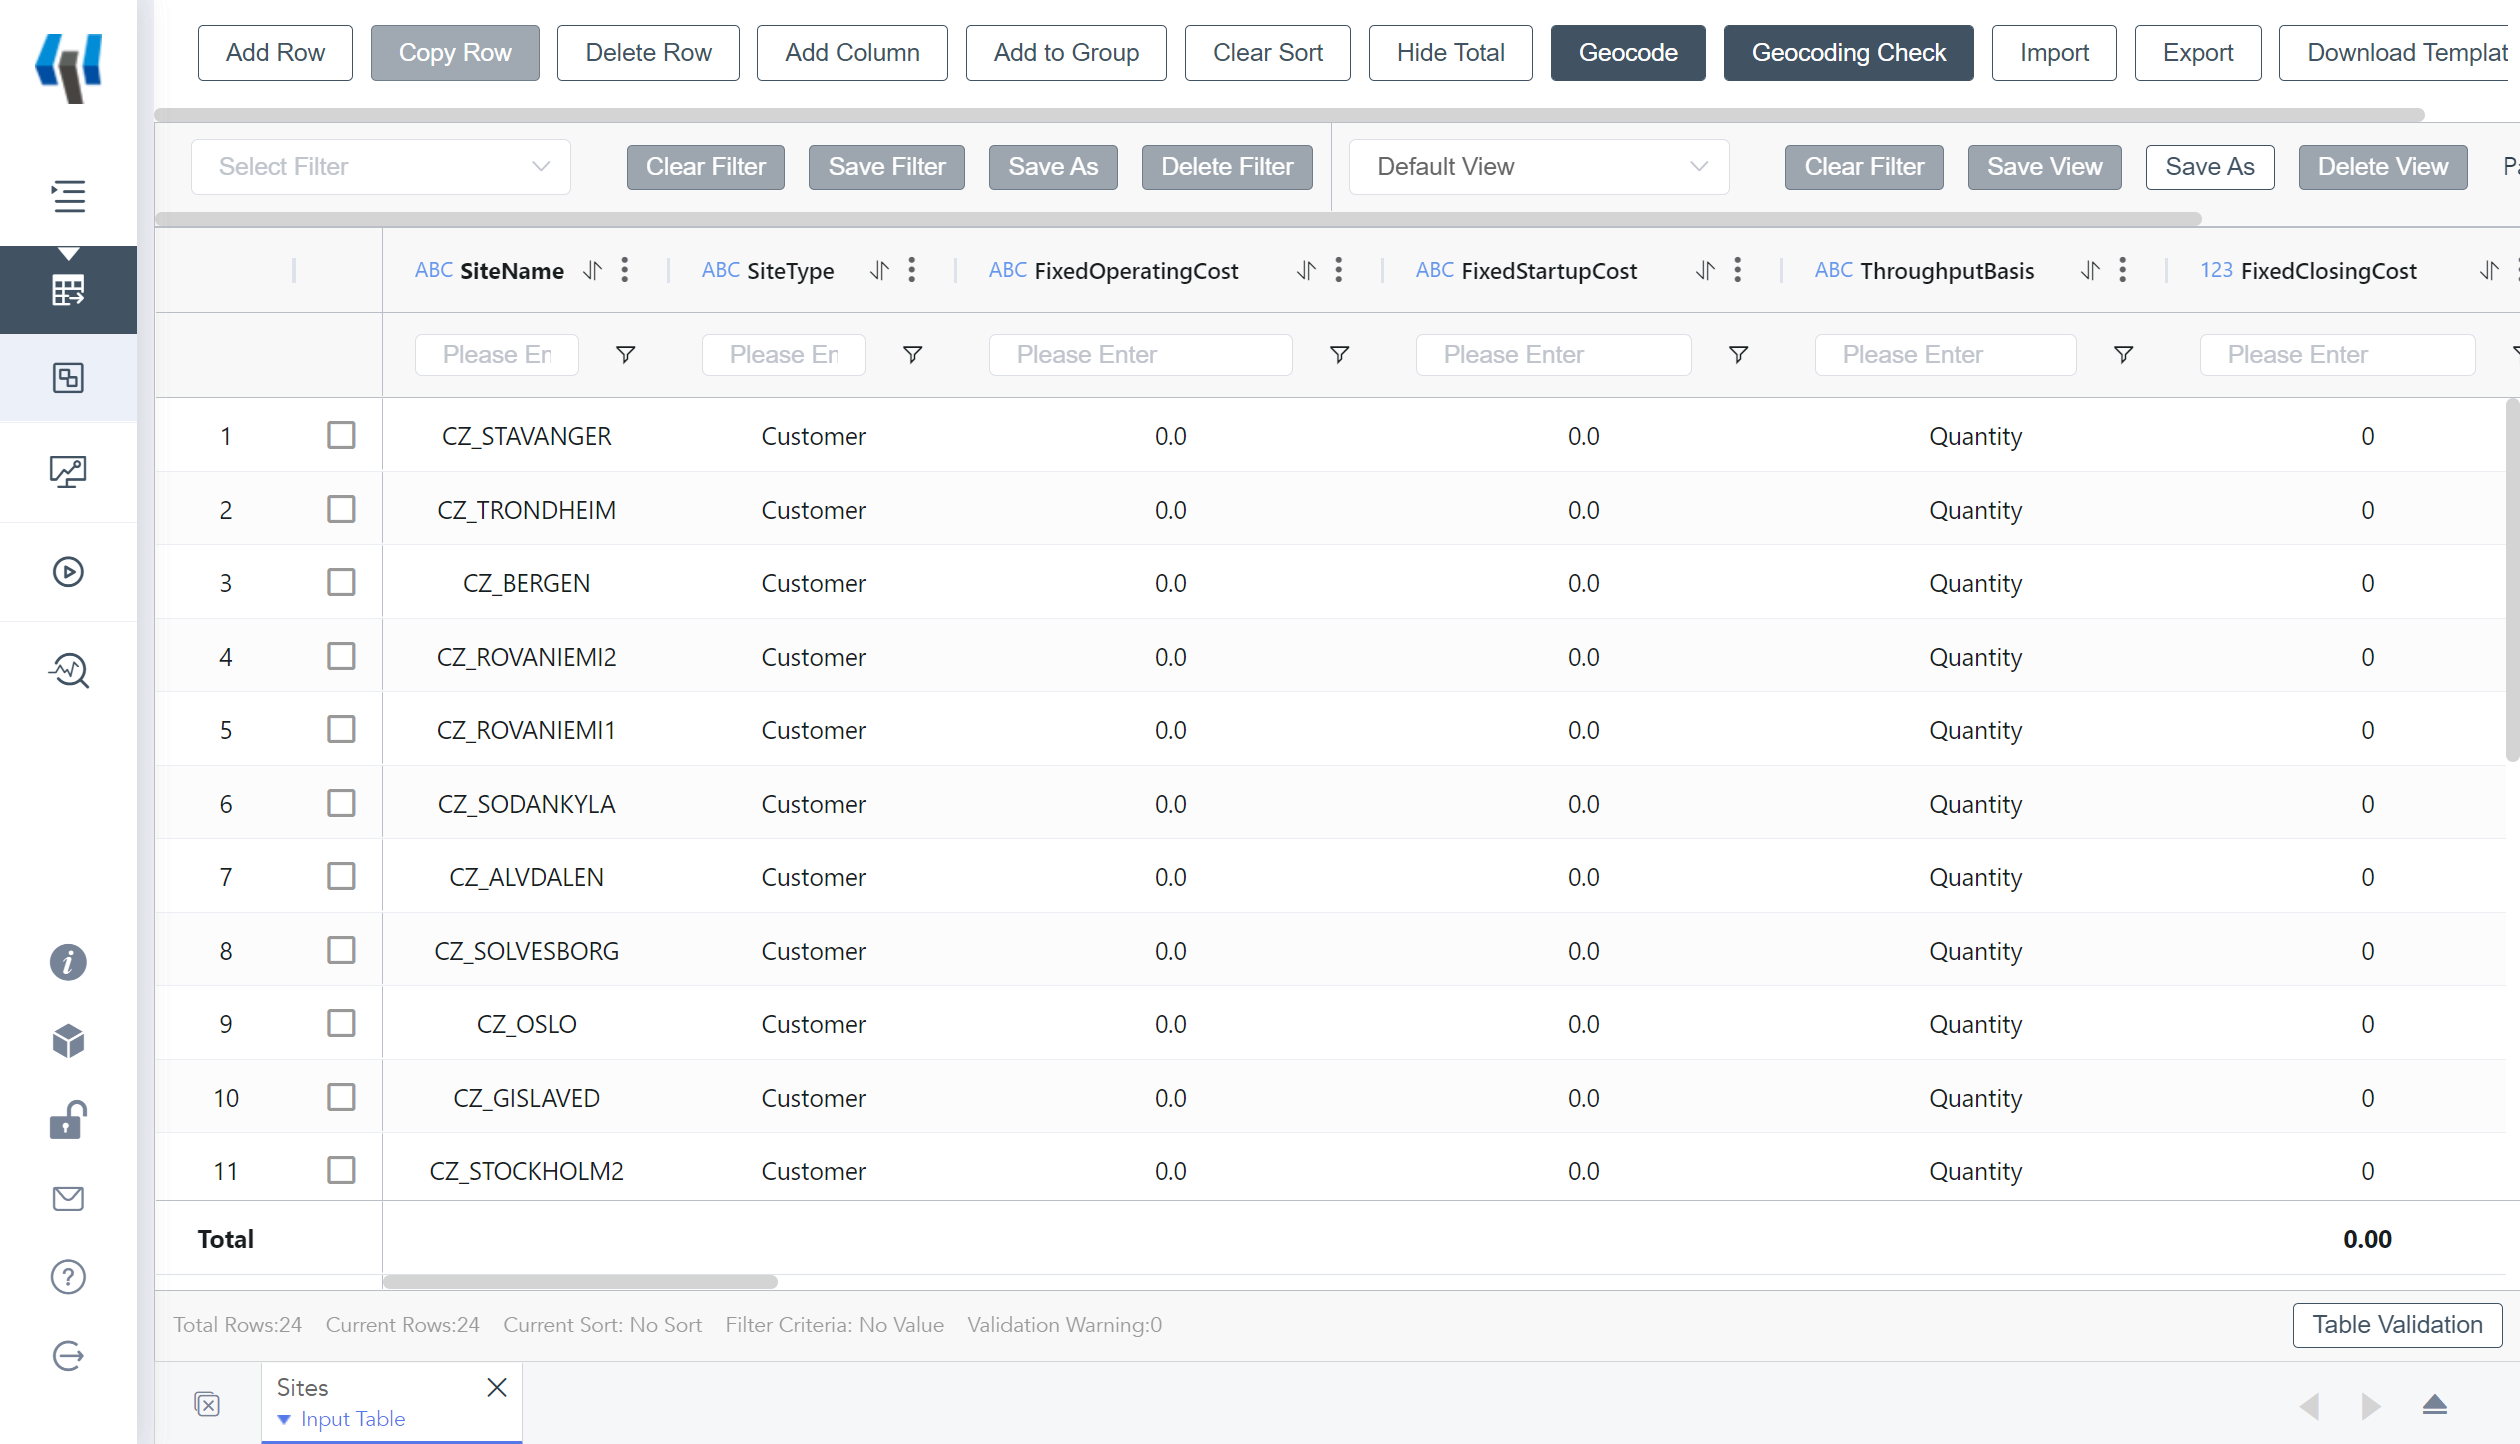
- Check run results in the Baseline model of SCATLAS®
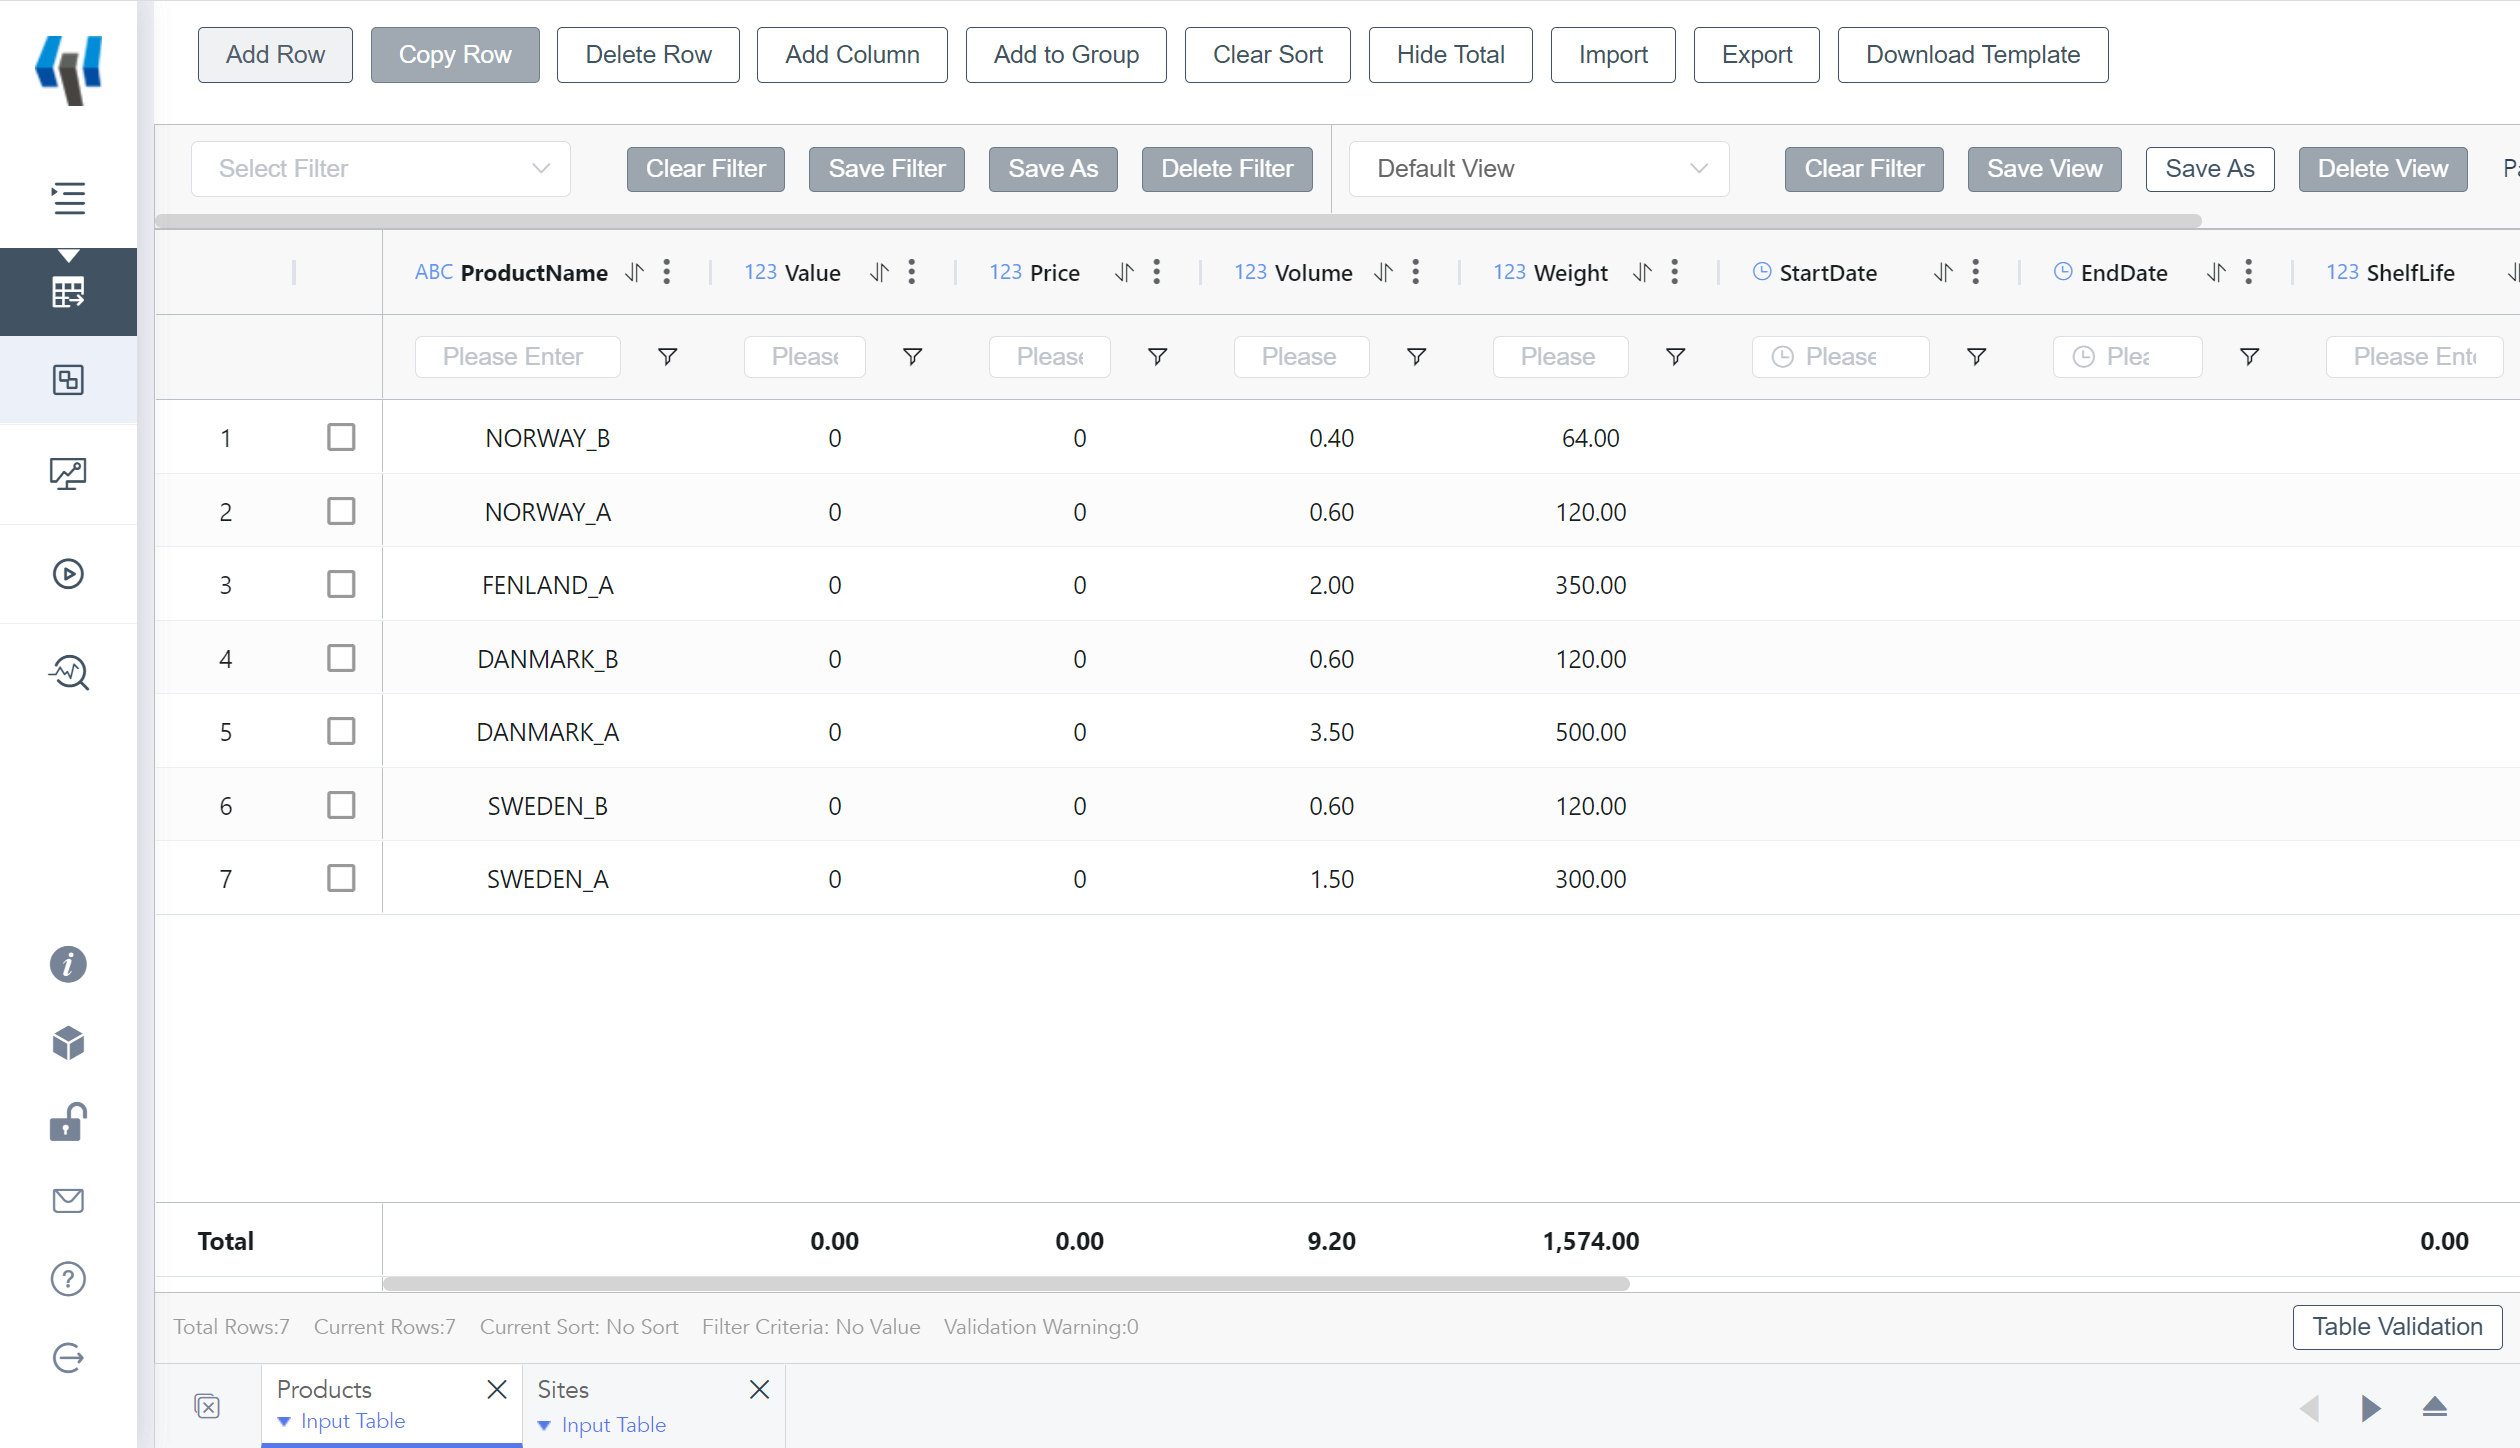
After the operation is completed, you will get 2 input tables in the model element of SCATLAS®: product, site.
Product Sheet in SCATLAS®
Site Table in SCATLAS®
# Export of other tables
Goal: Upload the processed customer orders, production/purchasing/transportation strategies, facility inbound and outbound cost tables, and flow restriction data to the selected model of SCATLAS®, and finally achieve the effect of one-click automatic modeling.
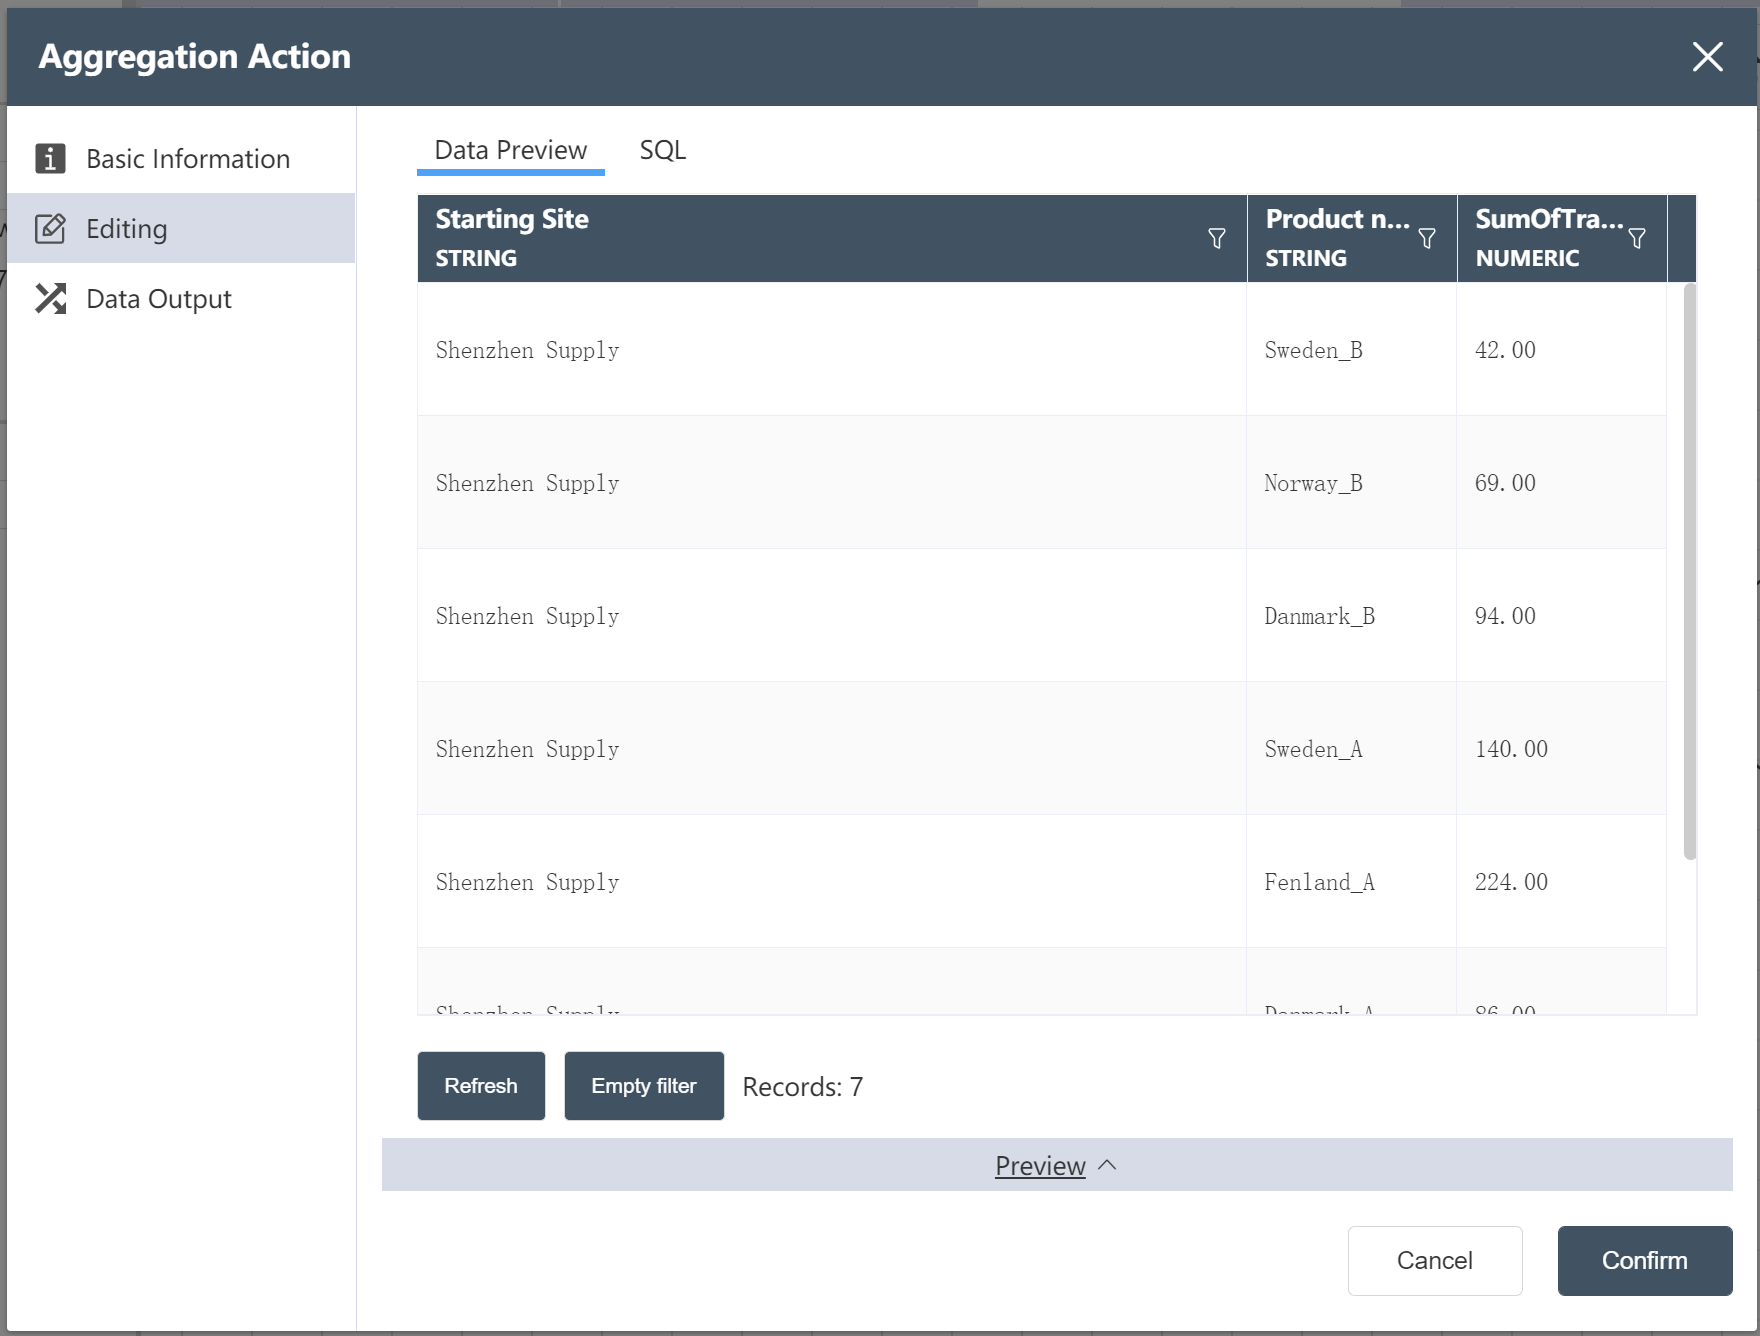
 New Node: Aggregate Production Policy
- Fill in the basic information as shown below
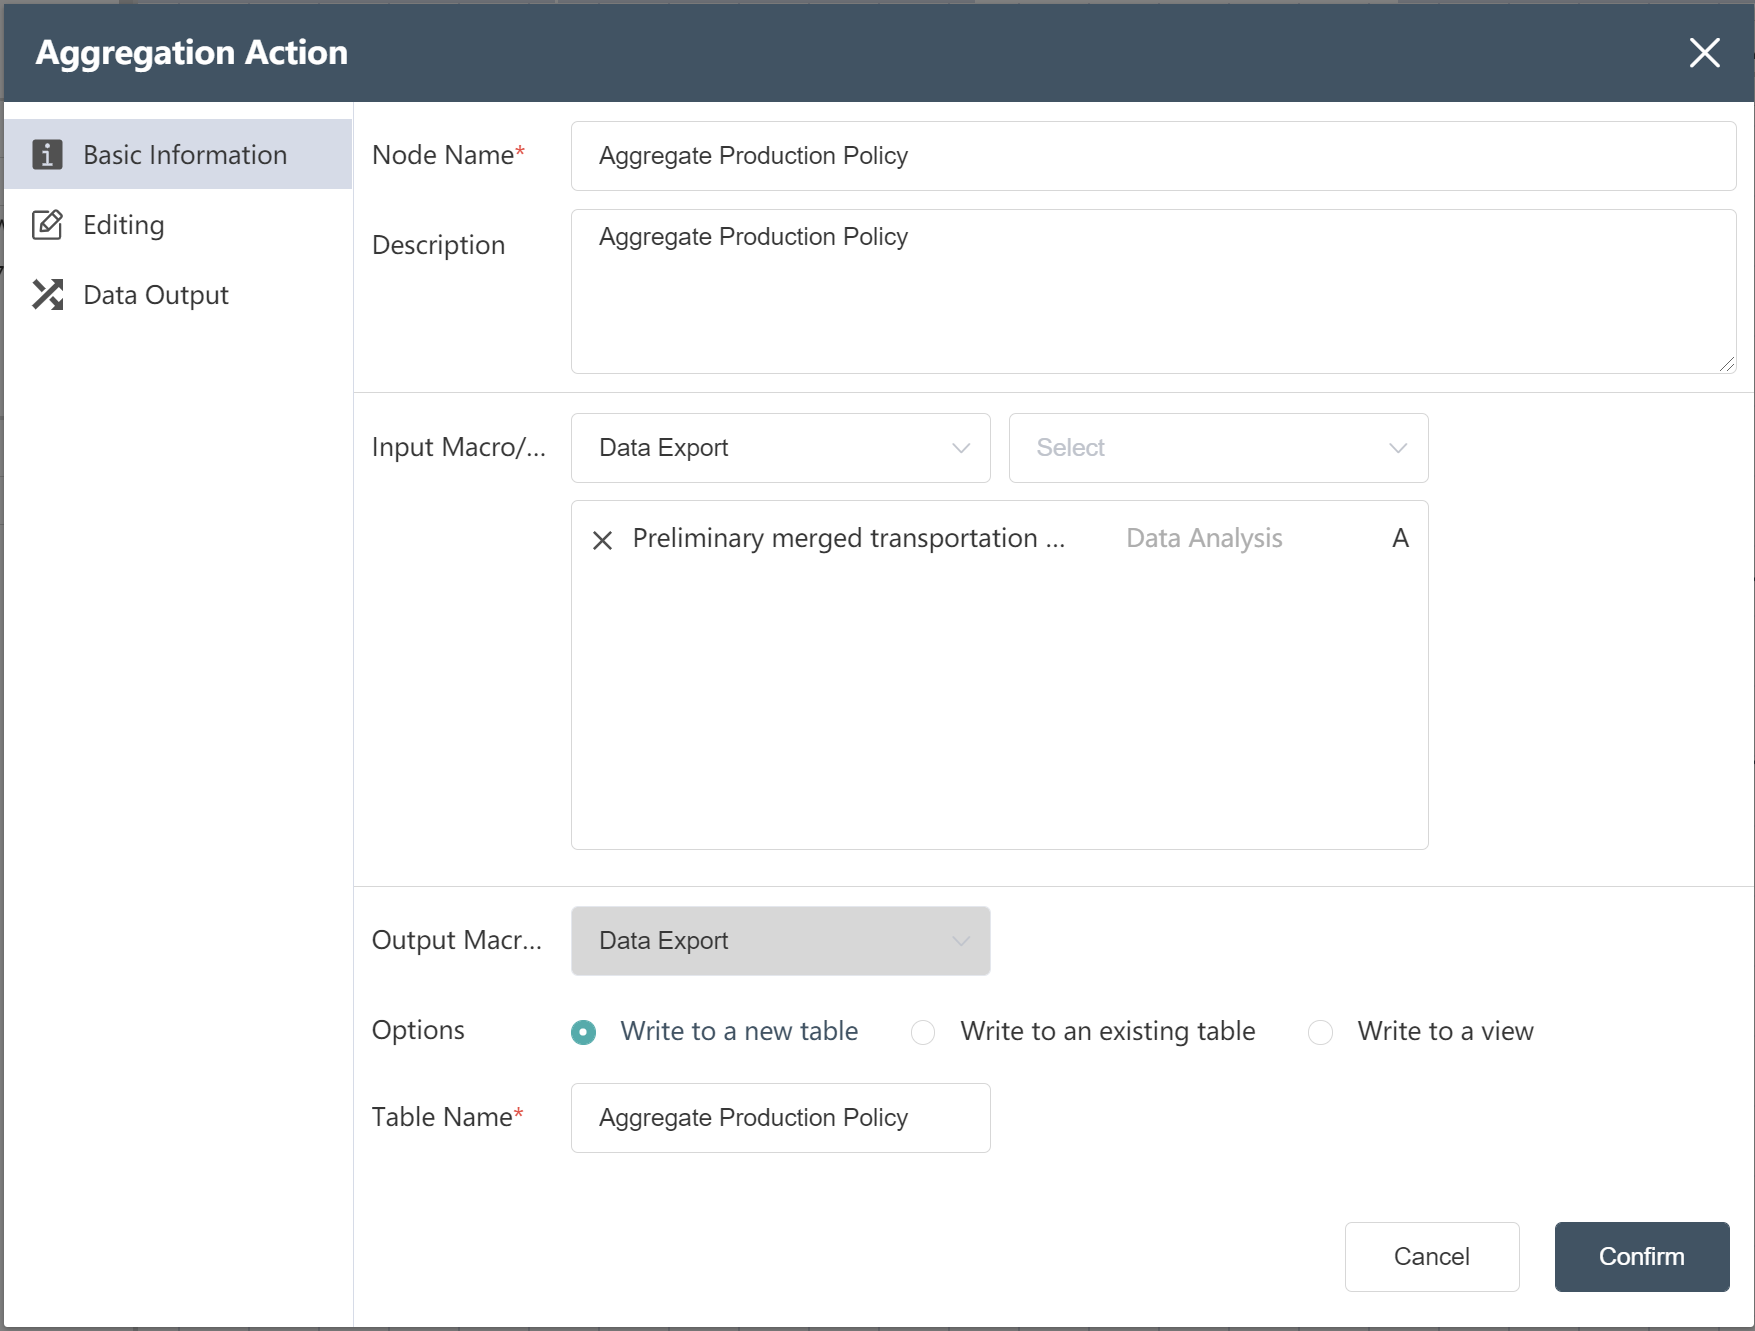
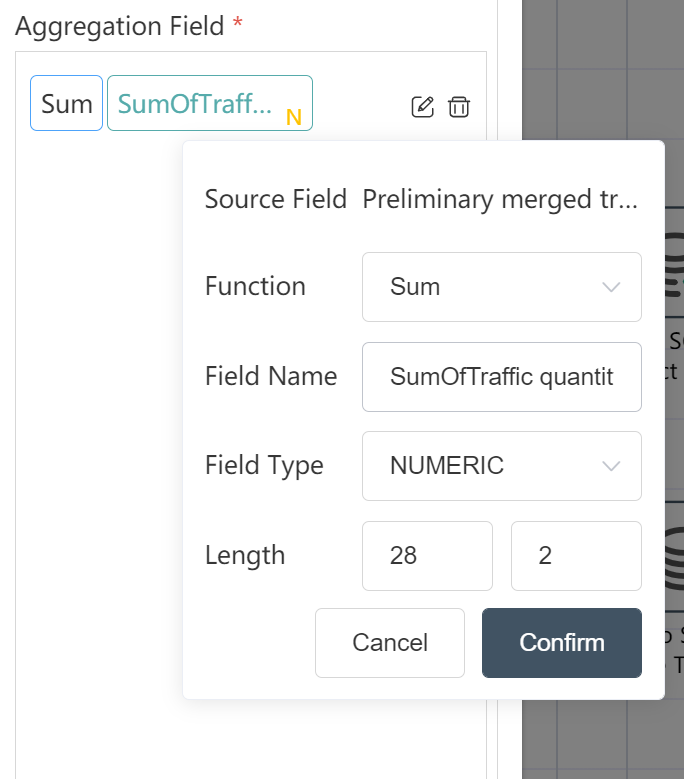
- In the data editing menu, set the starting point name and product name as the grouping field, set the traffic quantity as the aggregation result, and select Sum as the aggregation function.
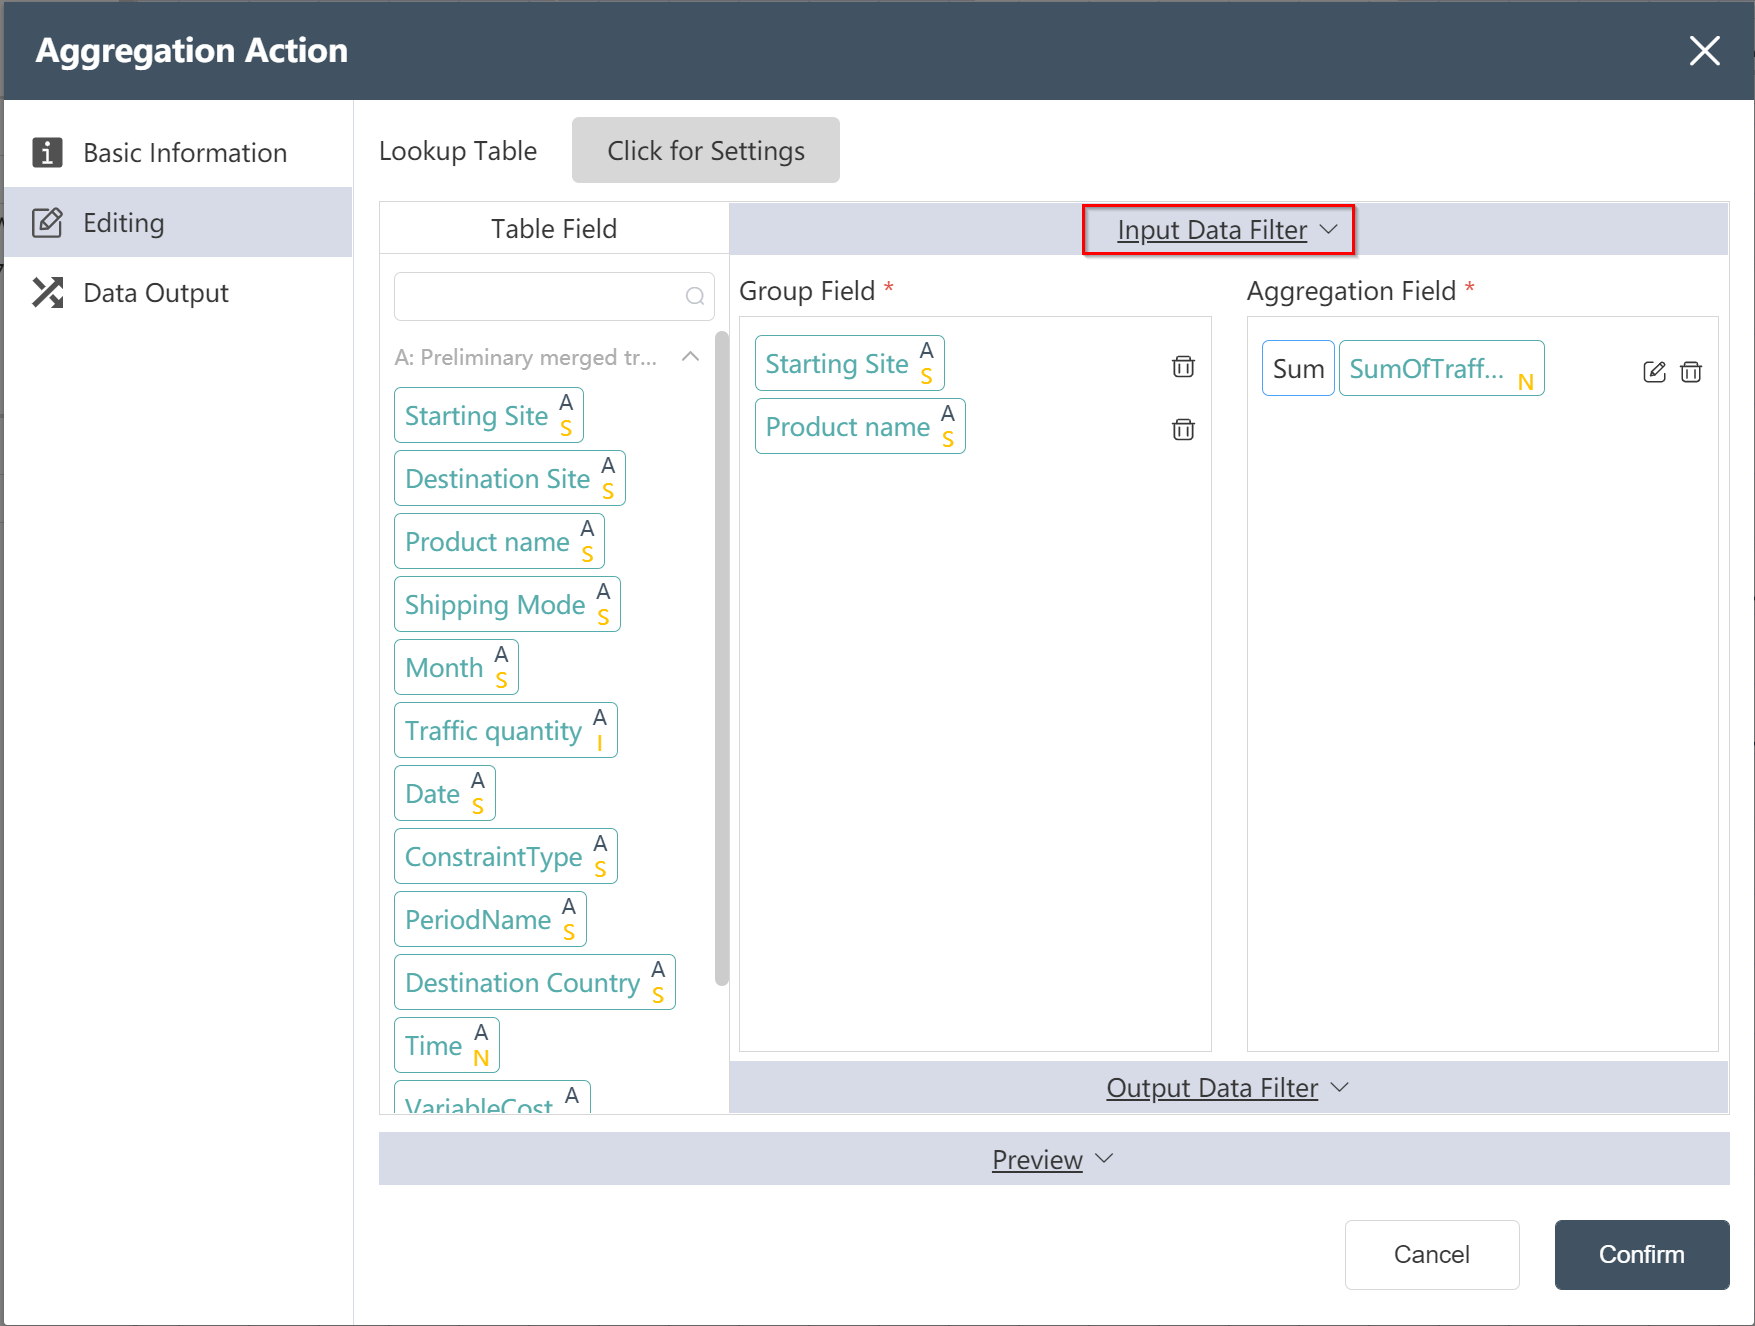
- Click the input data filter, and enter the filter expression as prompted as shown in the figure below, in order to filter out the data supplied from Europe/Shenzhen

- Click Preview to check the aggregated results, there are 14 items in total, indicating the quantity of each product supplied by each supply point
- Follow the steps of ③~⑦ to aggregate purchasing/transportation/inventory policies and flow restrictions
- Production/Purchasing/Transportation/Inventory Policy and flow restriction data connection
- Connect to SCATLAS® and upload data to the production/purchasing/shipping/inventory strategy and flow restriction tables in the model
At the end of the DASTRO® operation, you can run the SCATLAS® model